Copyright
©The Author(s) 2022.
World J Gastrointest Oncol. Nov 15, 2022; 14(11): 2273-2287
Published online Nov 15, 2022. doi: 10.4251/wjgo.v14.i11.2273
Published online Nov 15, 2022. doi: 10.4251/wjgo.v14.i11.2273
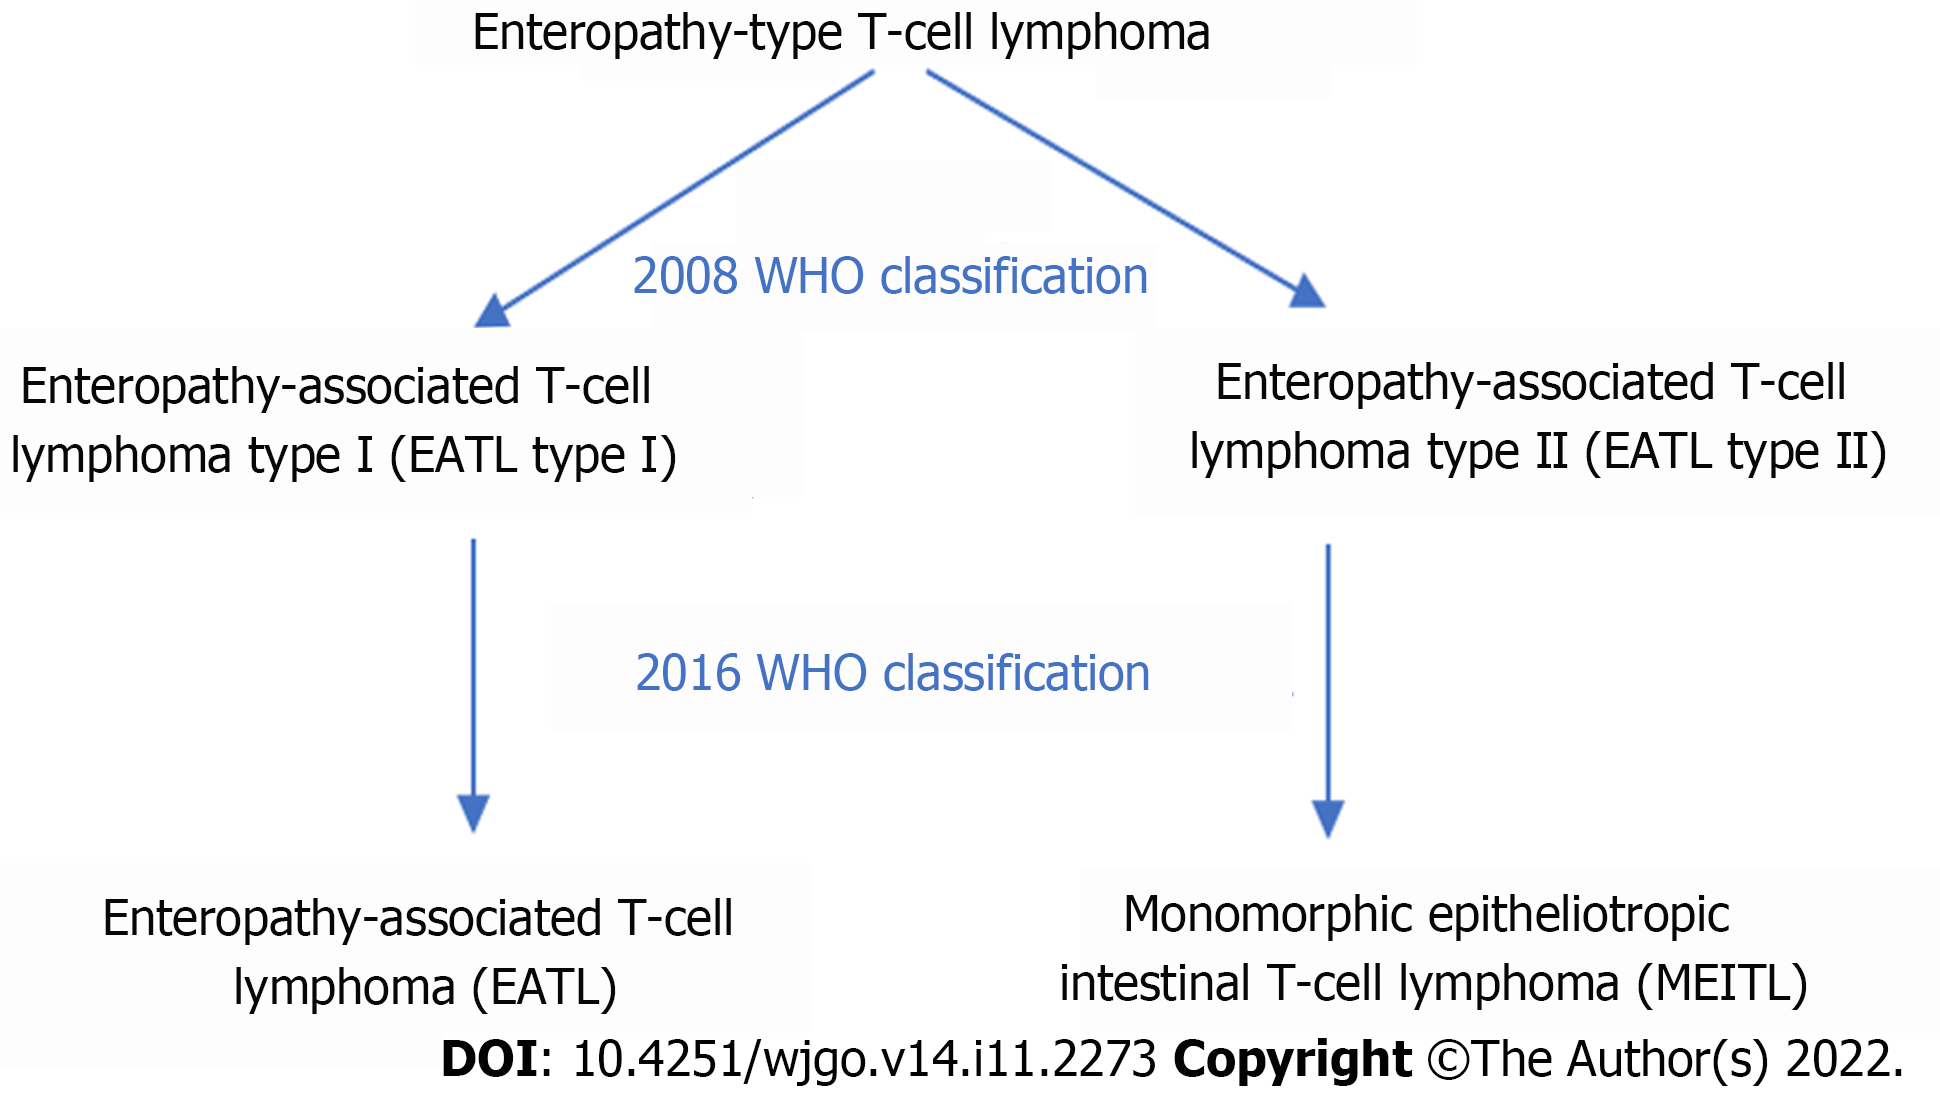
Figure 1
Evolution of classification of monomorphic epitheliotropic intestinal T-cell lymphoma.
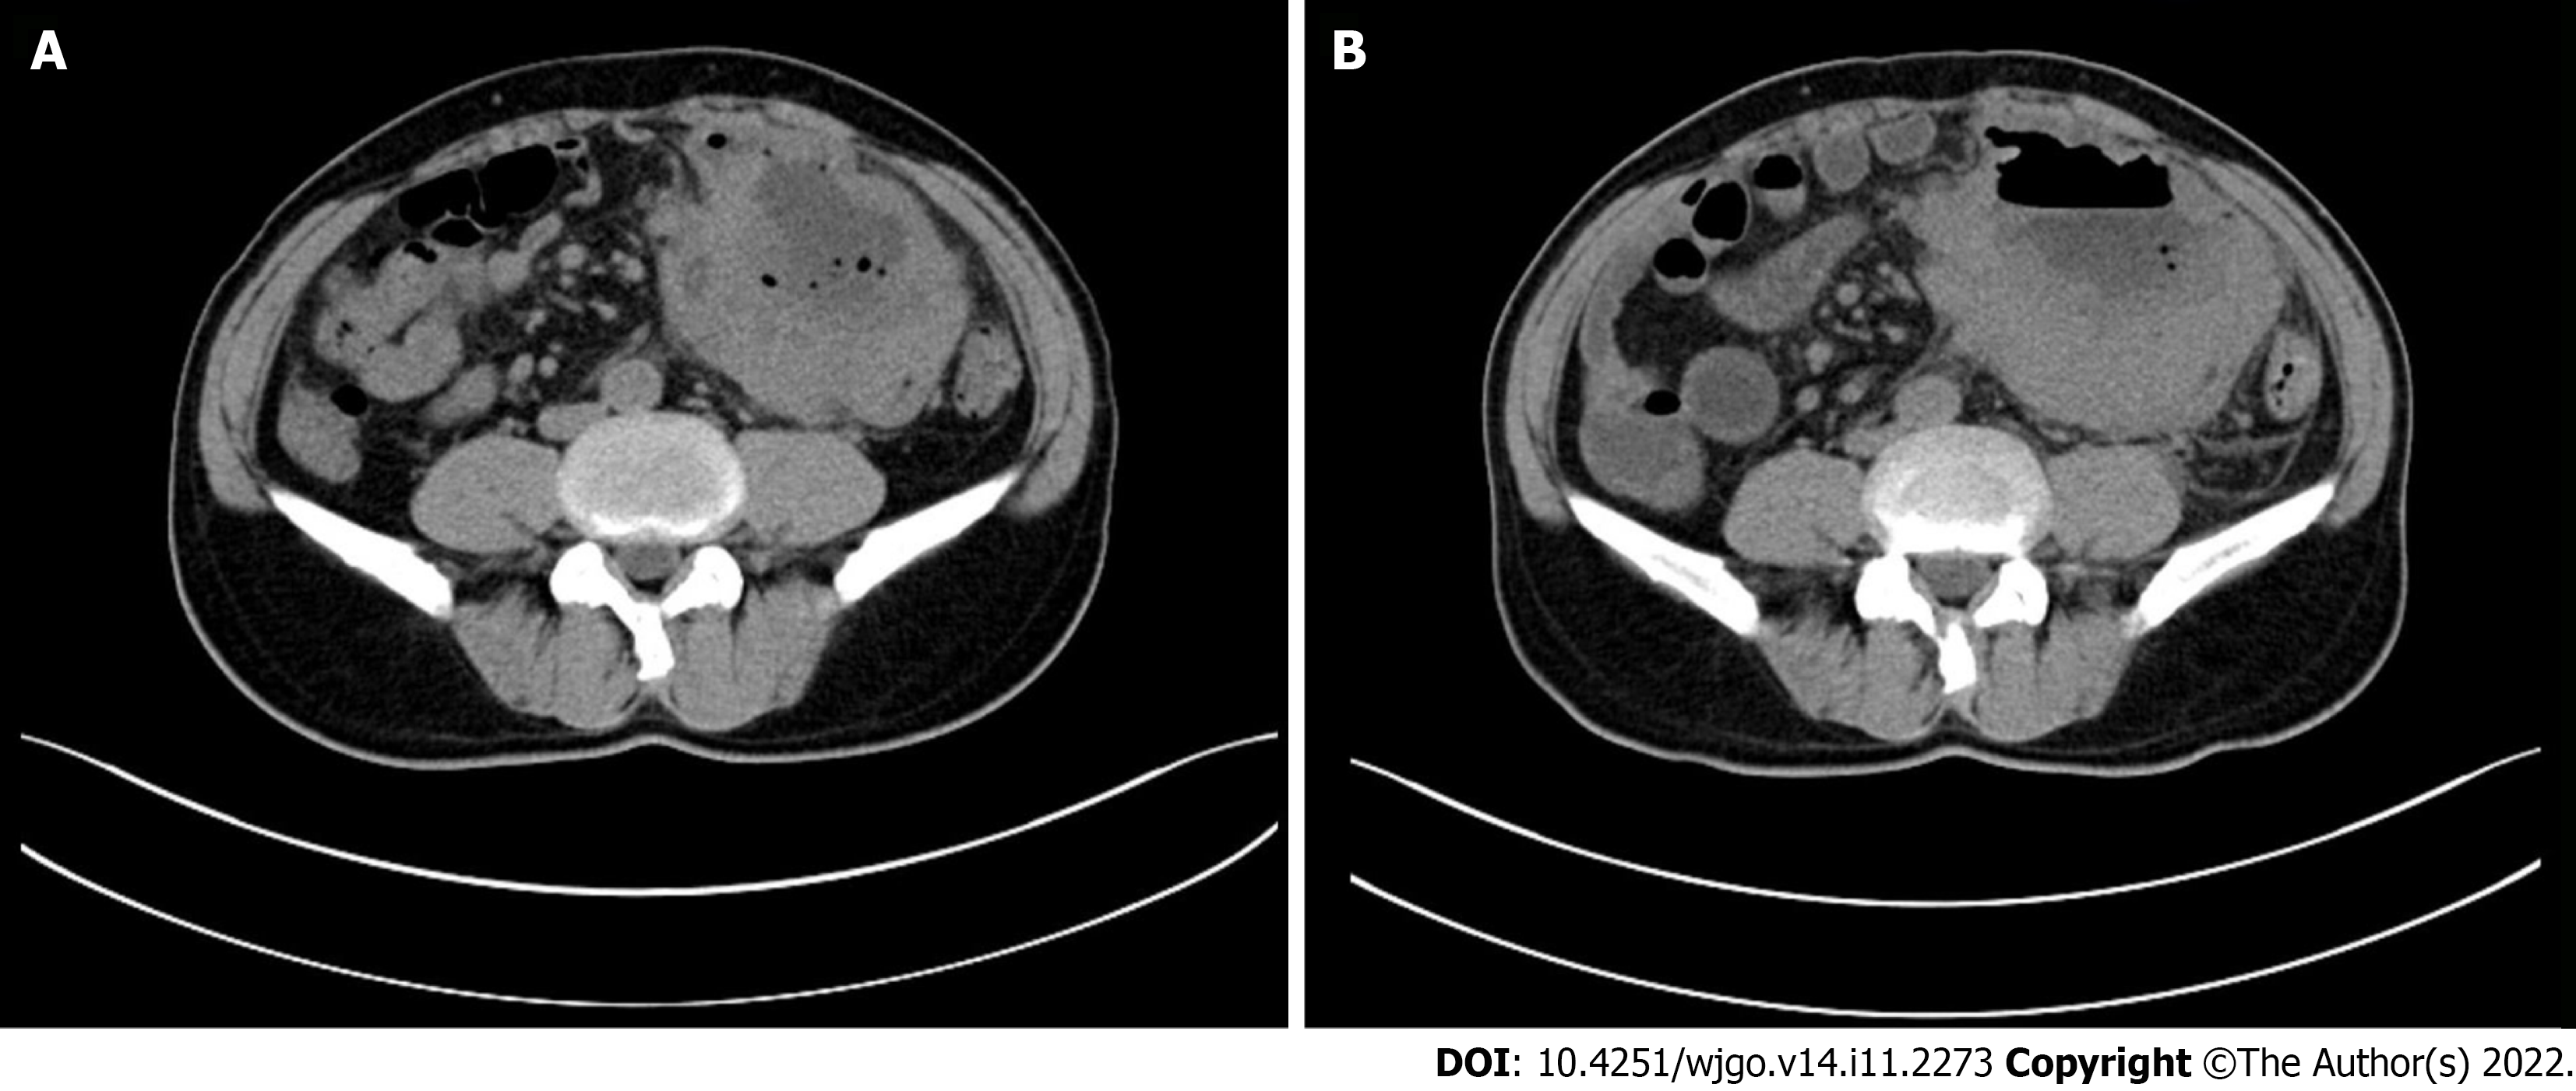
Figure 2 Computed tomography images.
A: First computed tomography (CT) scan; B: Second CT scan 2 wk later. Multiple enlarged mesenteric lymph nodes and apparent necrosis were noted on the second CT scan.
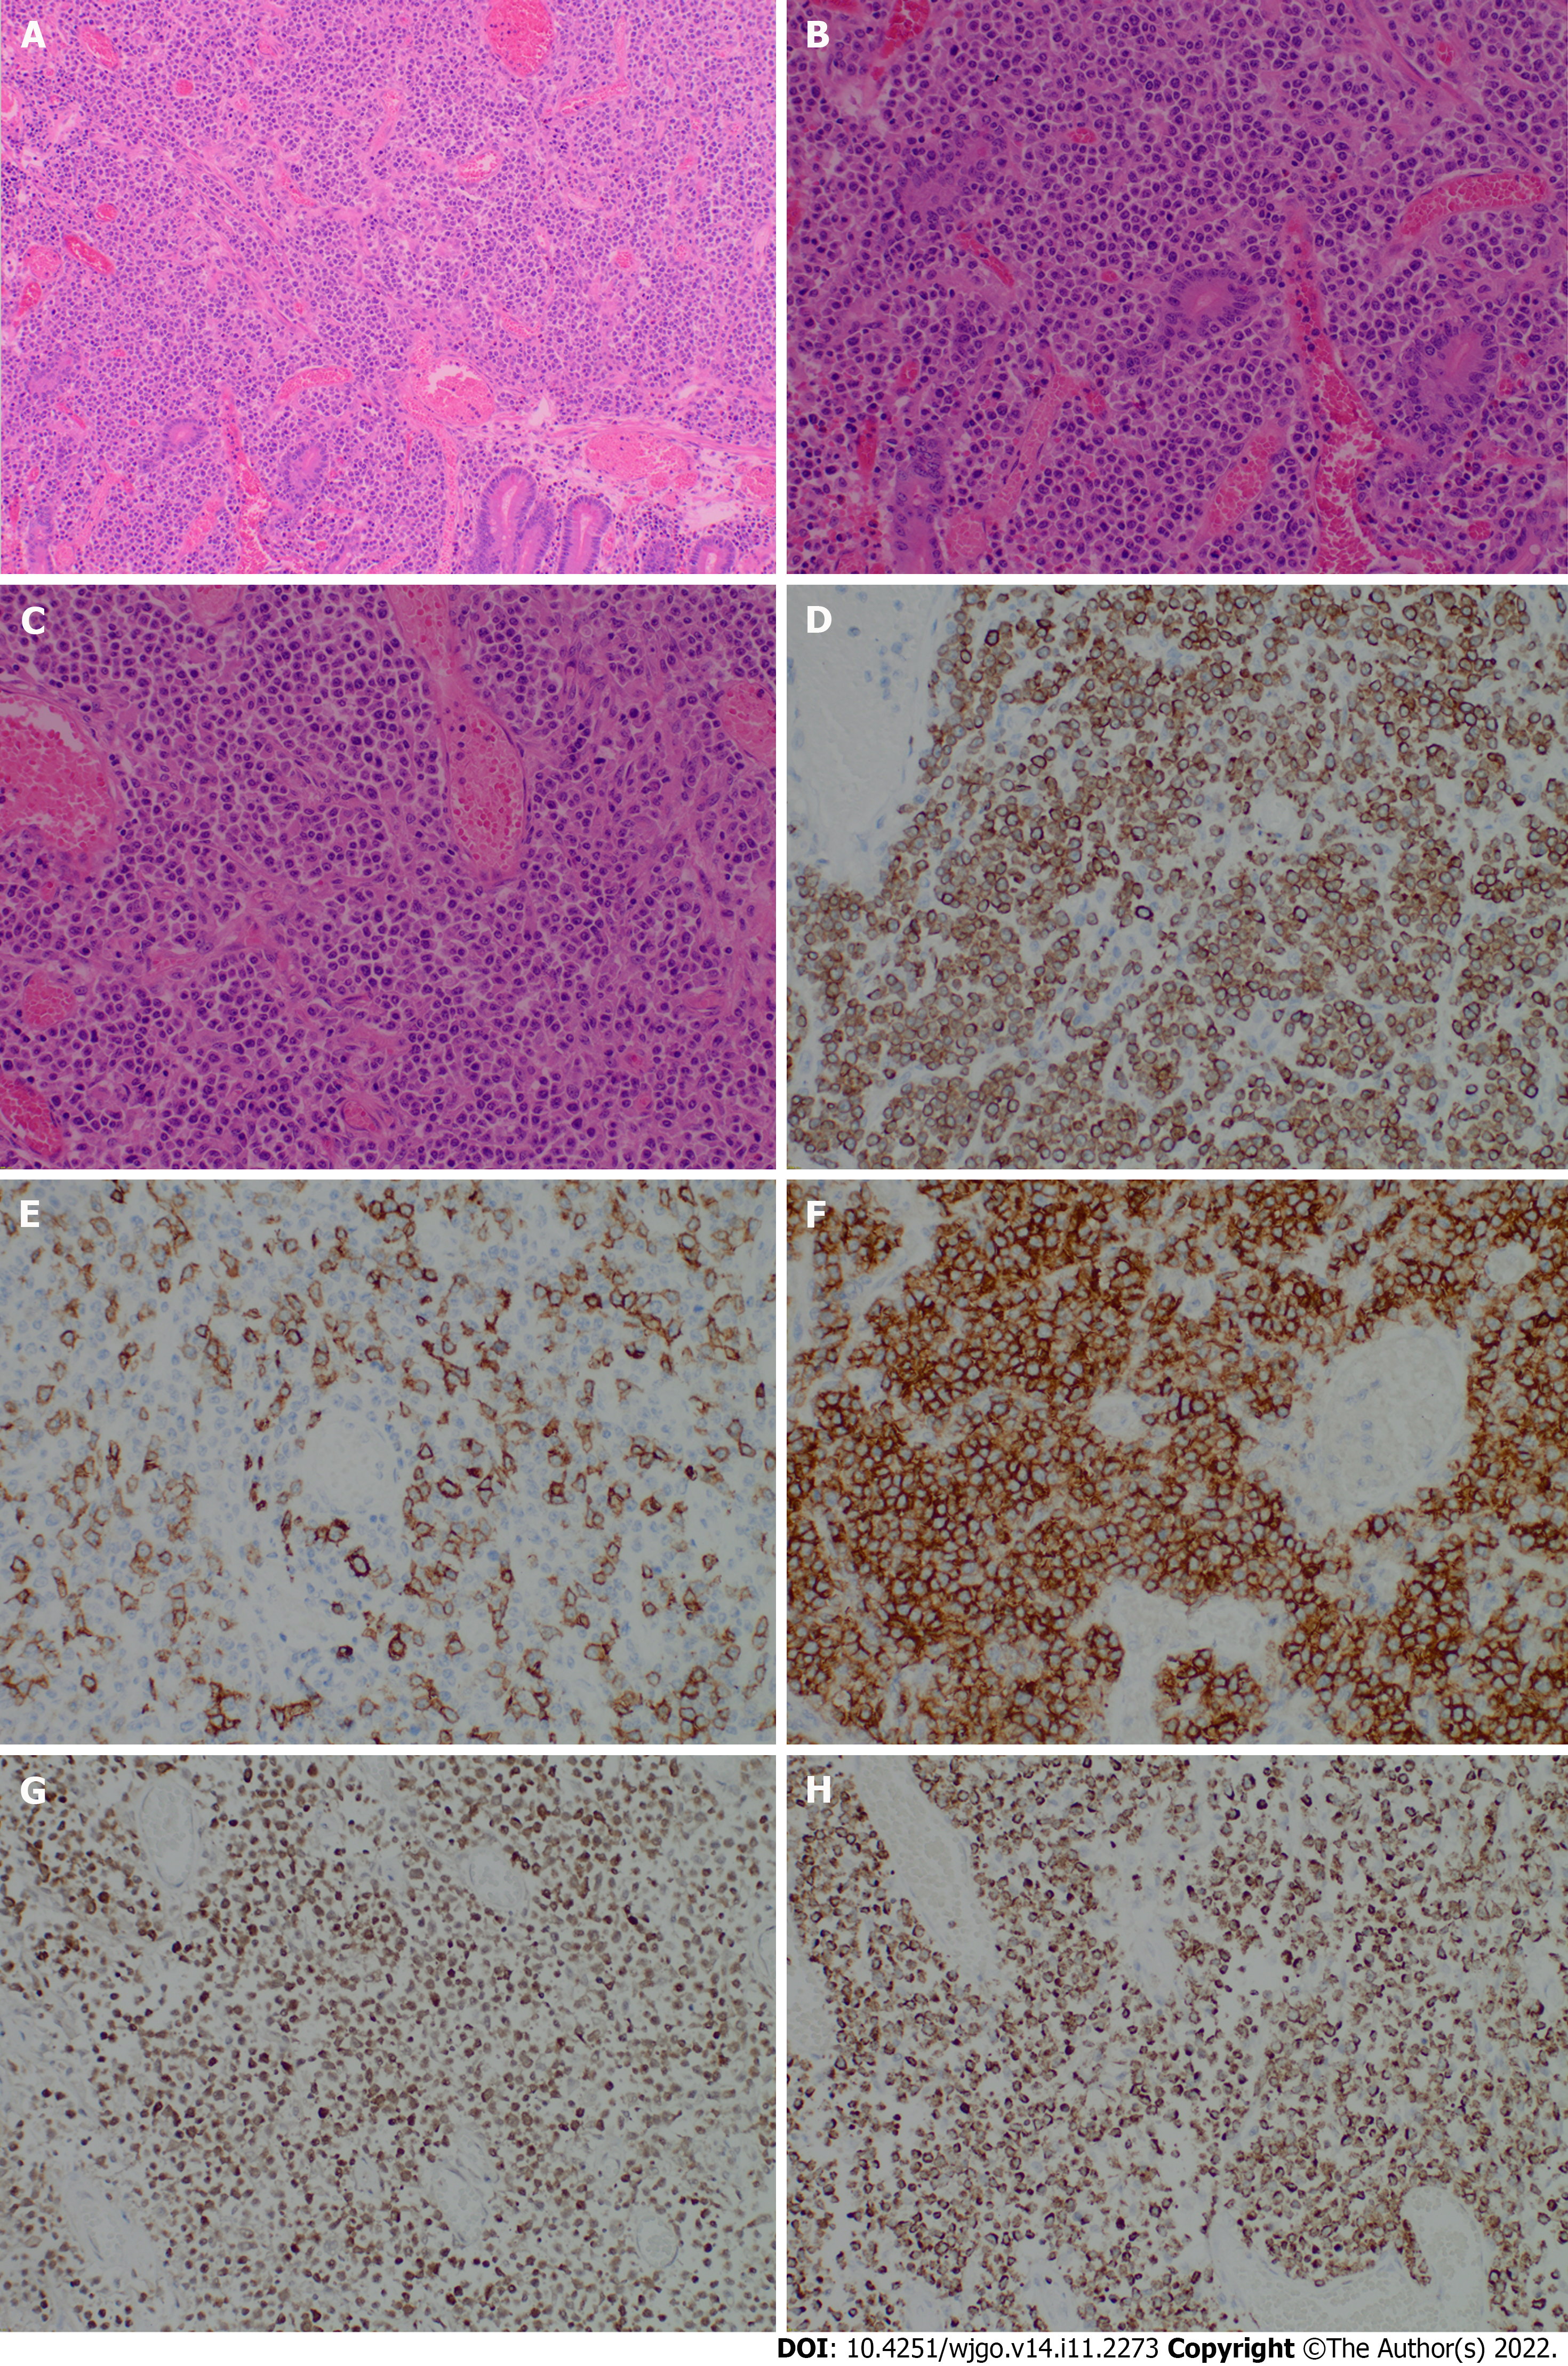
Figure 3 Pathologic and immunohistochemistry findings.
A and B: Low magnification (A) (× 40, H&E) and high magnification (B) (× 200, H&E) images of lymphocytes demonstrating an epitheliotropic pattern; C: The shape of lymphoma cells is uniform throughout, emphasizing the monomorphism; D-H: The tumor cells were positive for CD3 (D), CD8 (E), CD56 (F), Granzyme B (G), and TIA-1 (H). (C-H, magnification × 200).
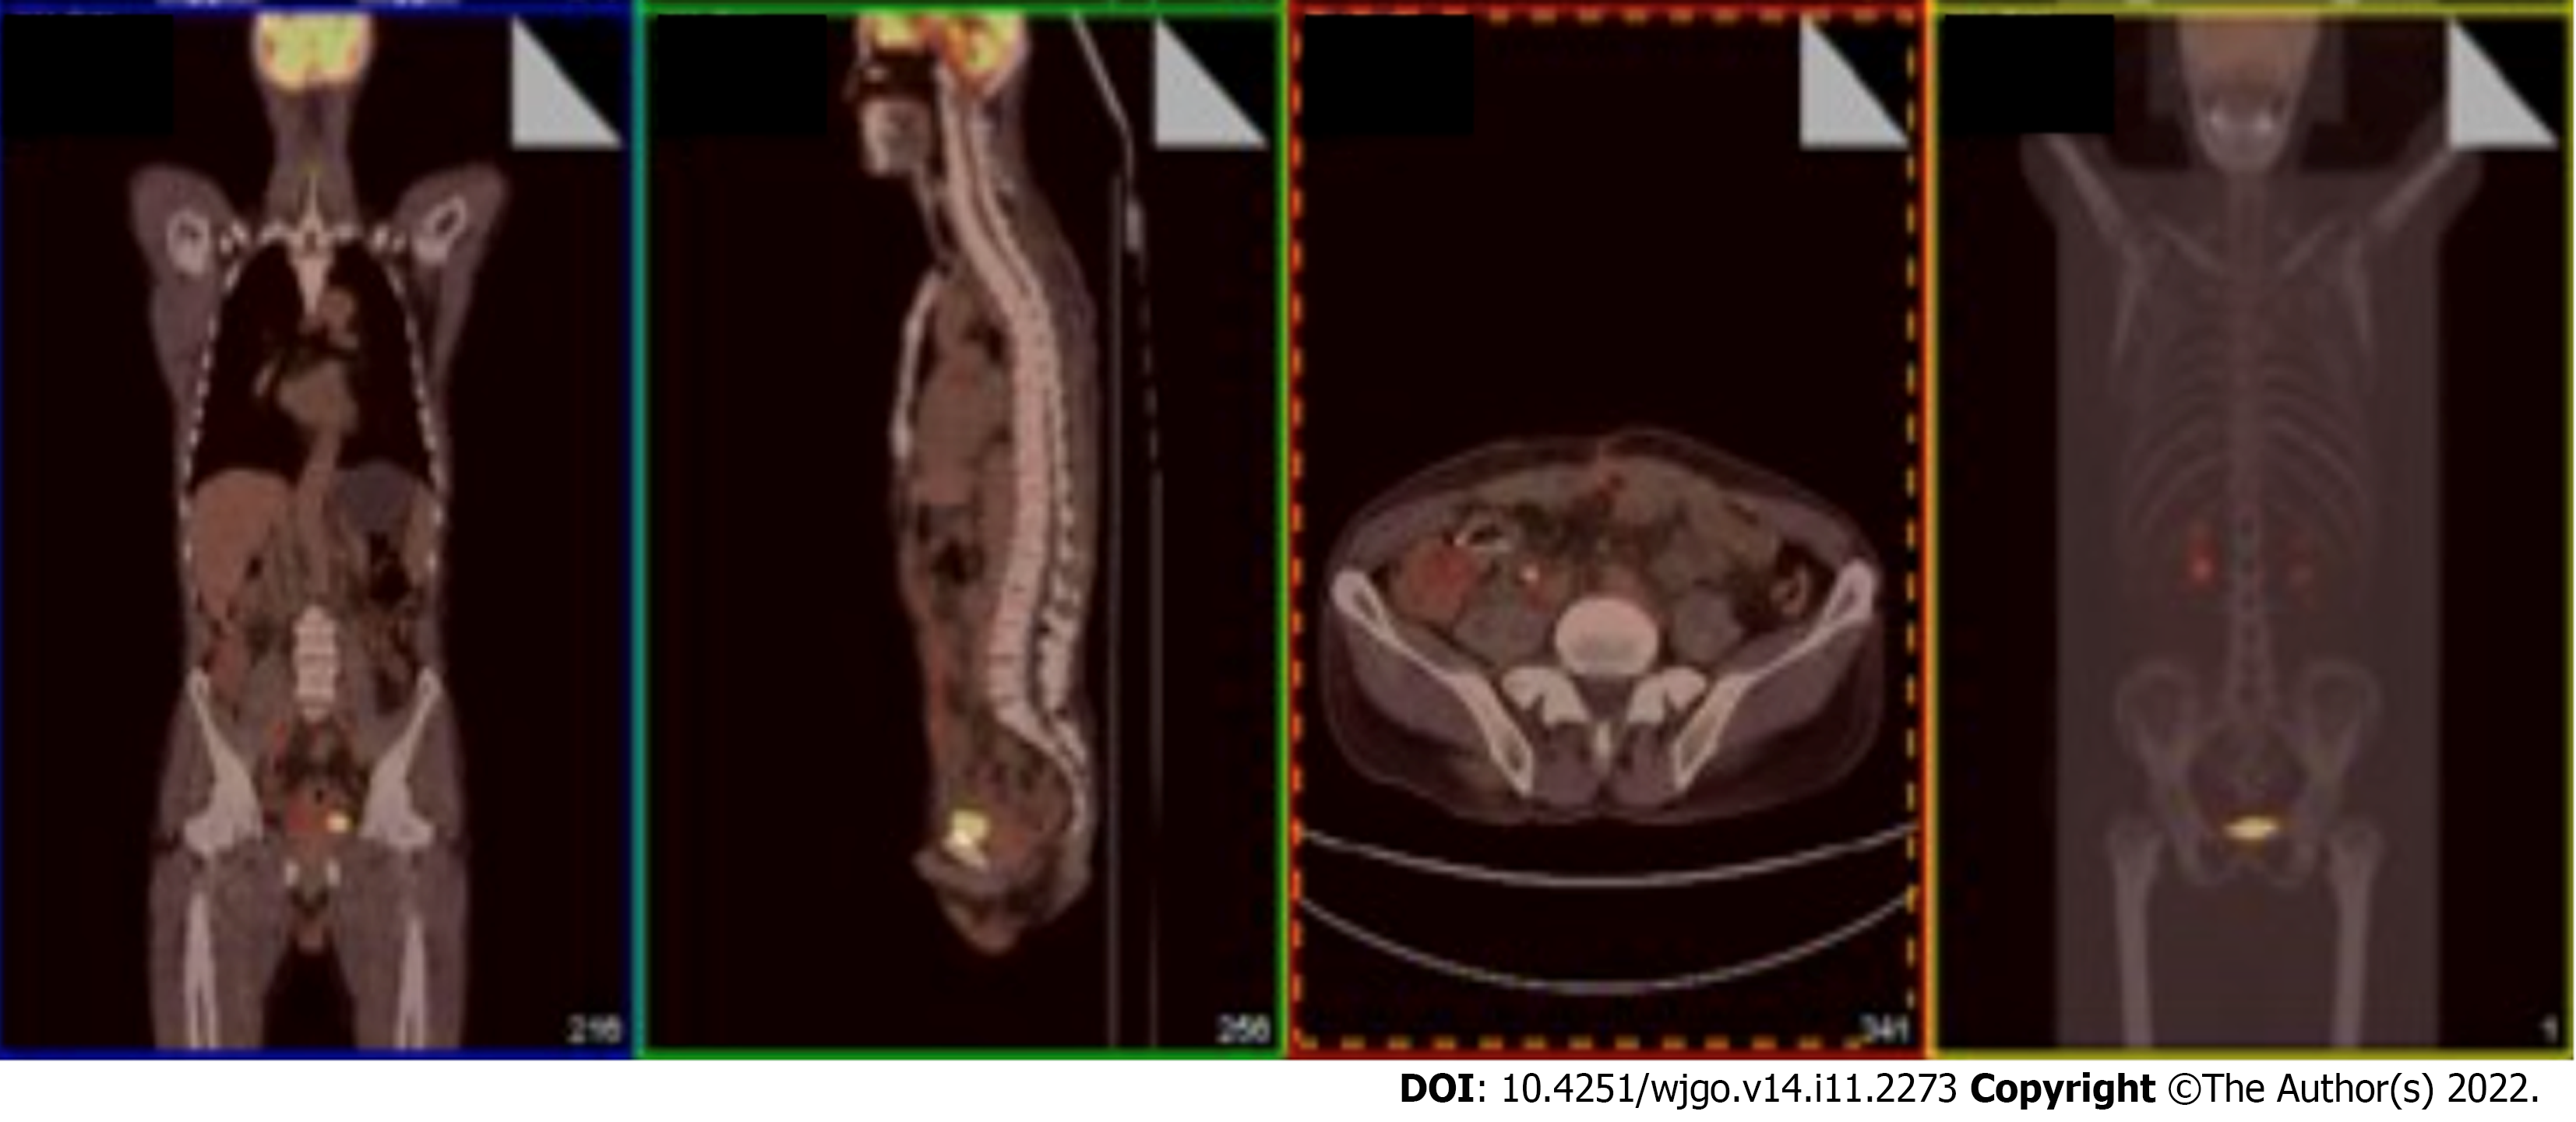
Figure 4
Postoperative positron emission tomography scan.
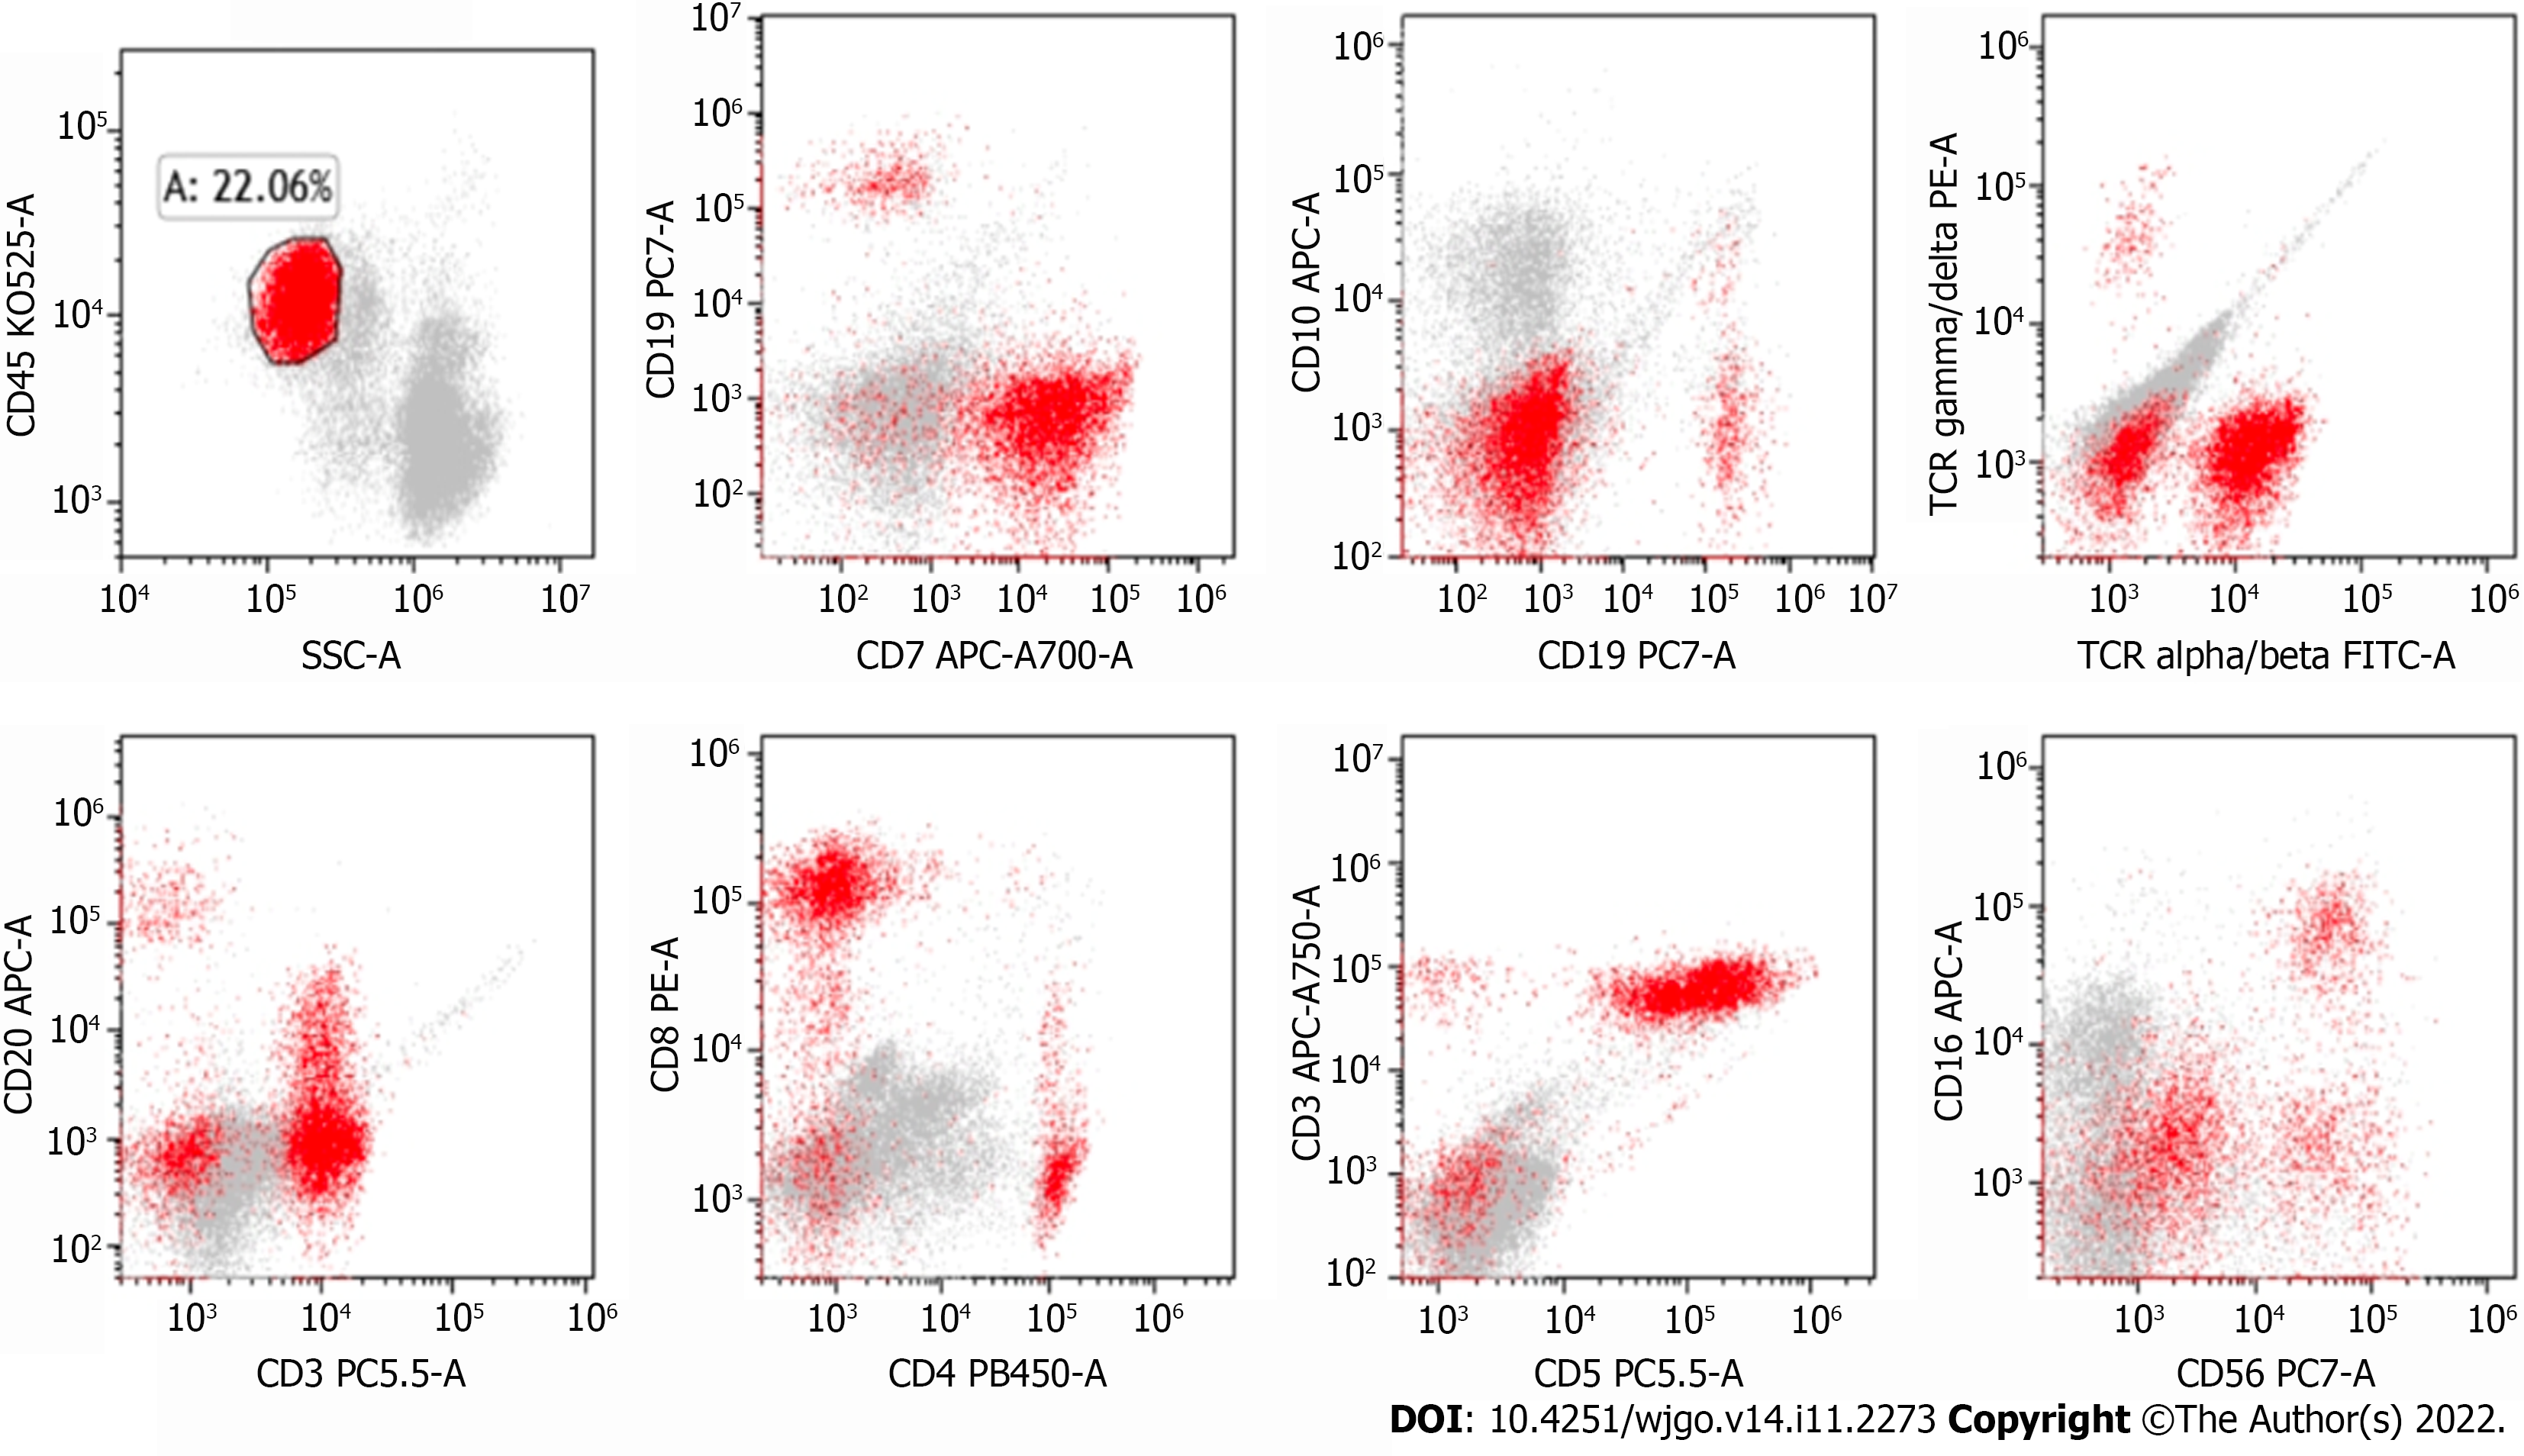
Figure 5 A (approximately 22.
06% of non-erythroid cells) mature lymphocyte population (mainly T cells, with a small amount of B and NK cells).
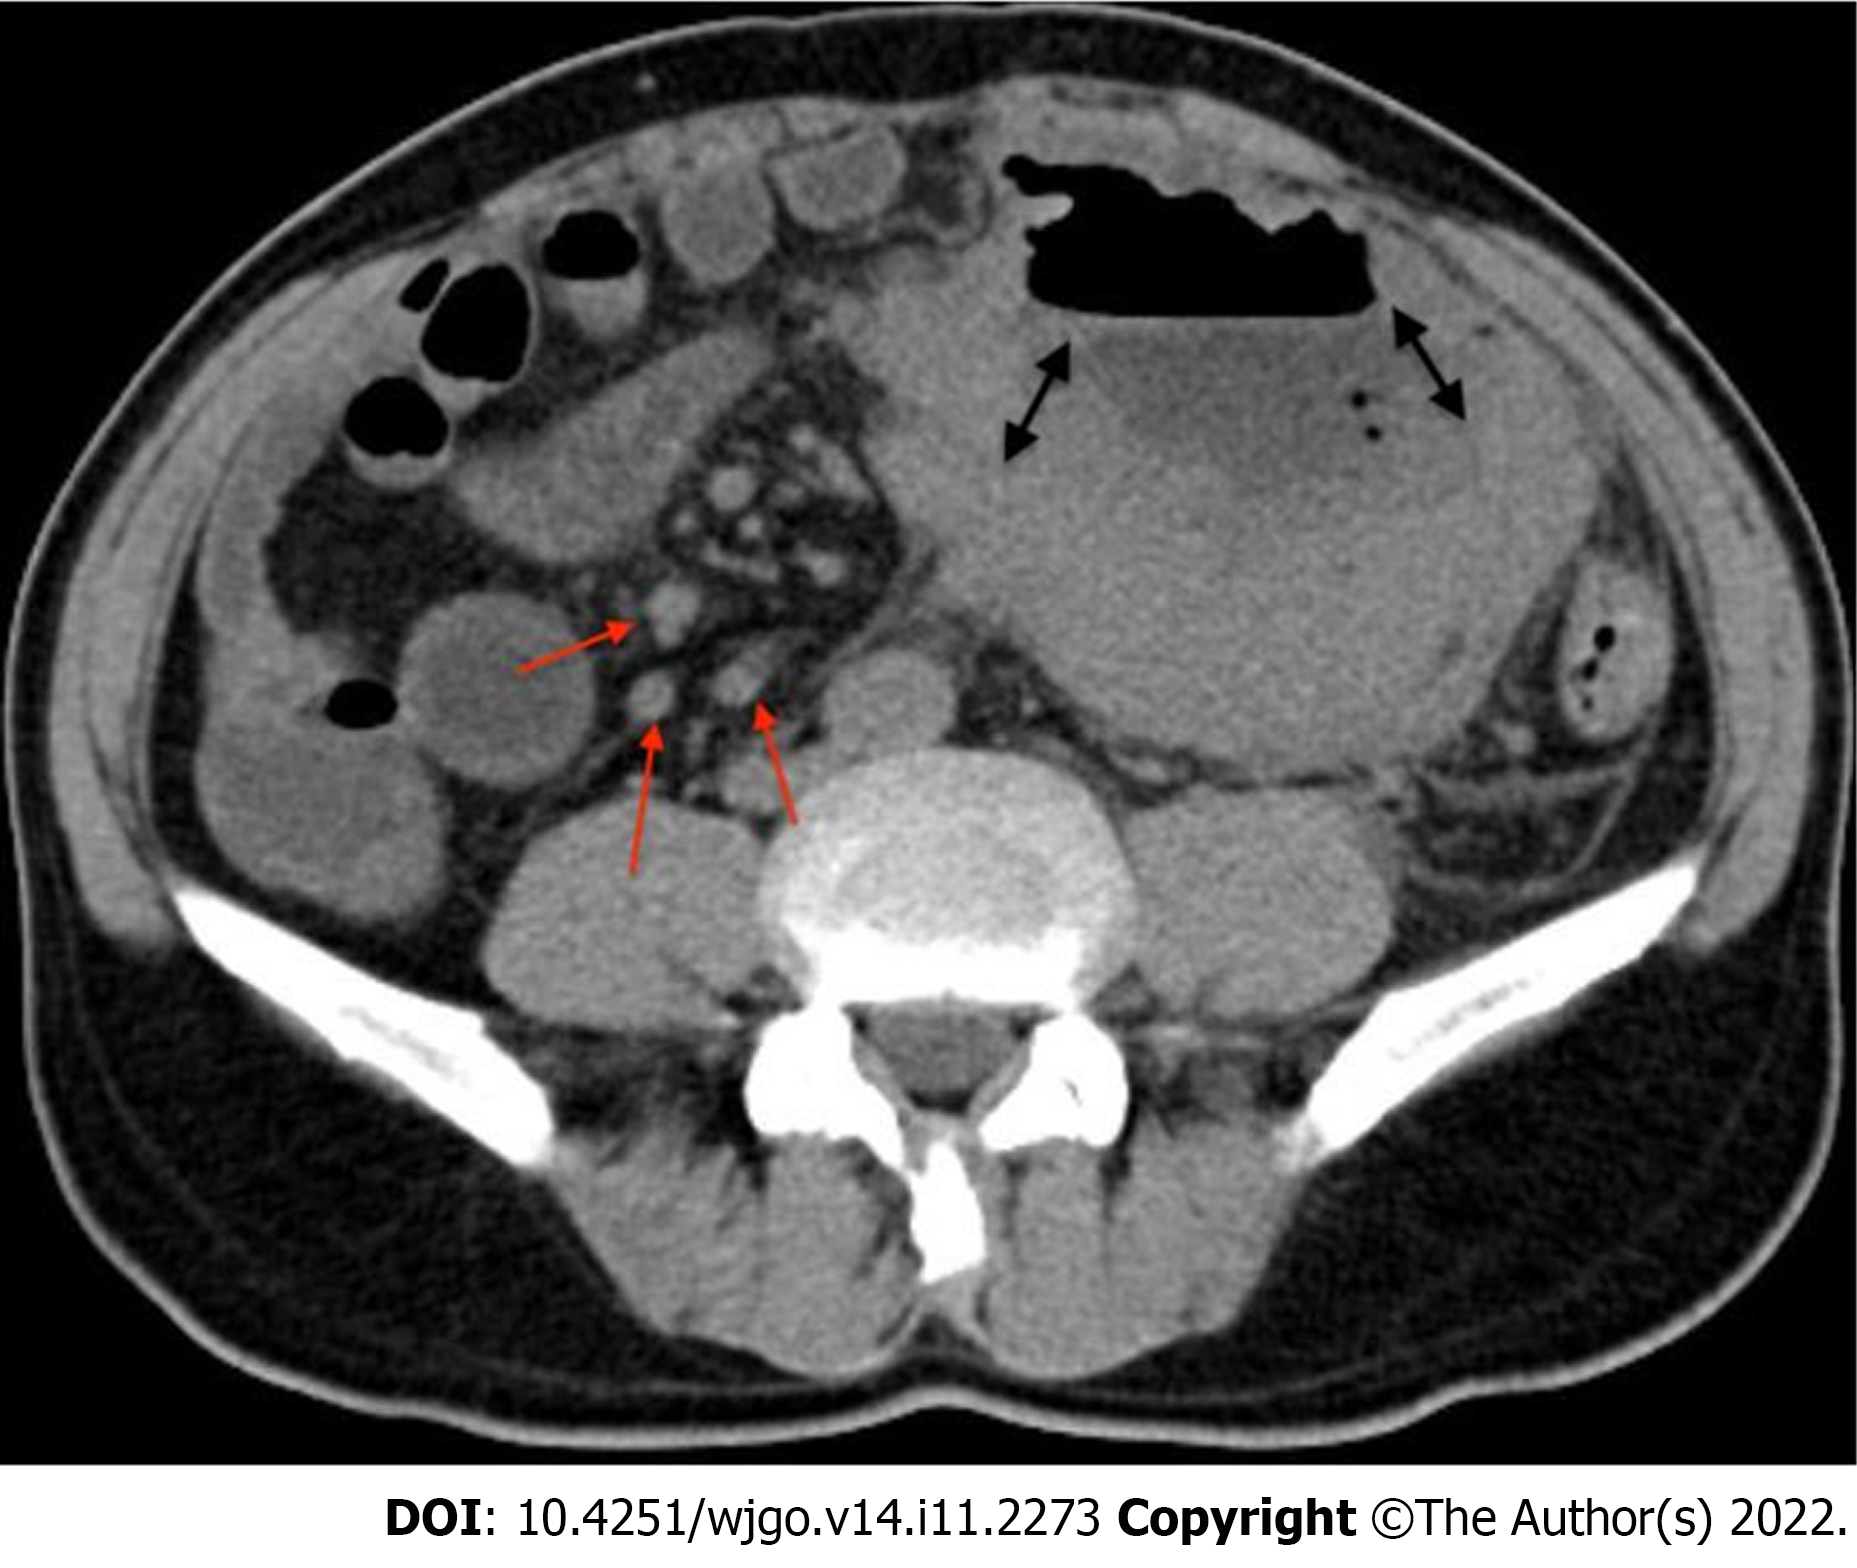
Figure 6 Computed tomography.
Red arrows indicate enlarged mesenteric lymph nodes; double headed-arrows indicate necrosis.
- Citation: Bissessur AS, Zhou JC, Xu L, Li ZQ, Ju SW, Jia YL, Wang LB. Surgical management of monomorphic epitheliotropic intestinal T-cell lymphoma followed by chemotherapy and stem-cell transplant: A case report and review of the literature. World J Gastrointest Oncol 2022; 14(11): 2273-2287
- URL: https://www.wjgnet.com/1948-5204/full/v14/i11/2273.htm
- DOI: https://dx.doi.org/10.4251/wjgo.v14.i11.2273


