Copyright
©The Author(s) 2022.
World J Gastrointest Oncol. Nov 15, 2022; 14(11): 2170-2182
Published online Nov 15, 2022. doi: 10.4251/wjgo.v14.i11.2170
Published online Nov 15, 2022. doi: 10.4251/wjgo.v14.i11.2170
Figure 1 MiR-30e-3p expression is downregulated in gastric cancer and low expression of miR-30e-3p predicts poor outcome of gastric cancer patients.
A: Quantitative real-time polymerase chain reaction (RT-PCR) was performed to analyze the expression of miR-30e-3p in normal human gastric epithelium cell line and four human gastric cancer (GC) cell lines (AGS, MGC803, BGC-823, and MKN45). n = 3 for each group; B: Quantitative RT-PCR was performed to analyze the expression of miR-30e-3p in GC and adjacent non-cancerous tissues. n = 20 for each group; C: Kaplan-Meier survival analysis of prognosis in GC patients with high or low expression of miR-30e-3p. n = 10 for each group. Error bars represented the mean ± SD of more than two independent experiments.
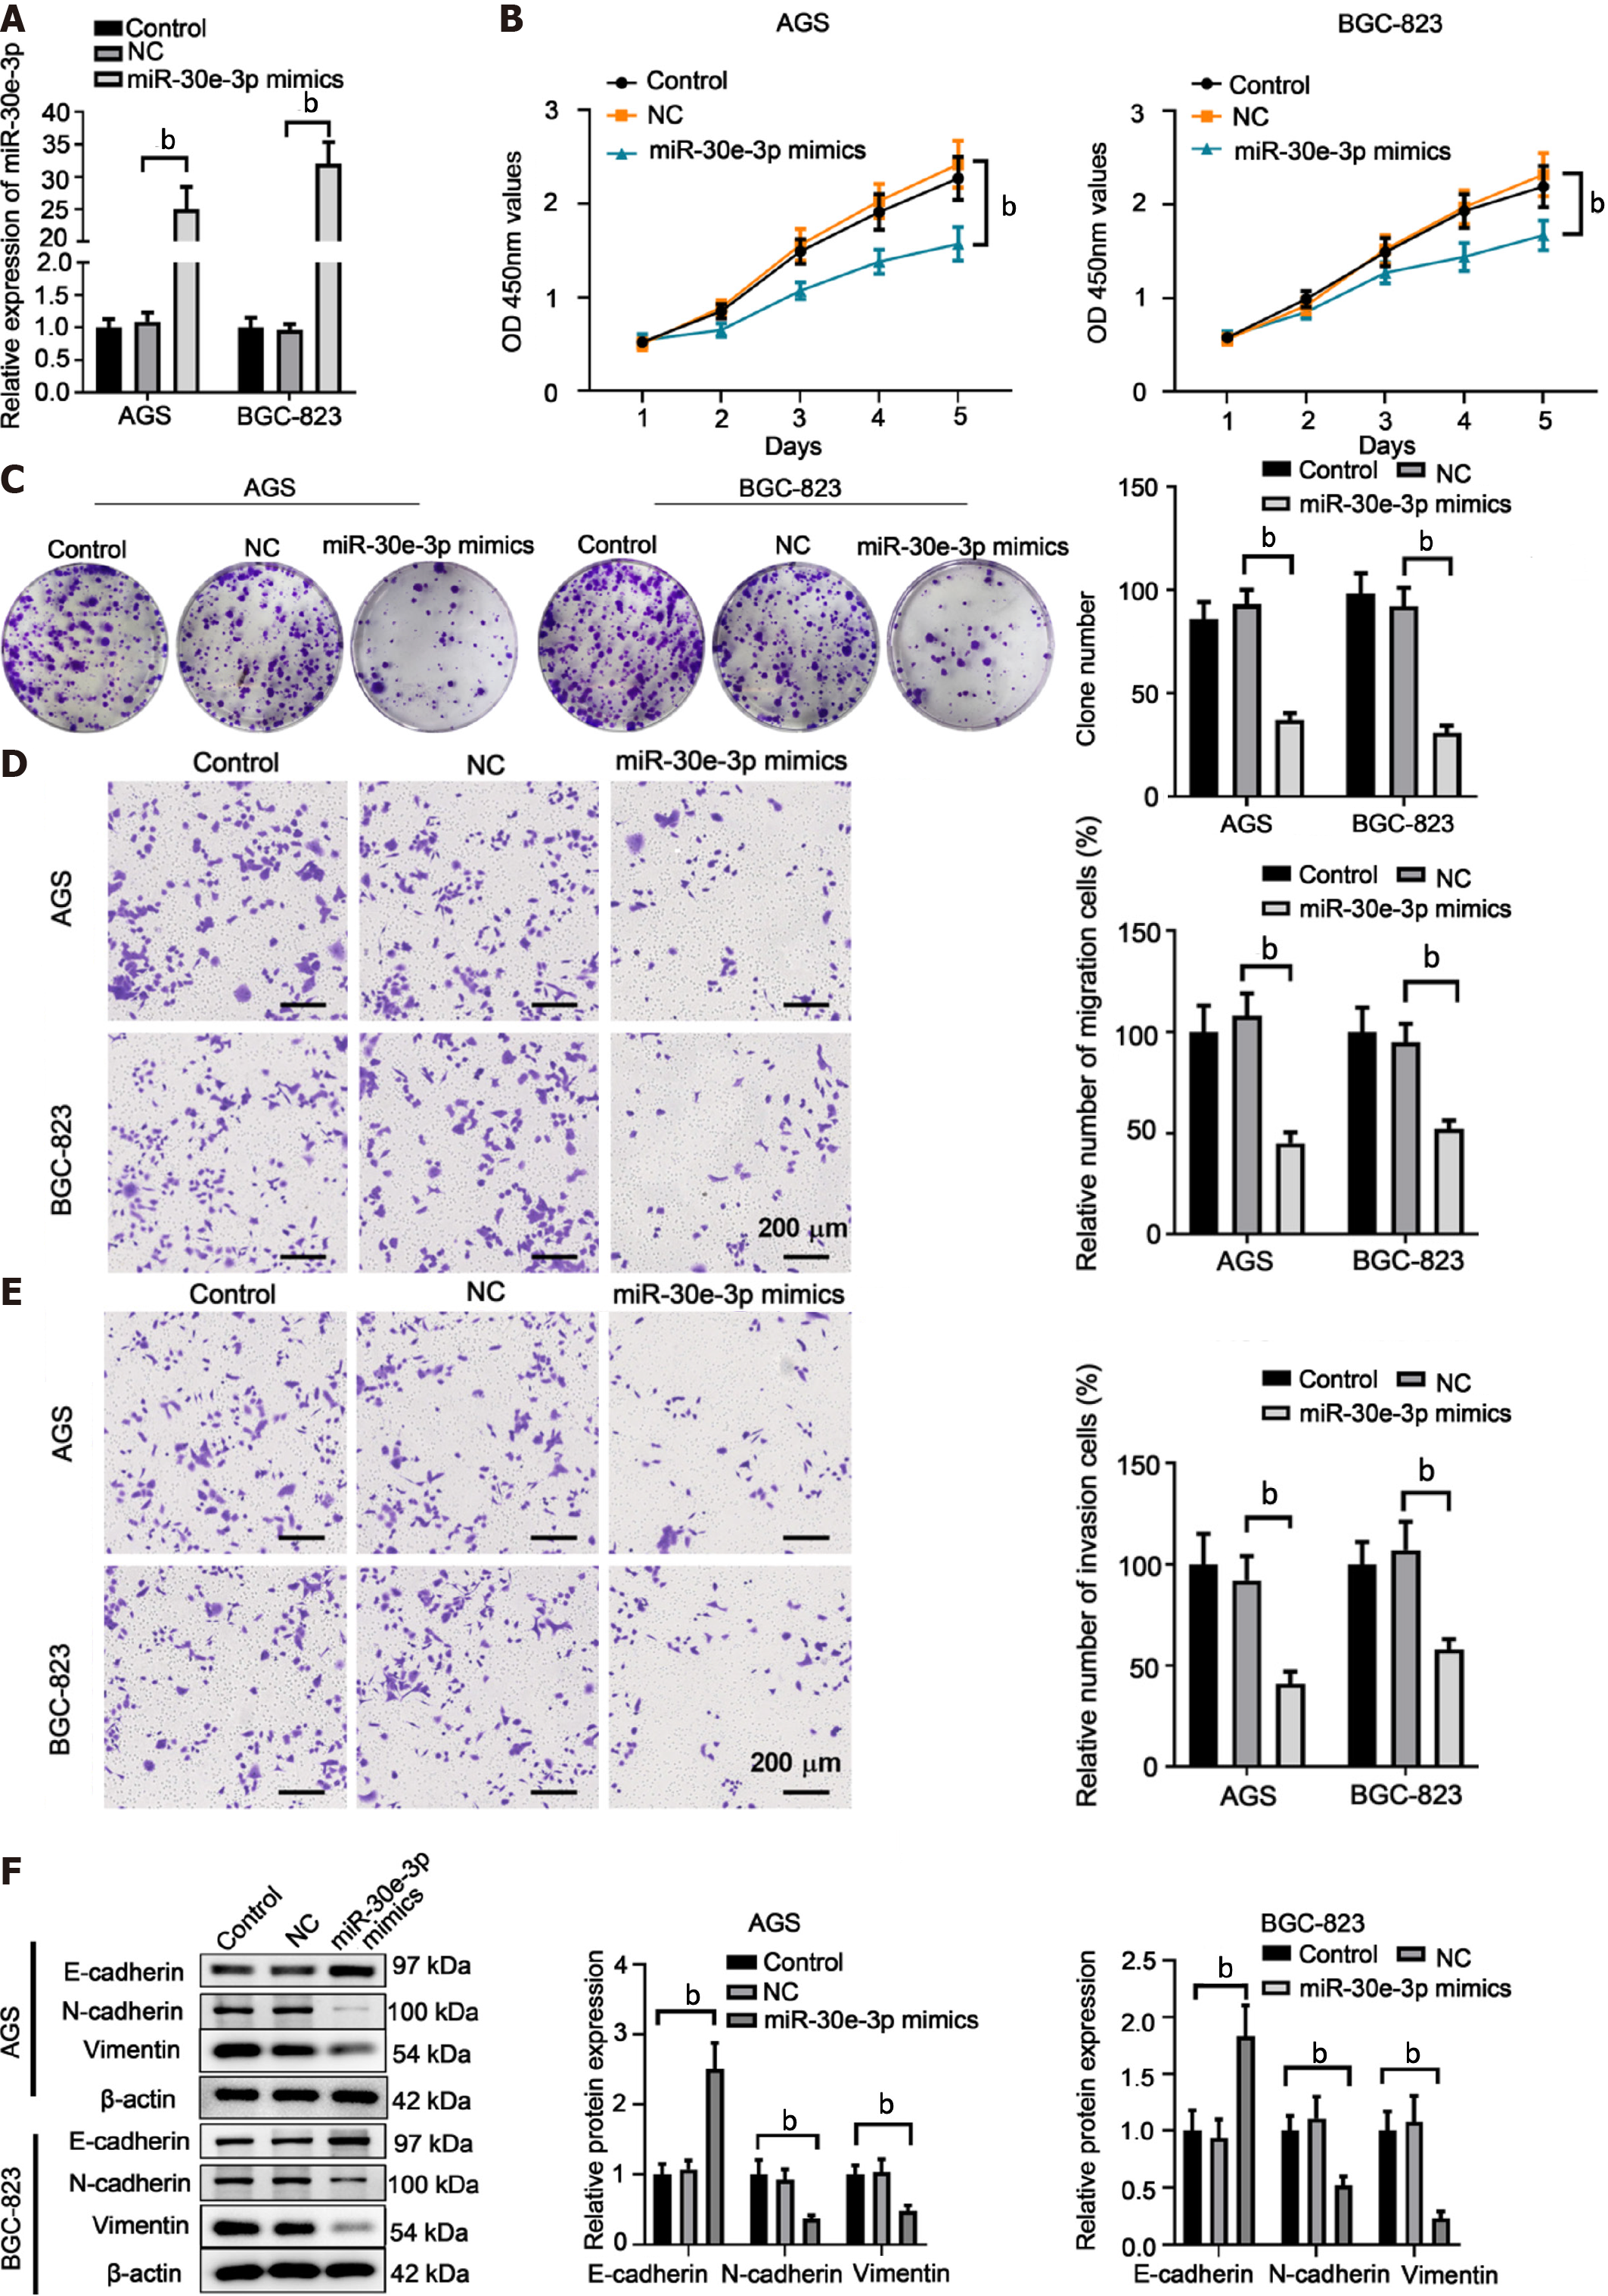
Figure 2 Overexpression of miR-30e-3p suppresses the malignant behaviors of gastric cancer cells.
AGS or BGC-823 cells were transfected with negative control, miR-30e-3p mimics, or left untreated (control). A: Quantitative real-time polymerase chain reaction was performed to analyze miR-30e-3p expression levels in AGS or BGC-823 cells 48 h post transfection; B: CCK-8 assay was conducted to evaluate cell viability; C: Colony formation assay was conducted to evaluate the cell proliferation; D and E: Transwell assay was conducted using transwell chamber with or without matrigel to evaluate the cell migration (D) and invasion (E); F: Expression of E-cadherin, N-cadherin, and vimentin in AGS or BGC-823 was determined using western blotting. n = 3 for each group. bP < 0.01.
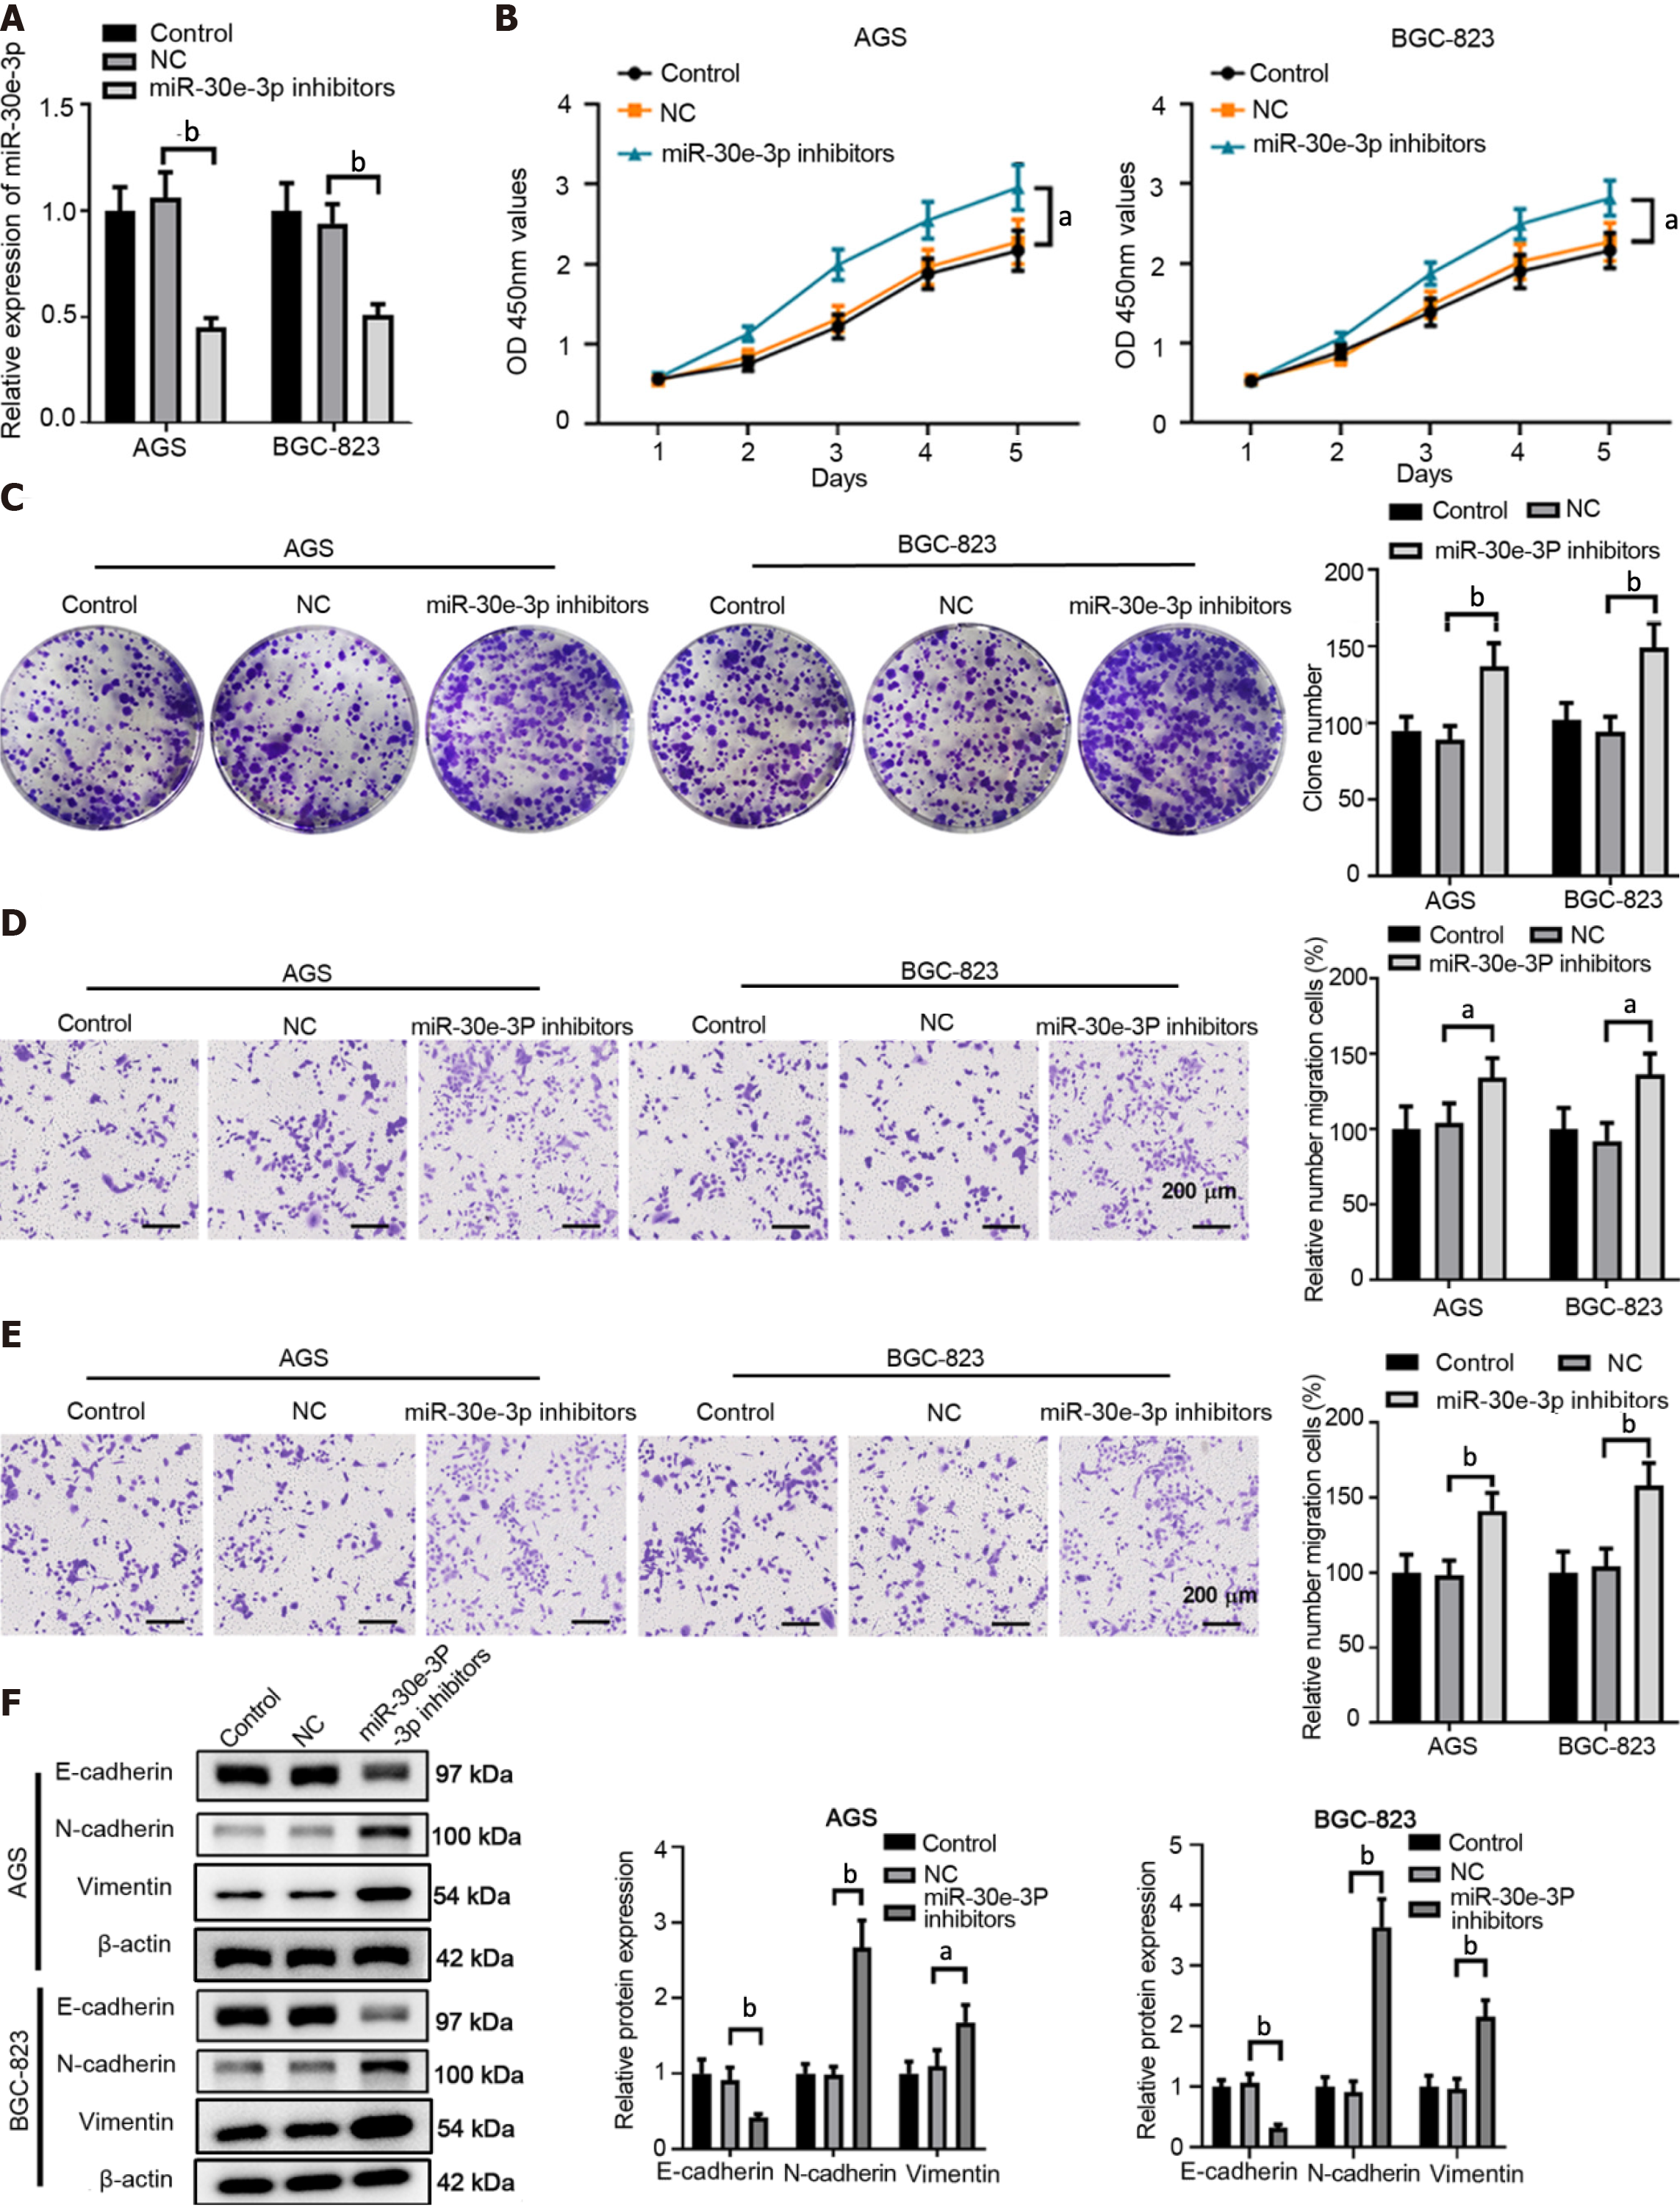
Figure 3 Inhibition of miR-30e-3p promotes the malignant behaviors of gastric cancer cells.
AGS or BGC-823 cells were transfected with negative control, miR-30e-3p inhibitors, or left untreated (control). A: Quantitative real-time polymerase chain reaction was performed to analyze miR-30e-3p expression levels in AGS or BGC-823 cells 48 hours post transfection; B: CCK-8 assay was conducted to evaluate cell viability; C: Colony formation assay was conducted to evaluate the cell proliferation; D and E: Transwell assay was conducted using transwell chamber with or without matrigel to evaluate the cell migration (D) and invasion (E); F: Expression of E-cadherin, N-cadherin, and vimentin in AGS or BGC-823 was determined using western blotting. n = 3 for each group. aP < 0.05, bP < 0.01.
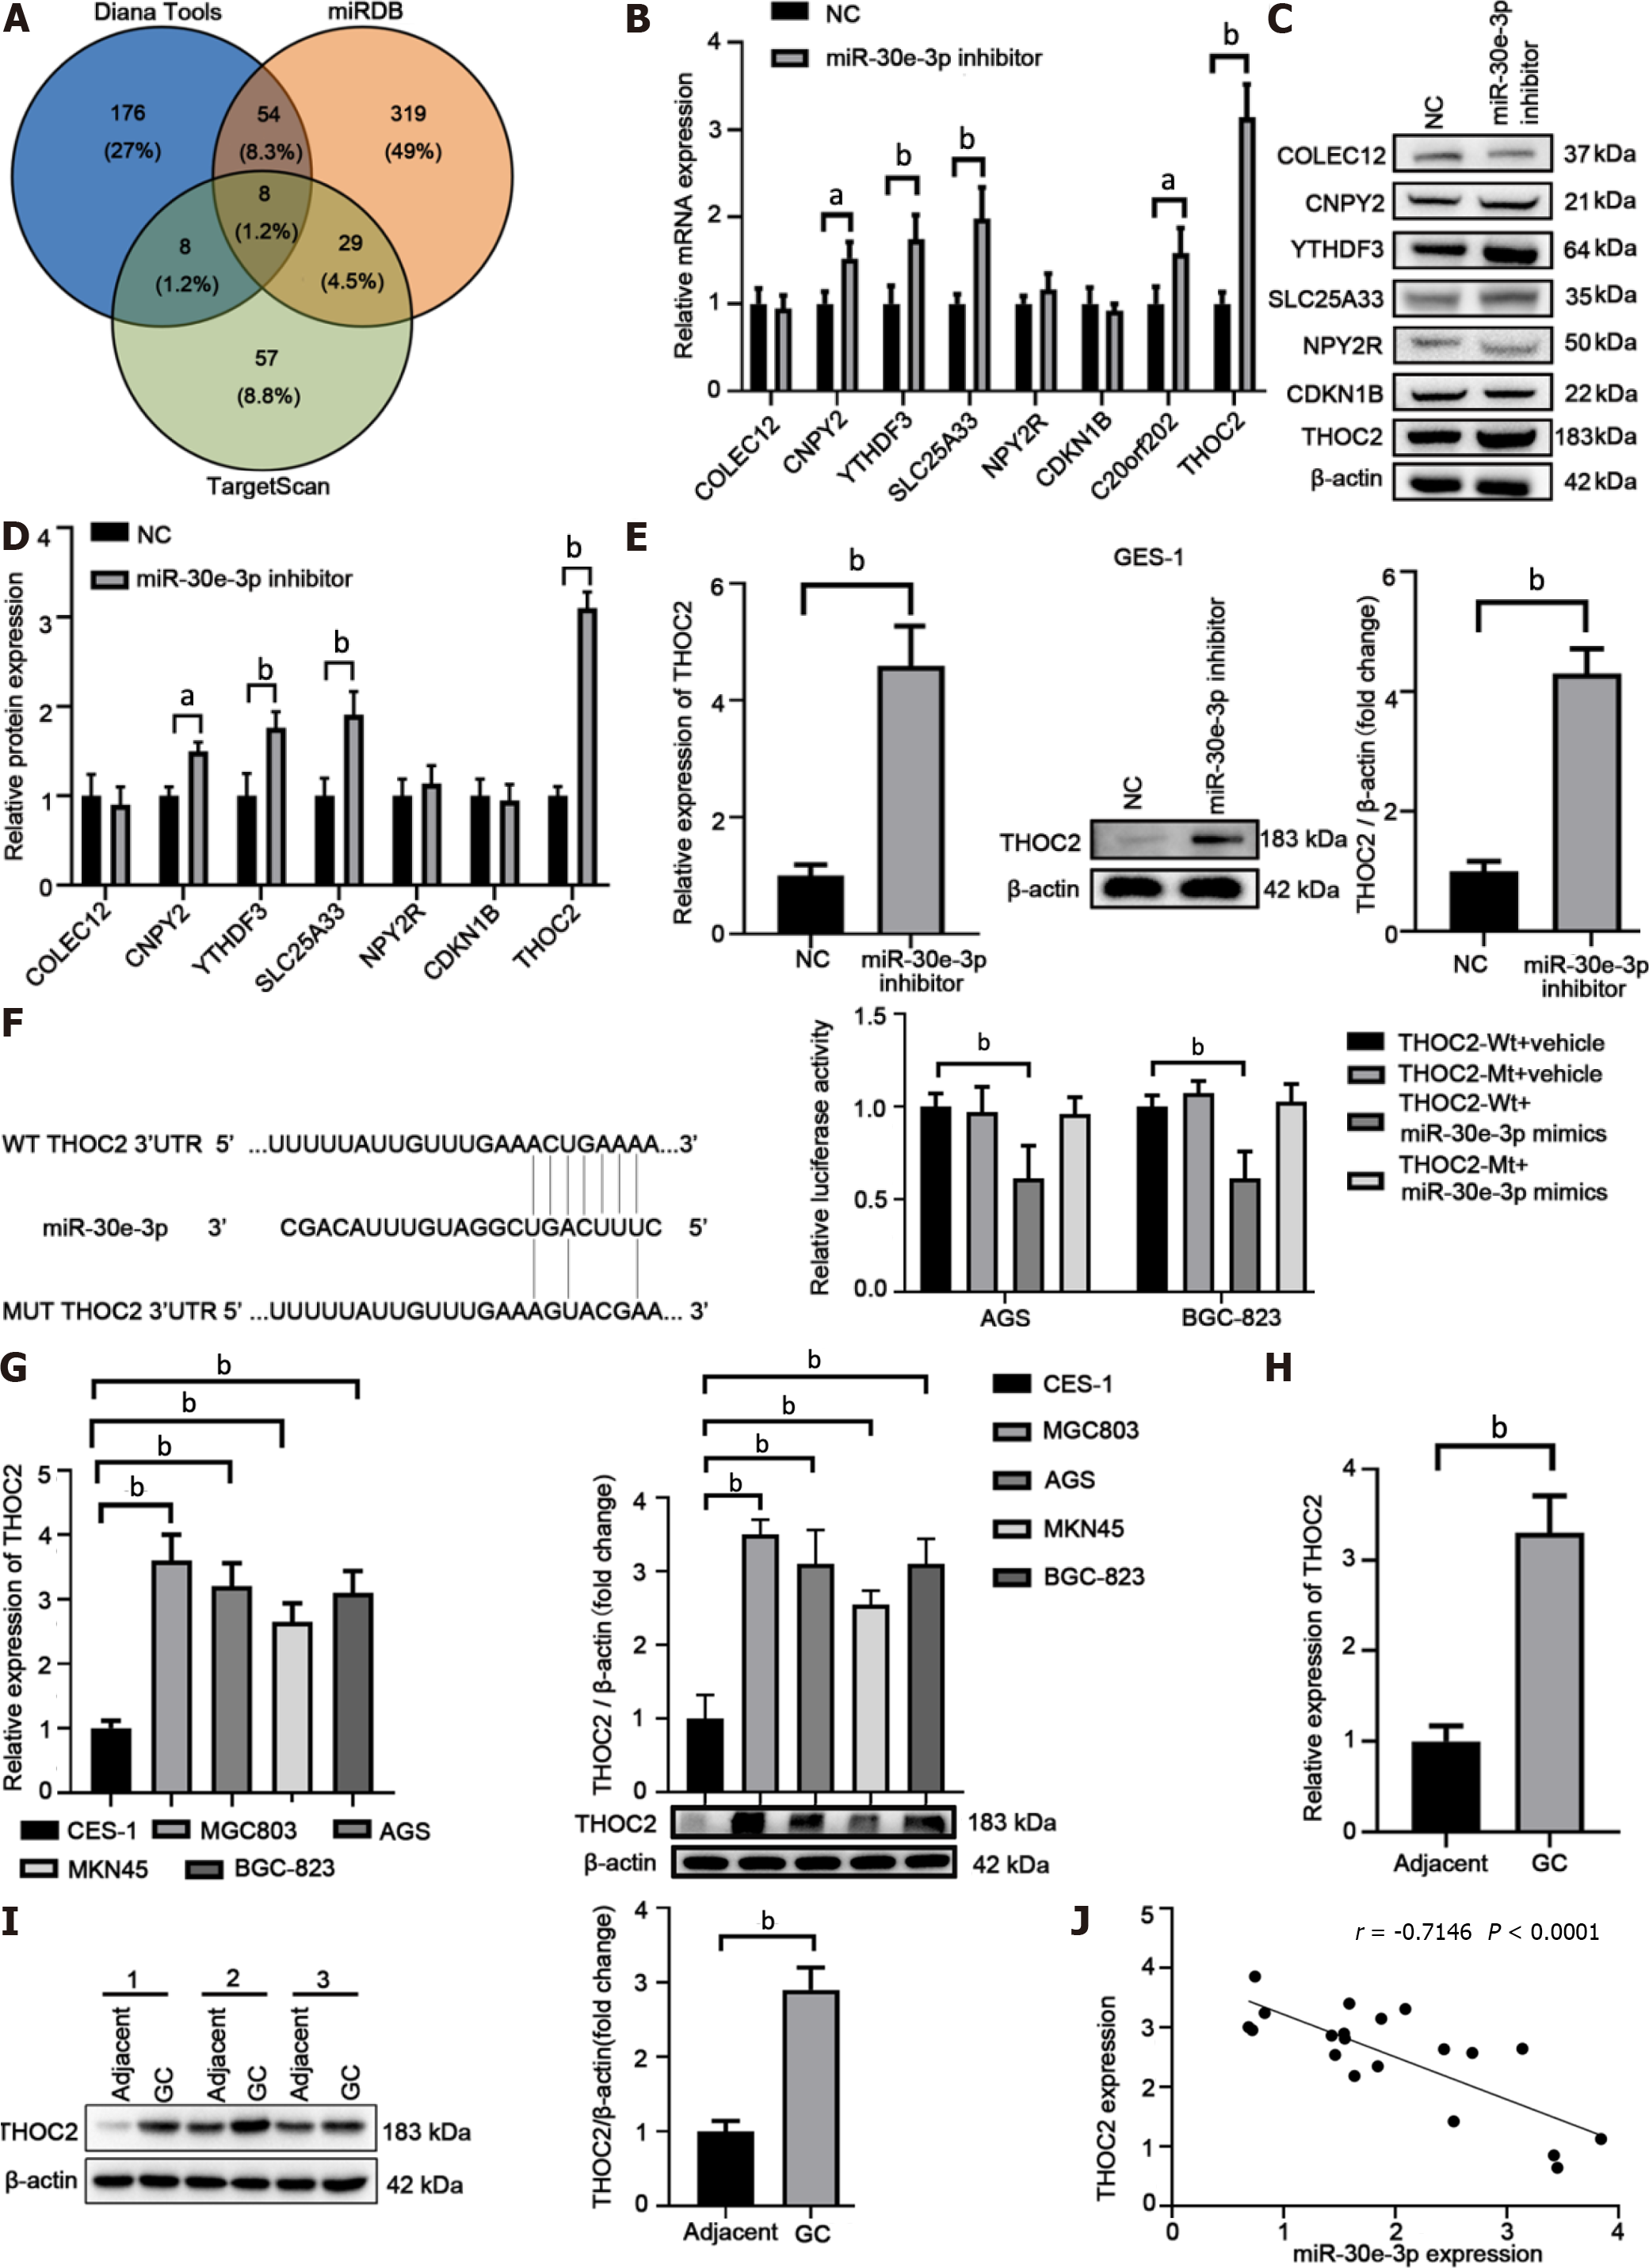
Figure 4 THO complex 2 is a direct target of miR-30e-3p in gastric cancer cells.
A: Bioinformatics analysis predicted the potential targets of miR-30e-3p in gastric cancer (GC) cells; B: The mRNA expression level of candidate genes in GC after transfecting with miR-30e-3p inhibitor; C and D: The protein expression level of candidate genes in GC after transfecting with miR-30e-3p inhibitor; E: The expression of THO complex 2 (THOC2) in GSE-1 cells after transfecting with miR-30e-3p; F: The putative binding sequences between miR-30e-3p and 3’-UTR of THOC2 was shown. AGS or BGC-823 cells were co-transfected with luciferase reporter vector, with or without miR-30e-3p mimics. The relative luciferase activity in AGS or BGC-823 cells was analyzed 48 hours later. n = 3 for each group. G: The expression of THOC2 in human GC cell lines and control GES-1 cells were analyzed by quantitative real-time polymerase chain reaction (qRT-PCR) and western blot. n = 3 for each group; H: The expression of THOC2 in GC tissues and adjacent non-tumor normal tissues were analyzed by qRT-PCR. n = 20 for each group; I: Western blot was performed to examine THOC2 protein expression in human GC tissues and adjacent non-tumor normal tissues. n = 20 for each group. J: Pearson correlation analysis was performed to evaluate the relationship between THOC2 mRNA and miR-30e-3p expression in GC tissues. n = 20. bP < 0.01.
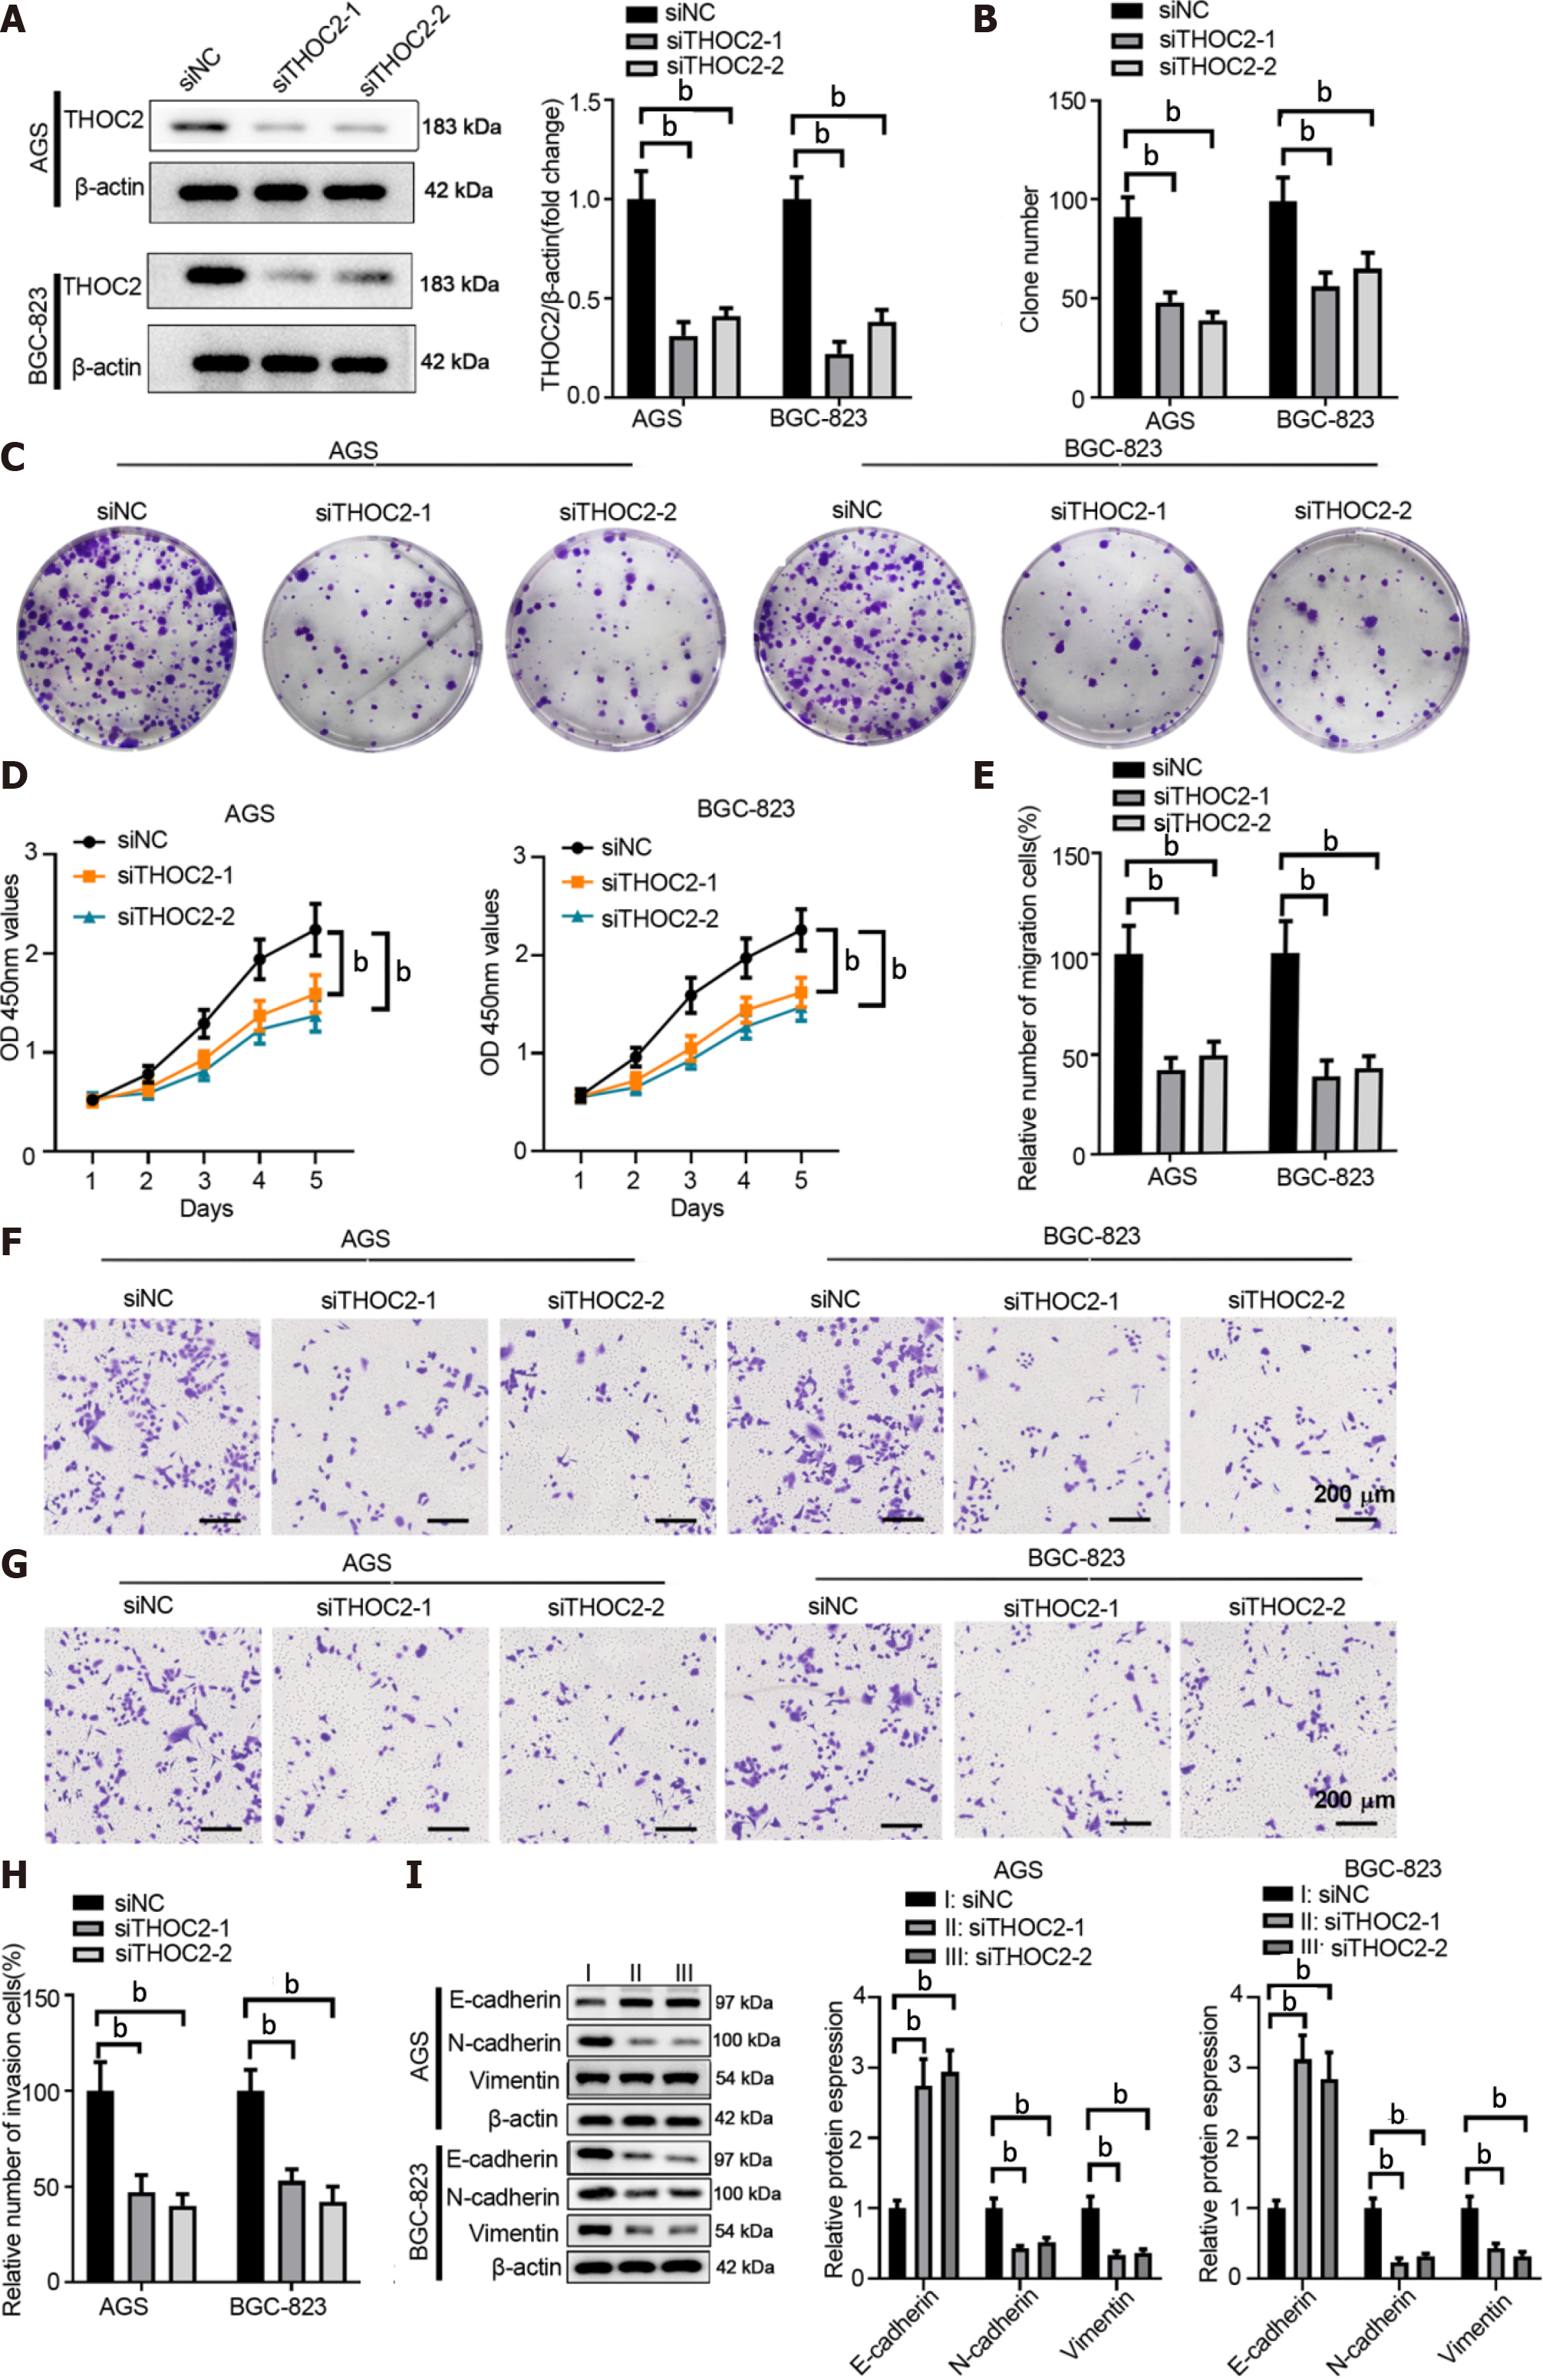
Figure 5 Knockdown of THO complex 2 suppresses malignant behaviors of gastric cancer cells.
AGS or BGC-823 cells were transfected with siNC or siTHO complex 2 (siTHOC2)-1/2 to knockdown the expression of THOC2. A: The protein expression of THOC2 was analyzed by western blotting 48 hours later; B and C: Colony formation assay was conducted to evaluate the cell proliferation; D: CCK-8 assay was conducted to evaluate cell viability; E-H: Transwell assay was conducted using transwell chamber with or without Matrigel to evaluate the cell migration (E and F) and invasion (G and H); I: Expression of E-cadherin, N-cadherin, and vimentin in AGS or BGC-823 was determined using western blotting. n = 3 for each group. bP < 0.01.
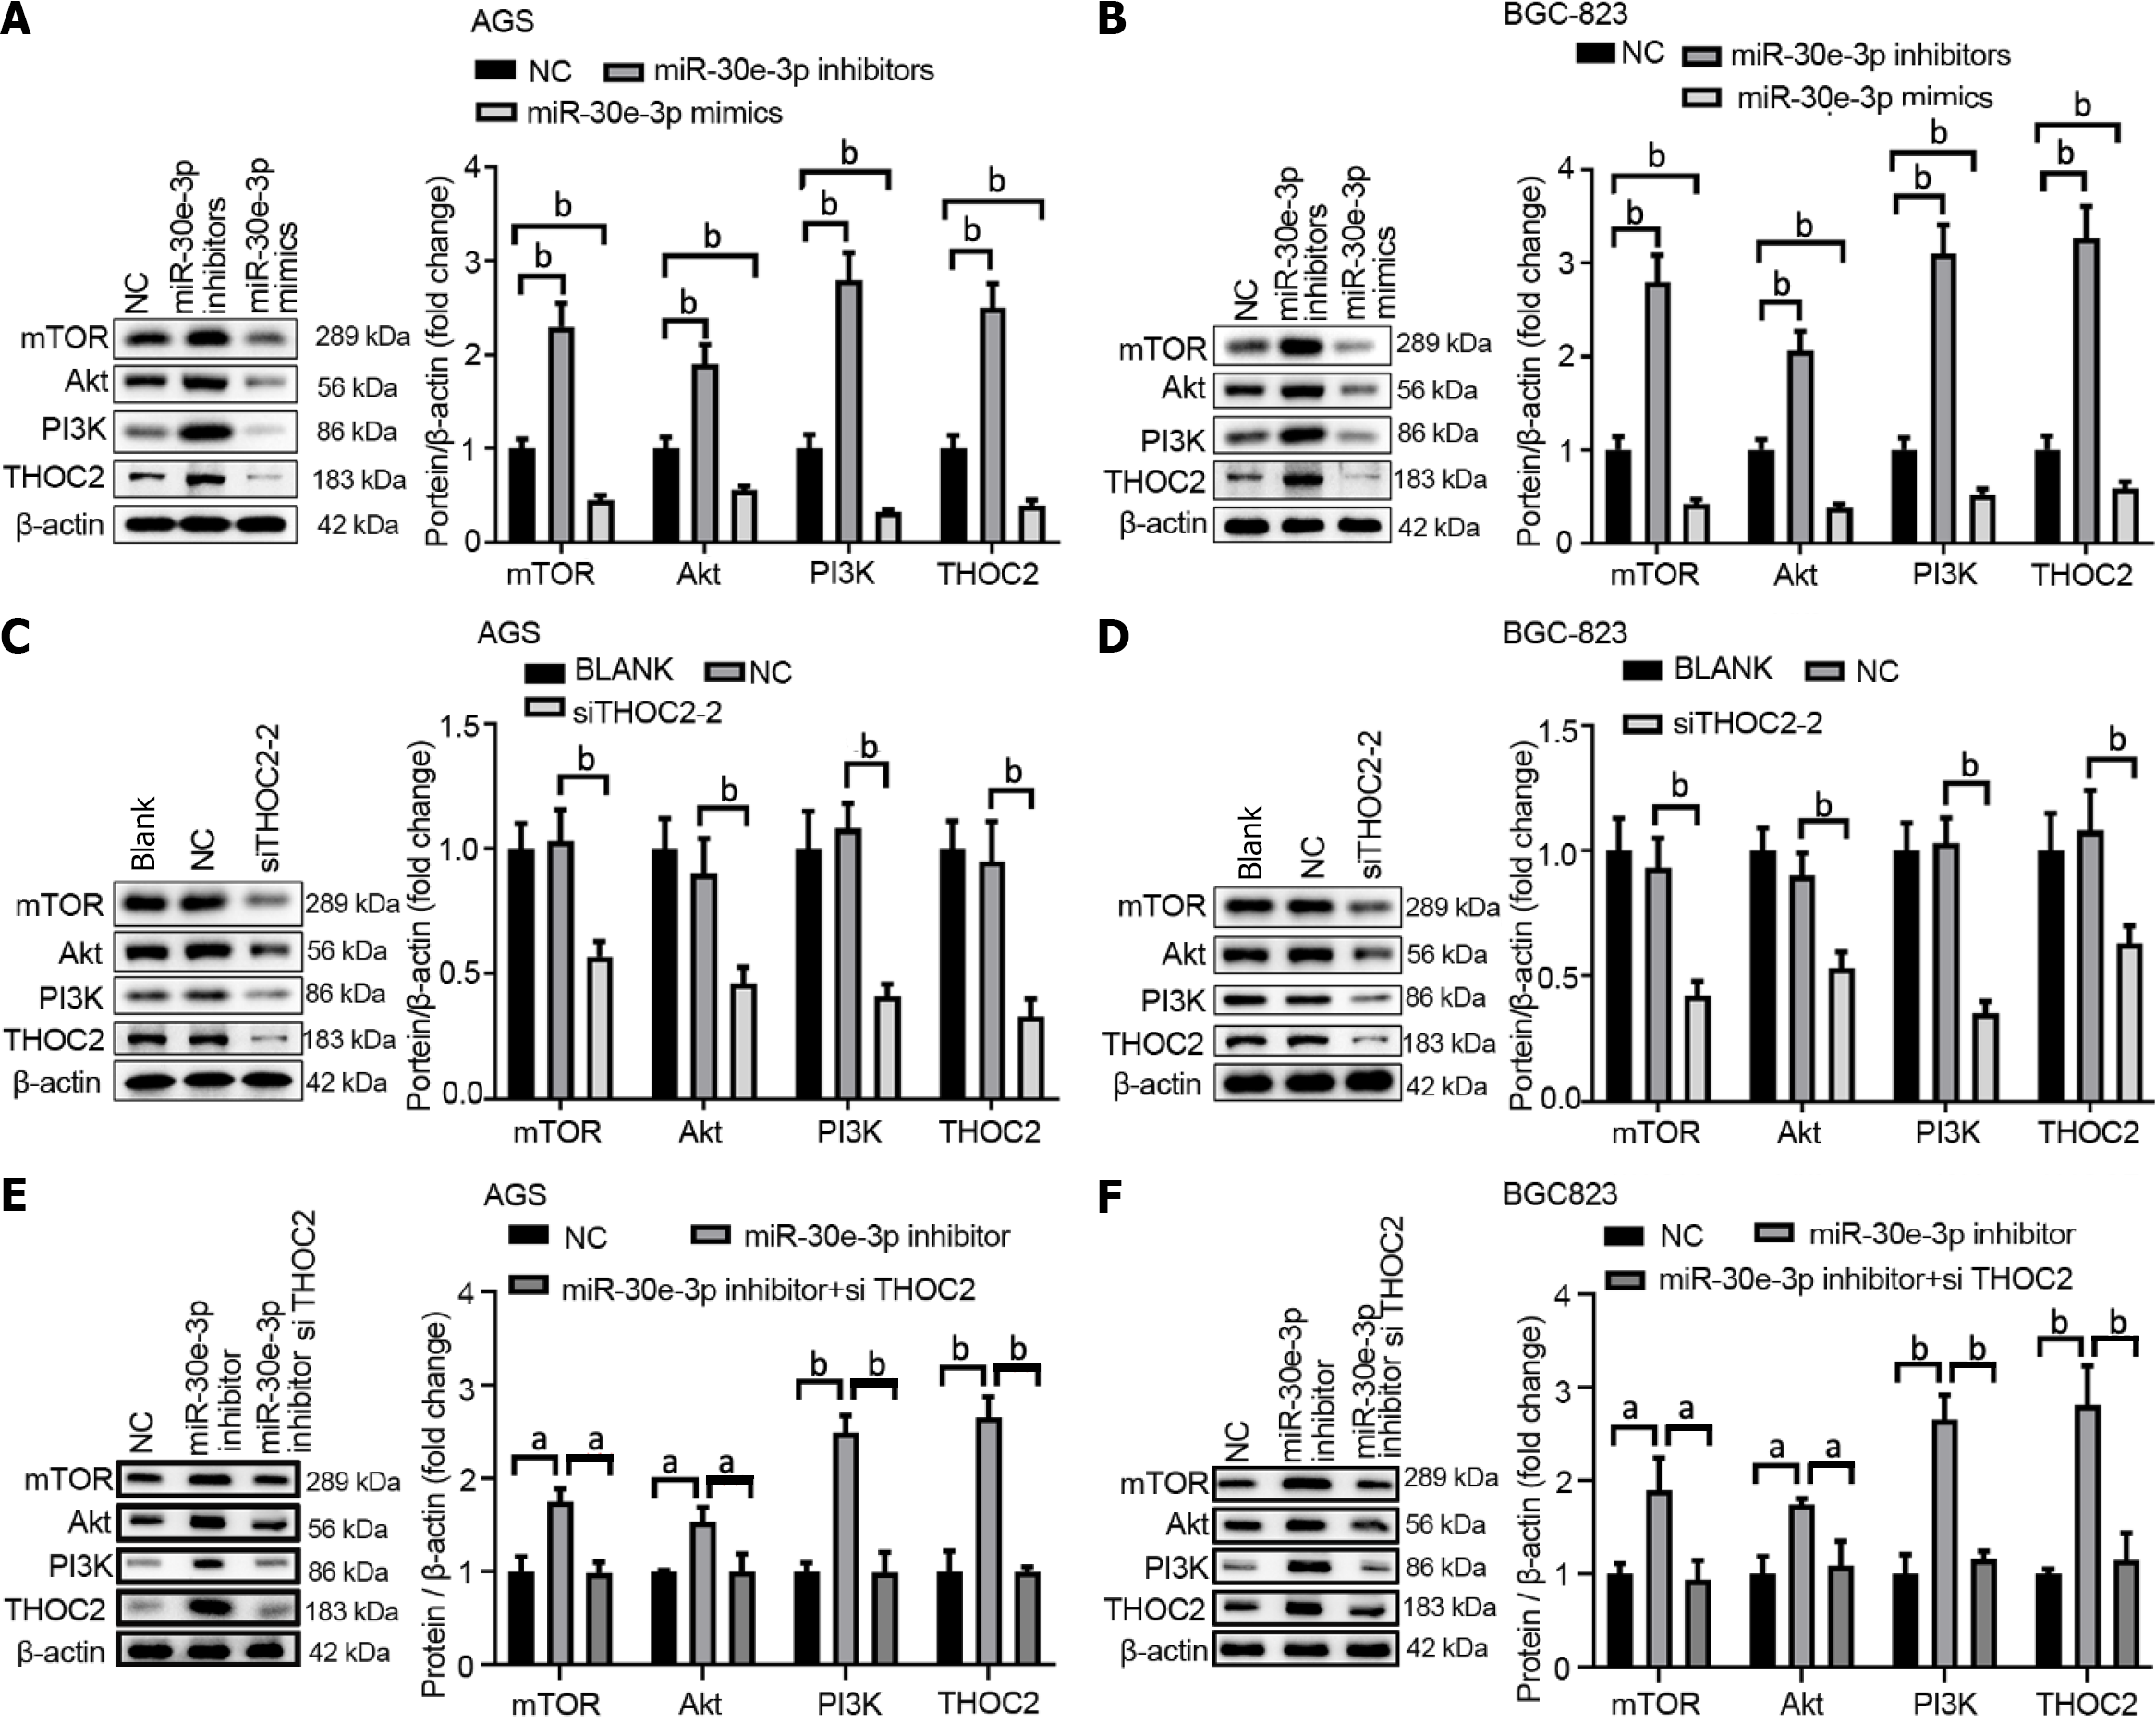
Figure 6 MiR-30e-3p regulates the PI3K/AKT/mTOR signaling pathway via inhibiting THO complex 2 expression in gastric cancer cells.
A and B: AGS or BGC-823 cells were transfected with NC, miR-30e-3p inhibitors or miR-30e-3p mimics. The relative protein expression of THO complex 2 (THOC2), PI3K, AKT and mTOR was detected by western blot after 48 h; C and D: AGS or BGC-823 cells were transfected with NC, siTHOC2 or left untreated (blank). The relative protein expression of THOC2, PI3K, AKT and mTOR was detected by western blot after 48 h; E and F: AGS or BGC-823 cells were transfected with NC, miR-30e-3p inhibitor, miR-30e-3p inhibitor and si-THOC2. The relative protein expression of THOC2, PI3K, AKT and mTOR was detected by western blot after 48 h. n = 3 for each group. bP < 0.01.
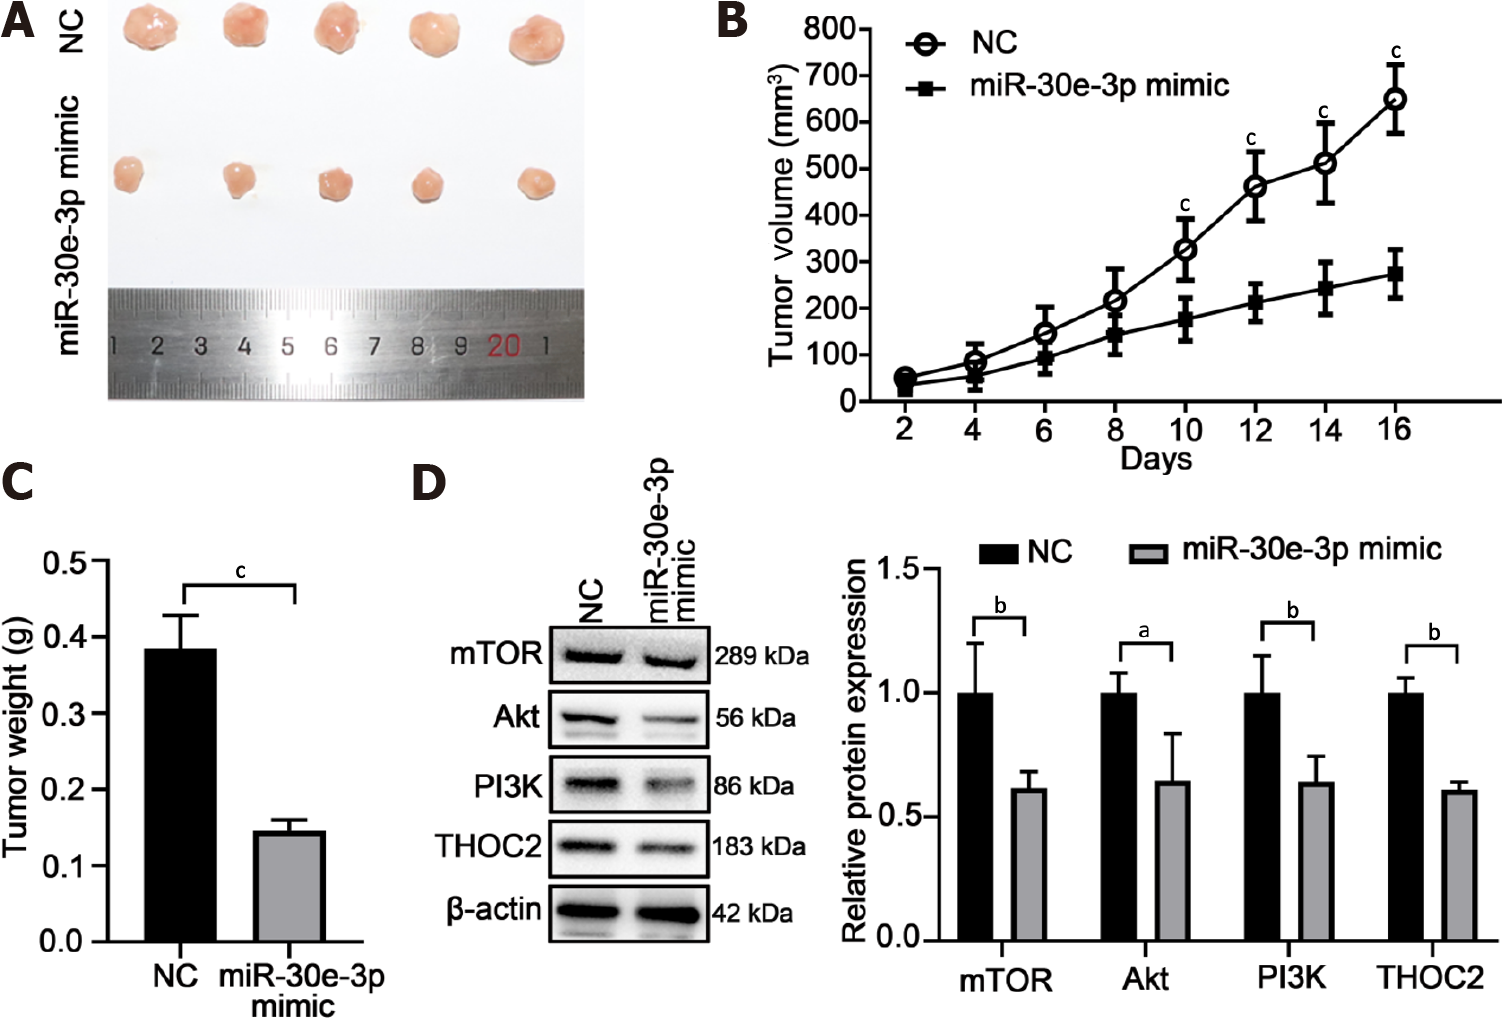
Figure 7 MiR-30e-3p inhibits gastric cancer cells growth in vivo.
A: BGC-823 cells were transfected with NC, miR-30e-3p mimic and injected subcutaneously into BALB/c nude mice. Sixteen days later, the tumors diameter were analyzed. n = 5 for each group; B: The tumor volume (mm3) was measured after the tumor implantation every other day; C: Sixteen days after the tumor implantation, the tumor weight (g) was measured; D: Sixteen days after the tumor implantation, the relative protein expression of THOC2, PI3K, AKT and mTOR was detected by Western blot. aP < 0.05, bP < 0.01.
- Citation: Gu XJ, Li YJ, Wang F, Ye T. MiR-30e-3p inhibits gastric cancer development by negatively regulating THO complex 2 and PI3K/AKT/mTOR signaling. World J Gastrointest Oncol 2022; 14(11): 2170-2182
- URL: https://www.wjgnet.com/1948-5204/full/v14/i11/2170.htm
- DOI: https://dx.doi.org/10.4251/wjgo.v14.i11.2170


