Copyright
©The Author(s) 2021.
World J Gastrointest Oncol. Jan 15, 2021; 13(1): 69-86
Published online Jan 15, 2021. doi: 10.4251/wjgo.v13.i1.69
Published online Jan 15, 2021. doi: 10.4251/wjgo.v13.i1.69
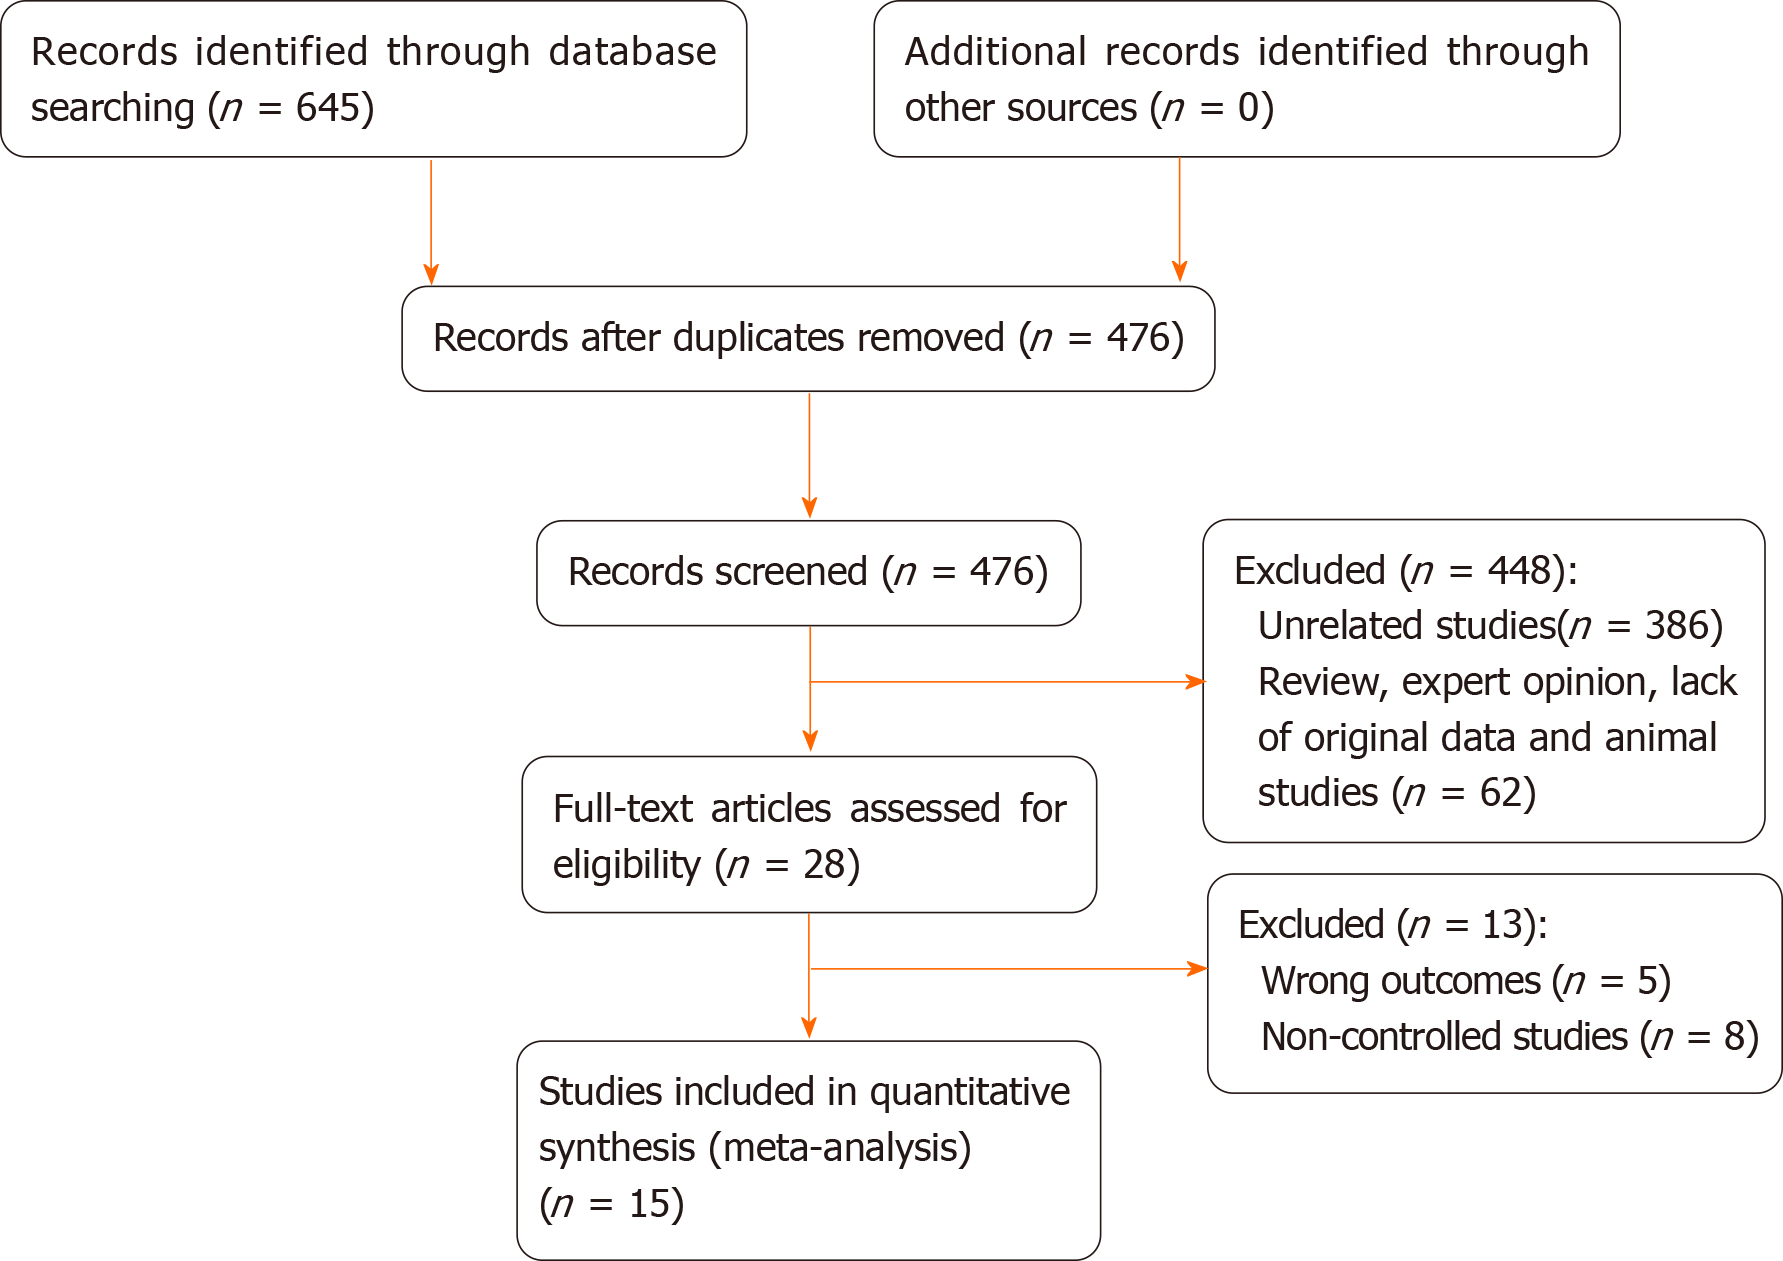
Figure 1 Study identification and selection flow chart.
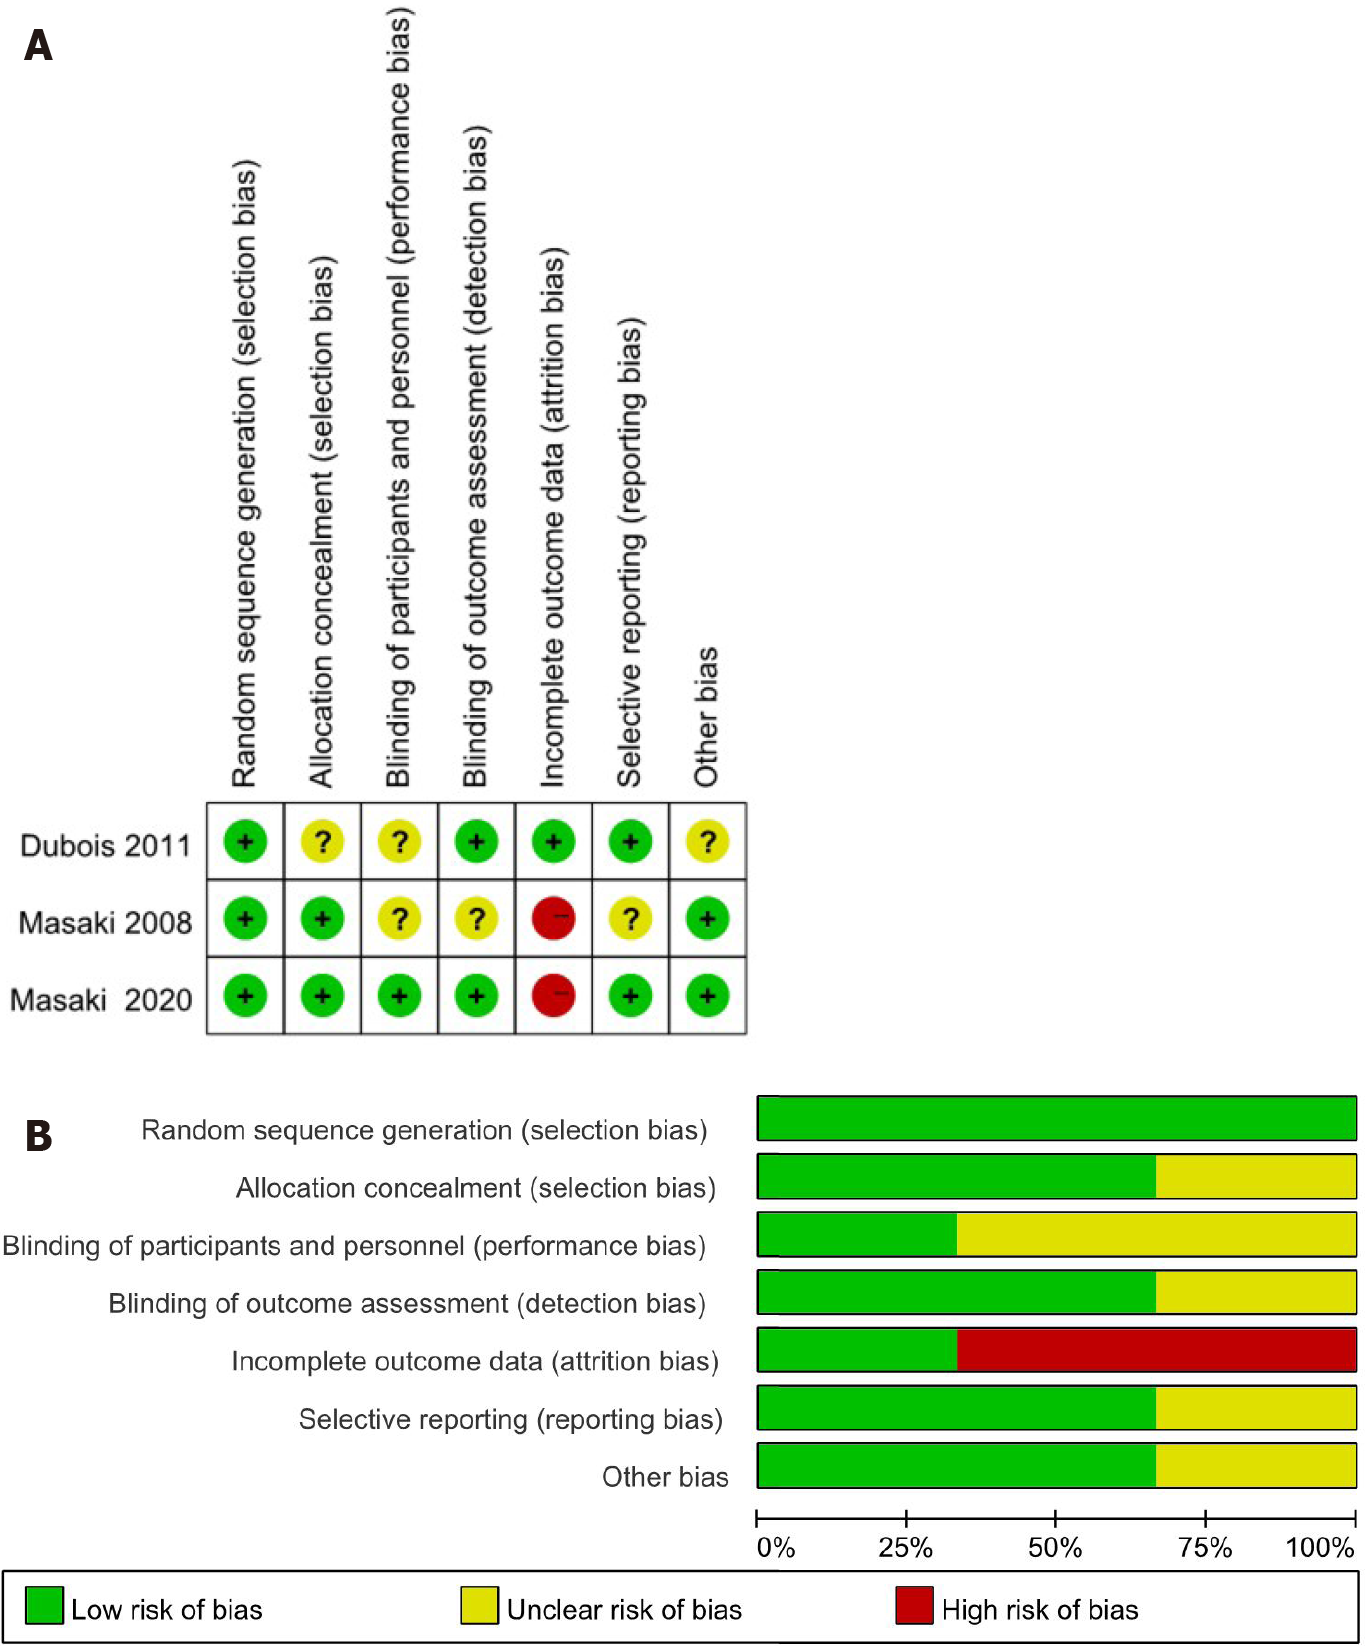
Figure 2 Quality assessment of three randomized controlled trials.
A: Risk of bias summary; B: Risk of bias graph.
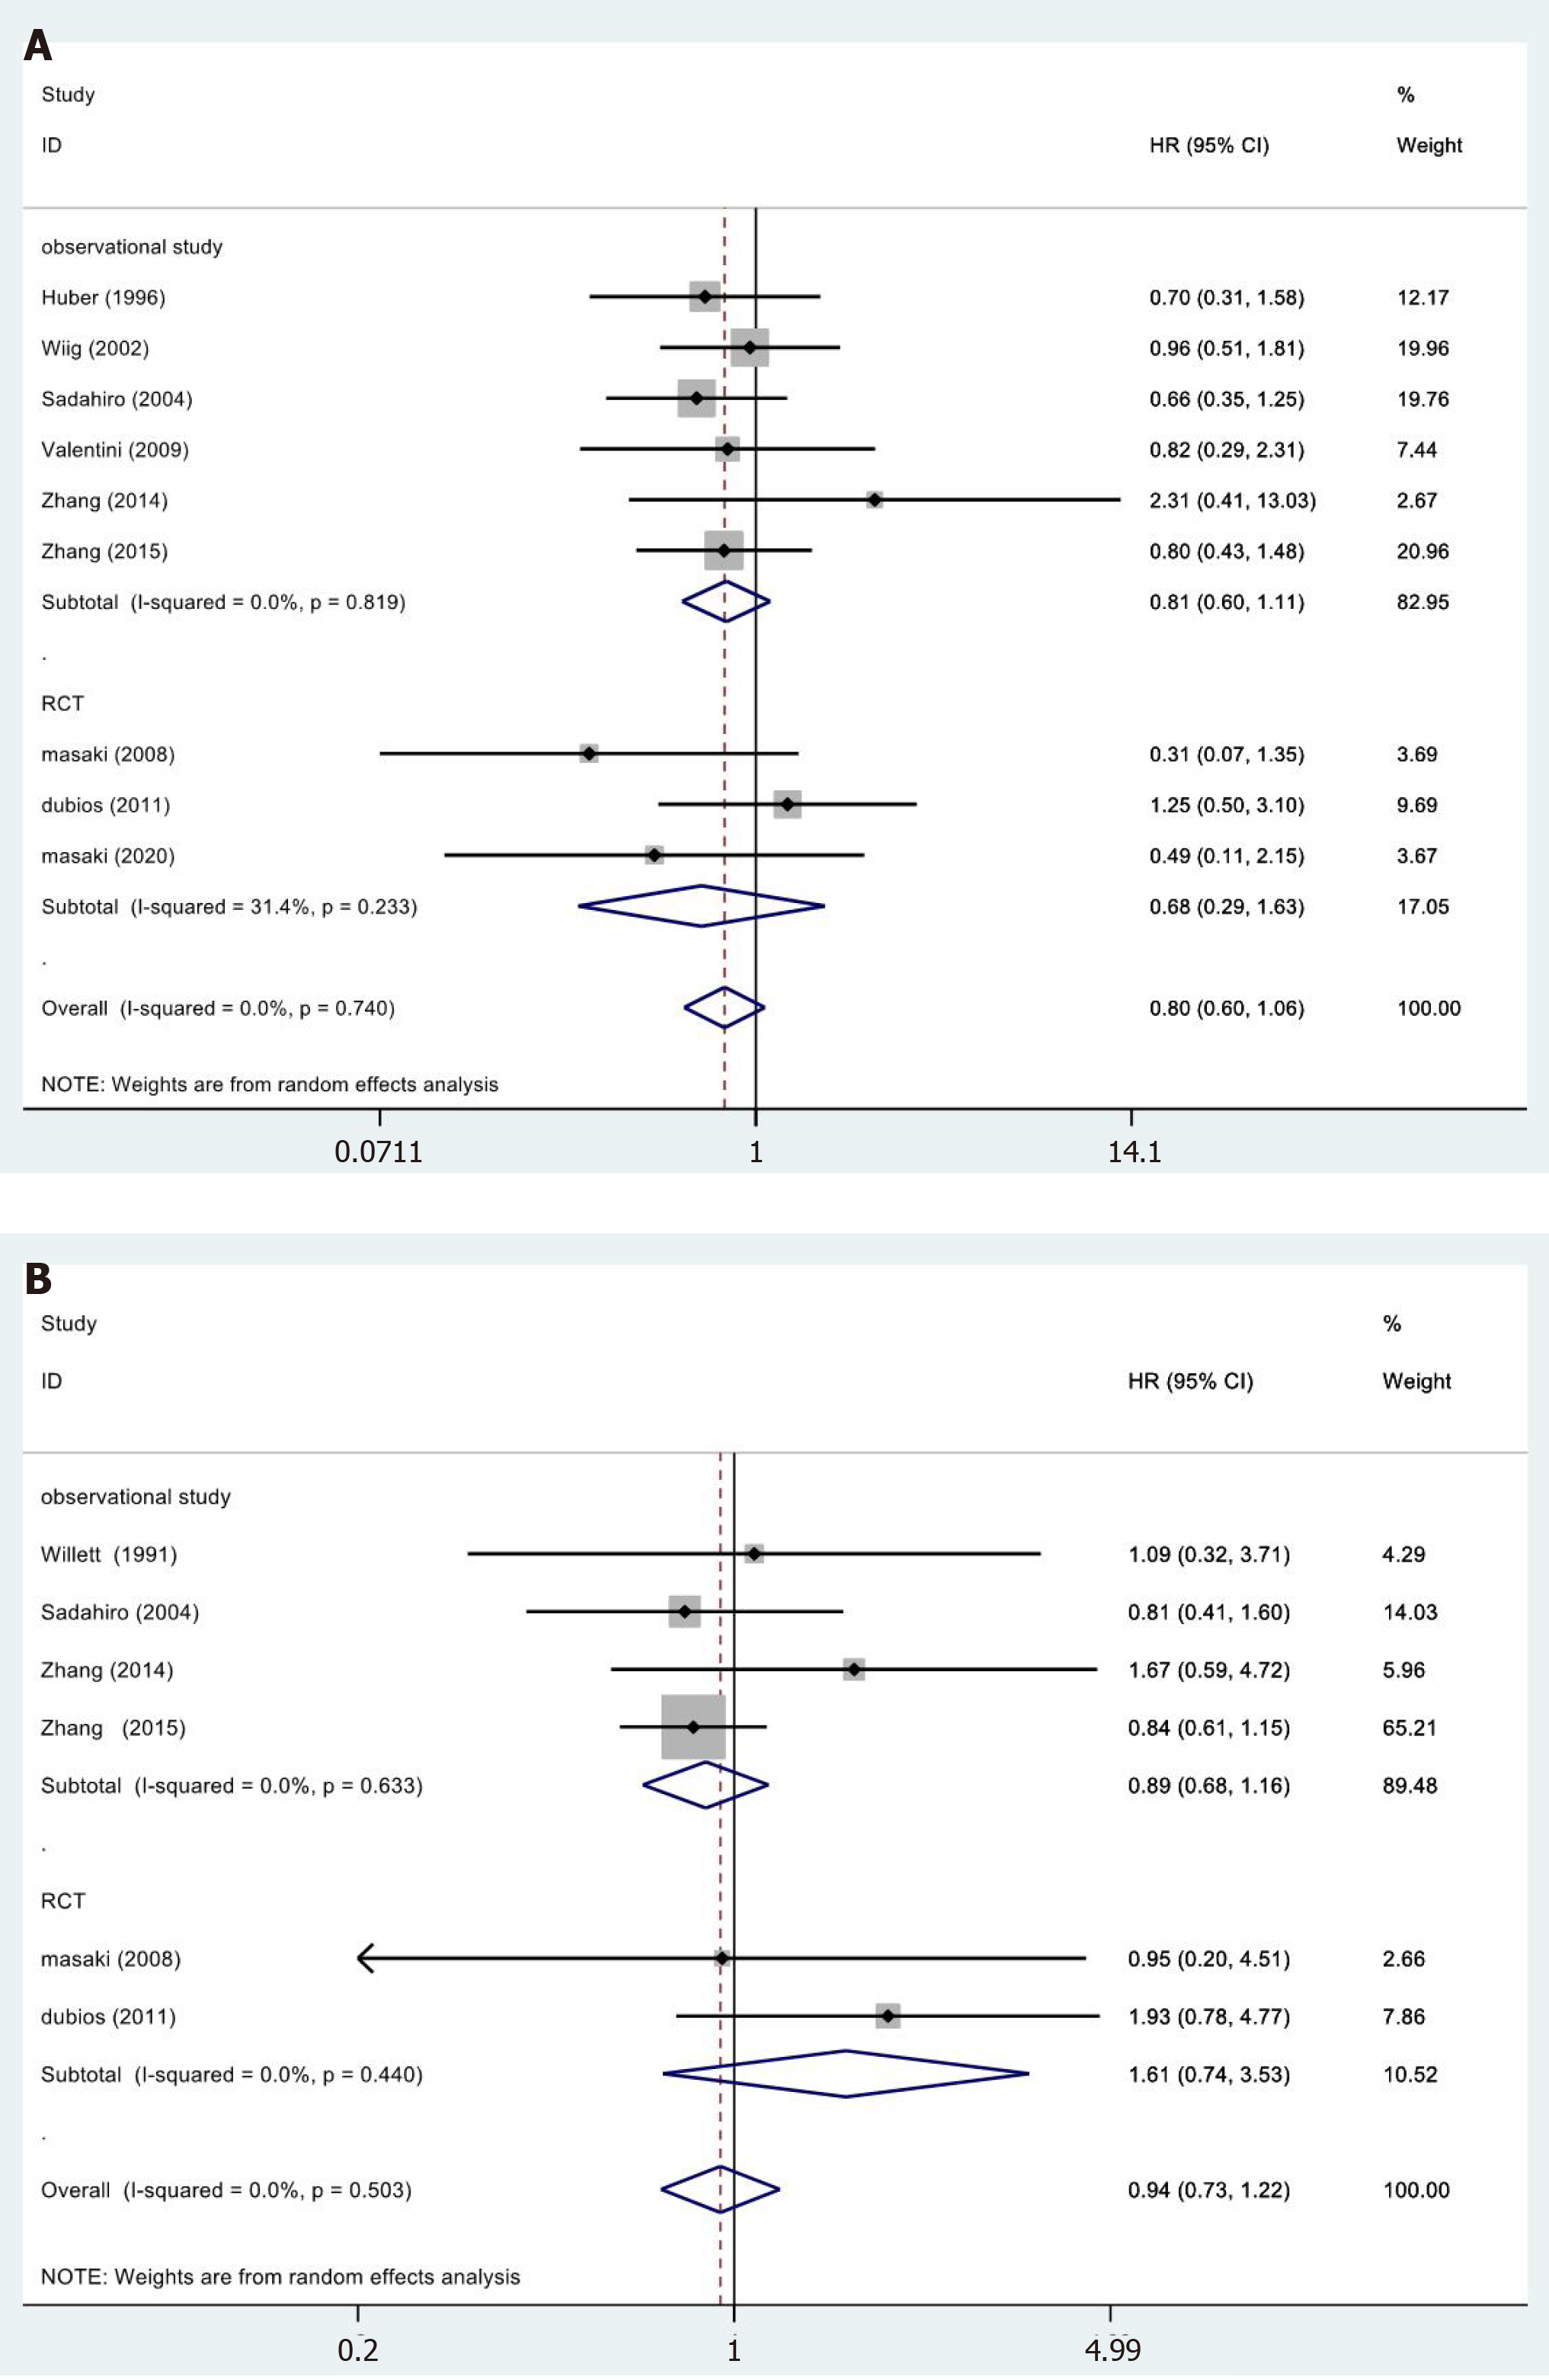
Figure 3 Results of meta-analysis.
A: 5-yr overall survival; B: 5-yr disease-free survival.
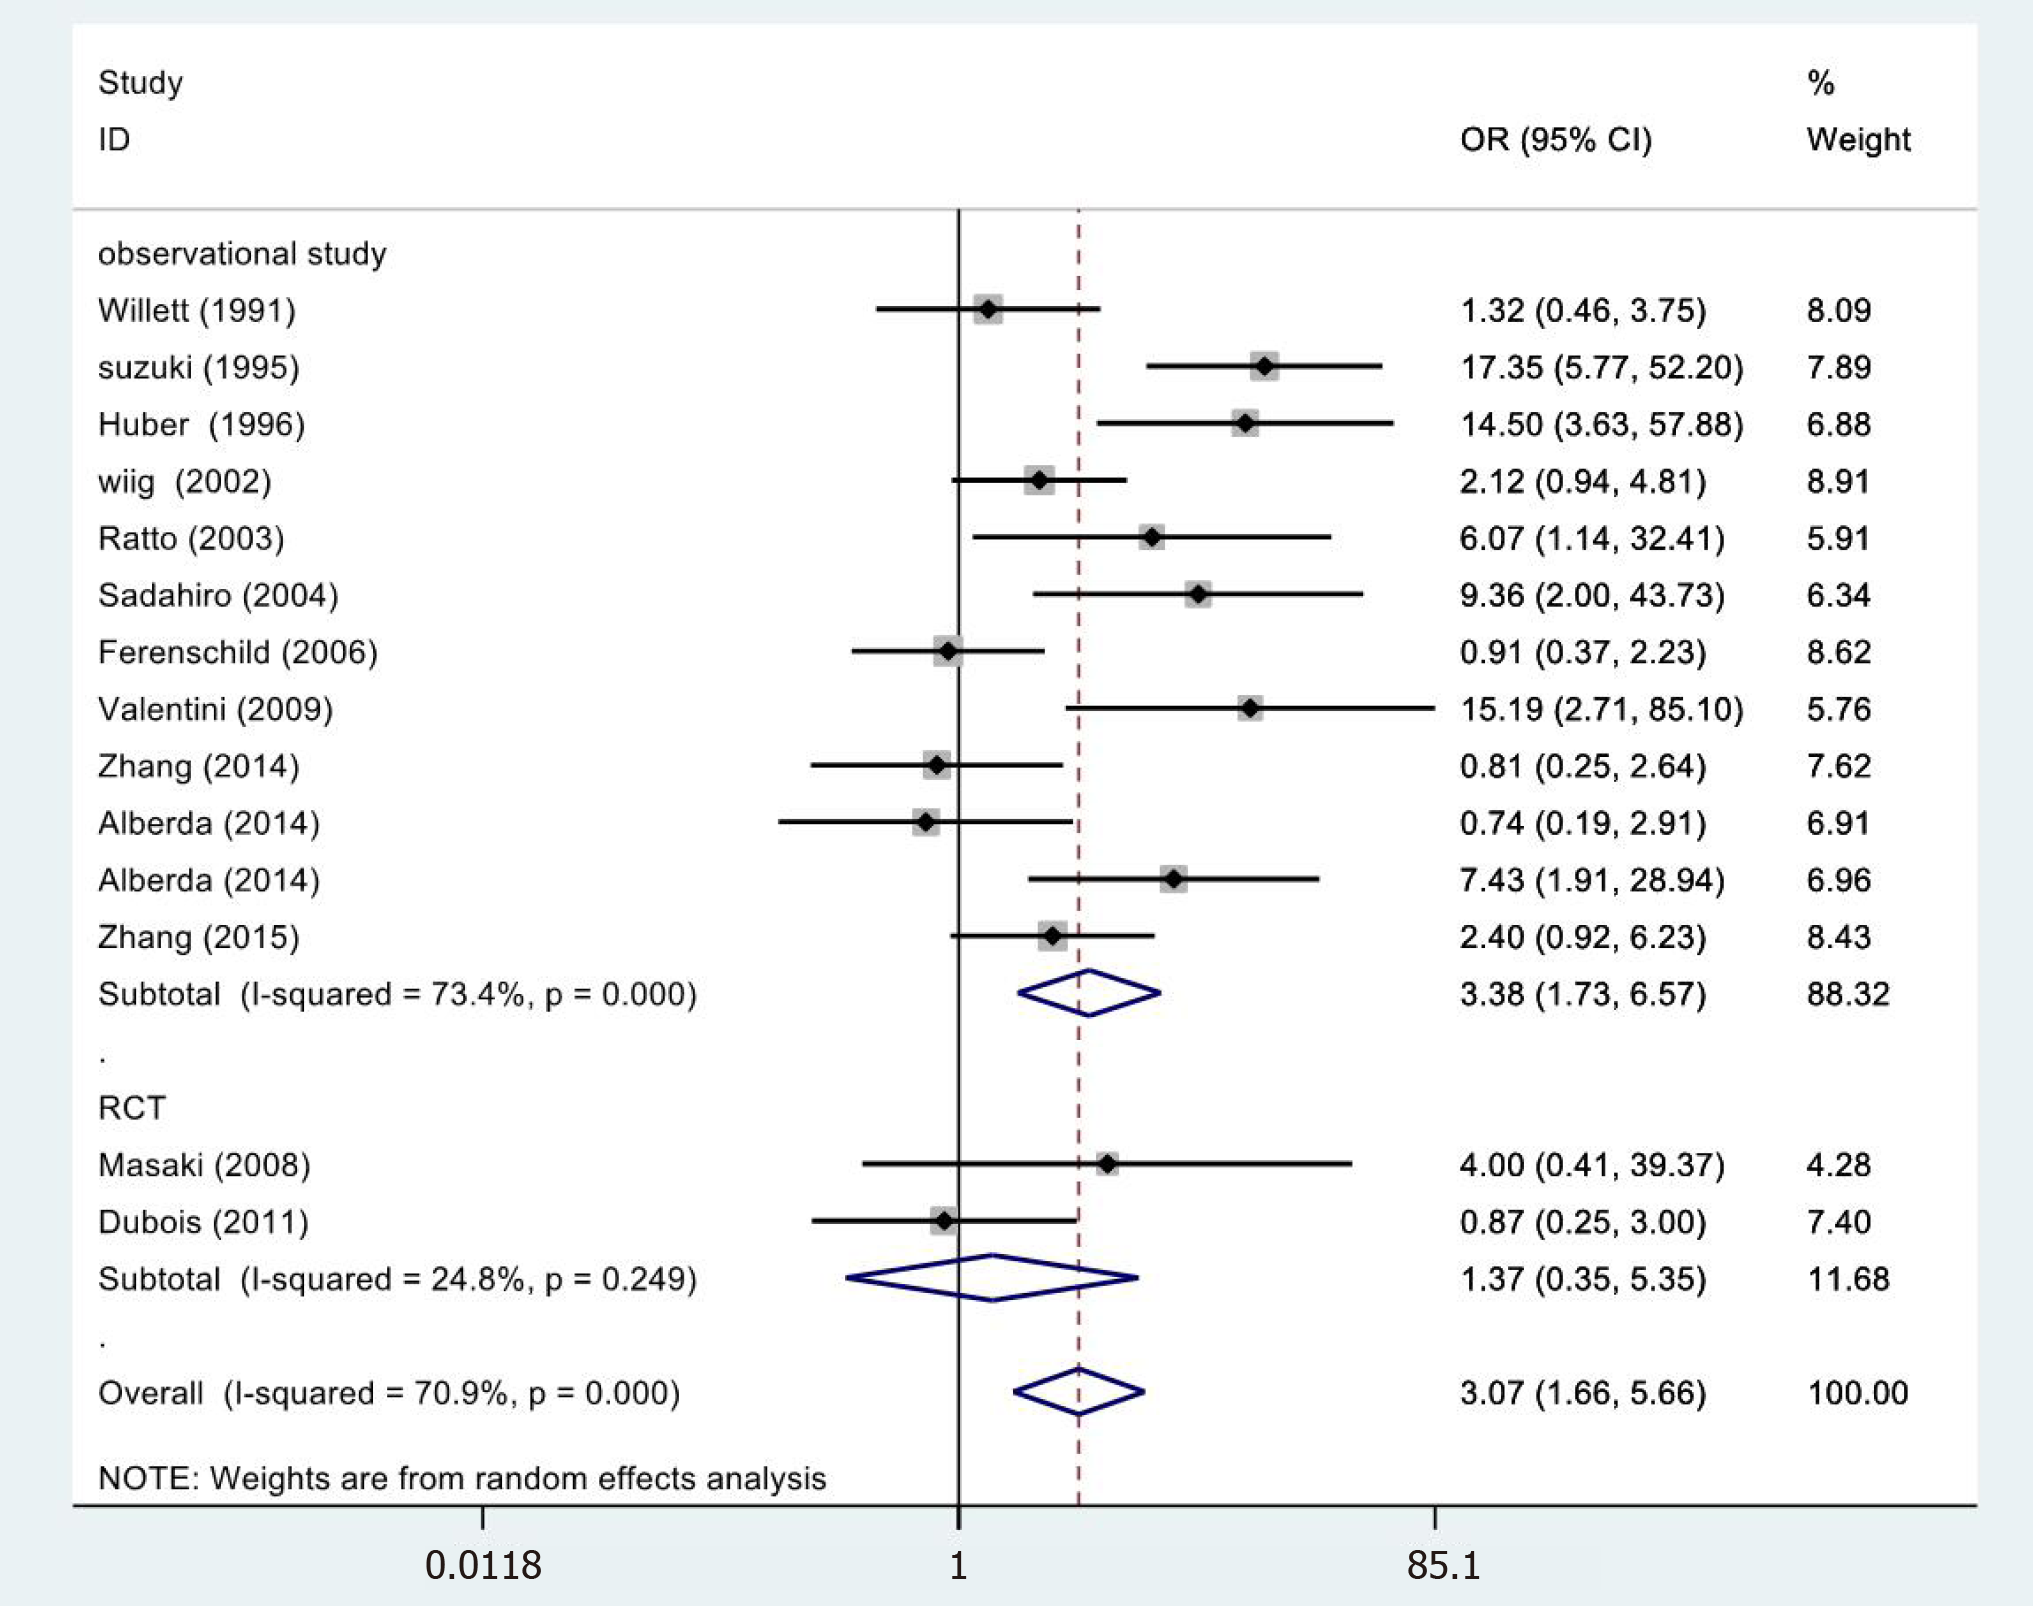
Figure 4 Results of meta-analysis: 5-year local control.
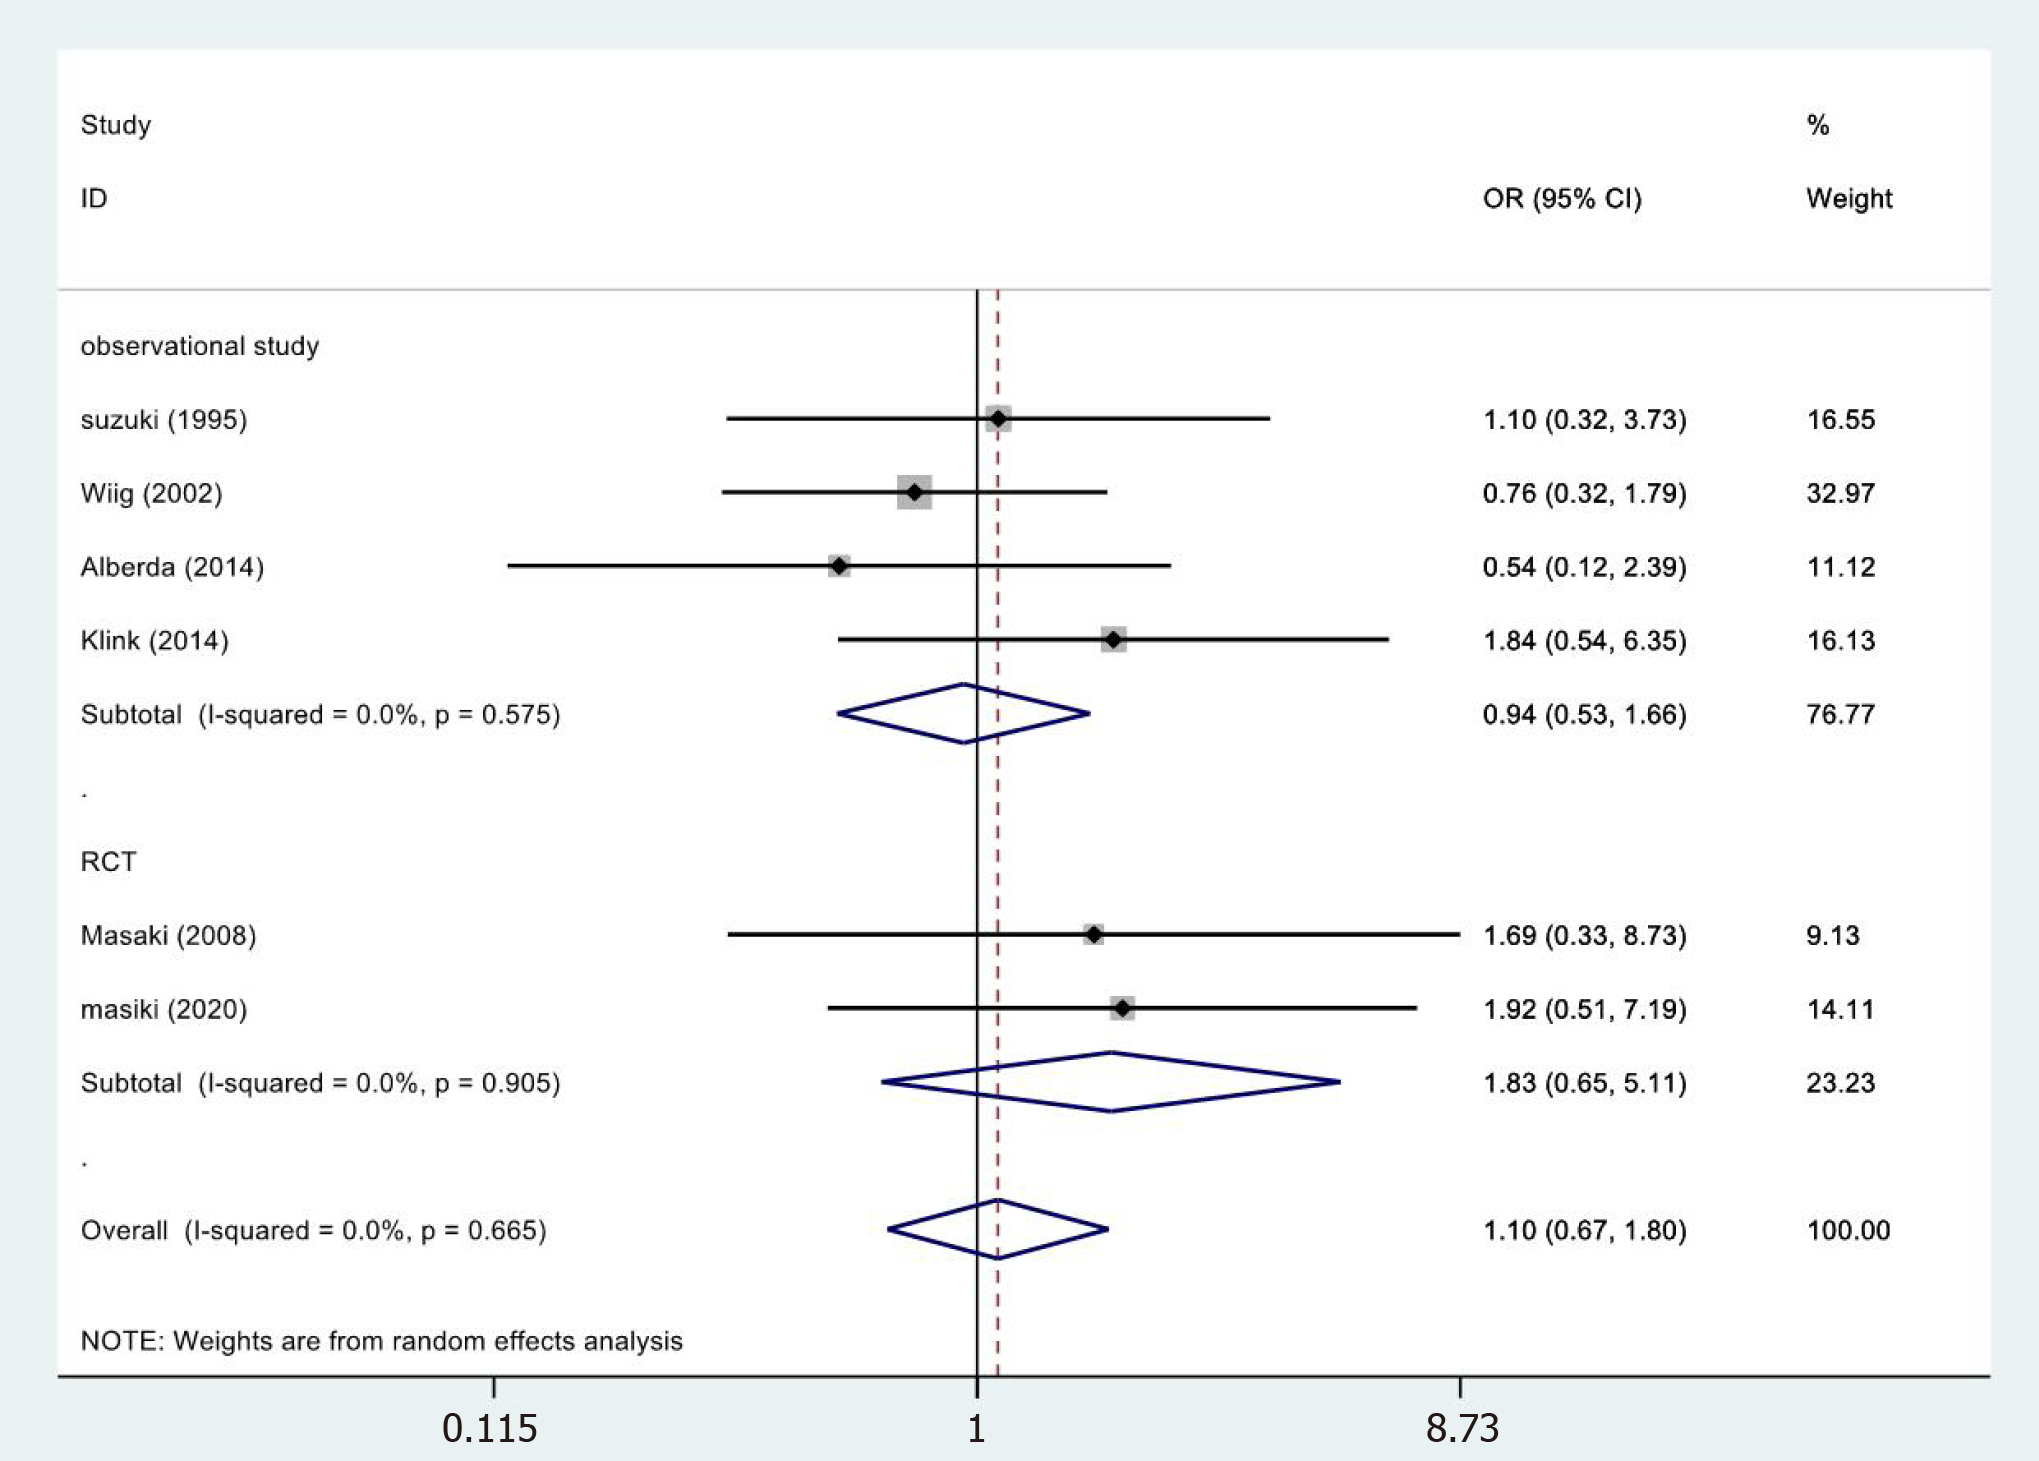
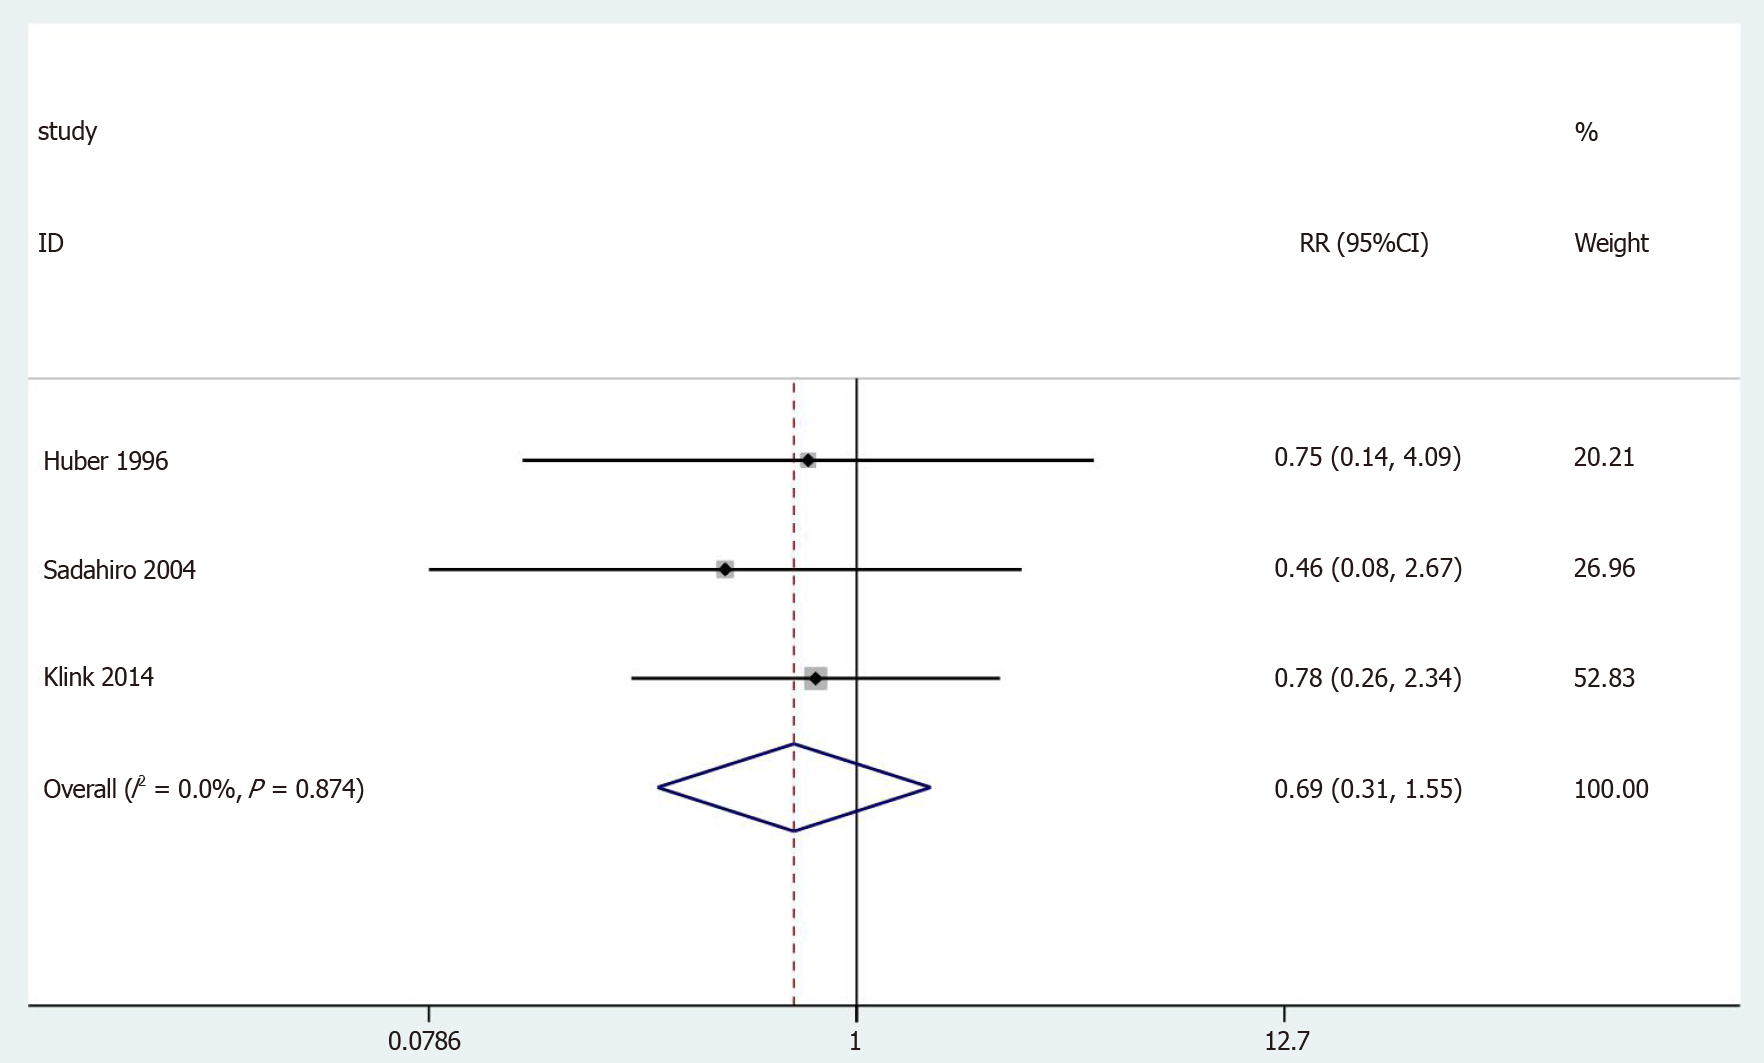
Figure 5 Results of meta-analysis: Abscess.
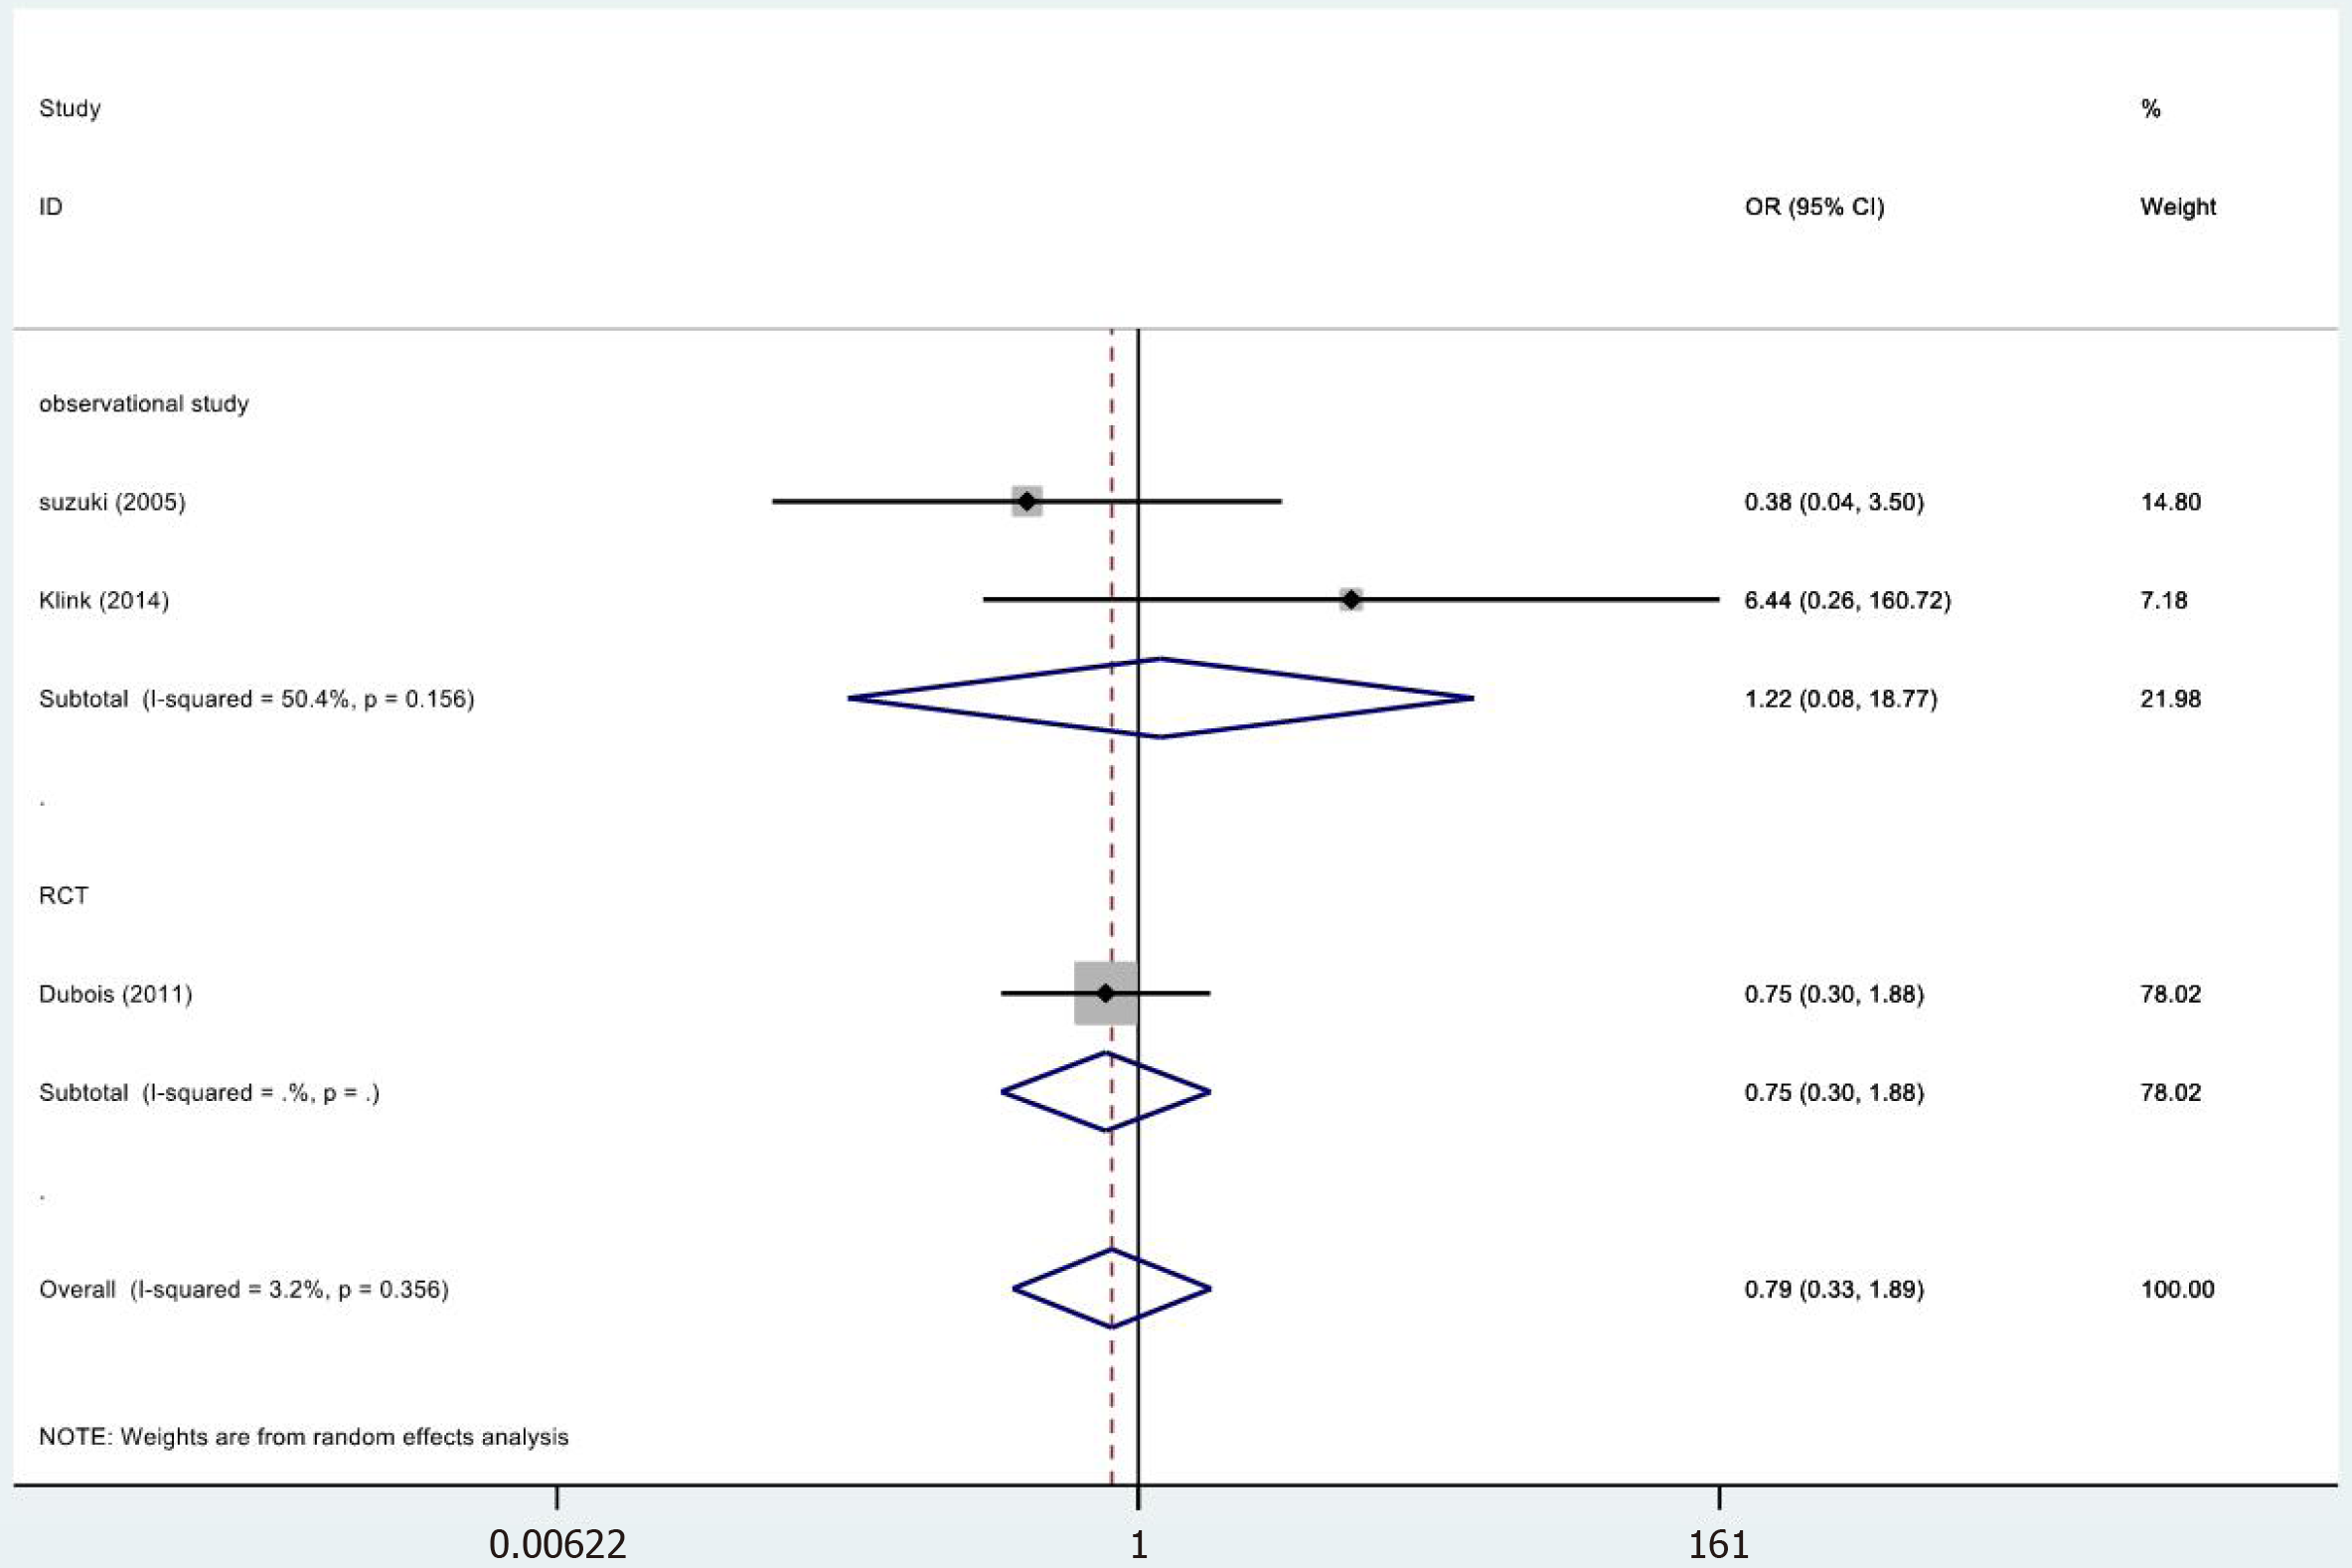
Figure 6 Results of meta-analysis: Fistulae.
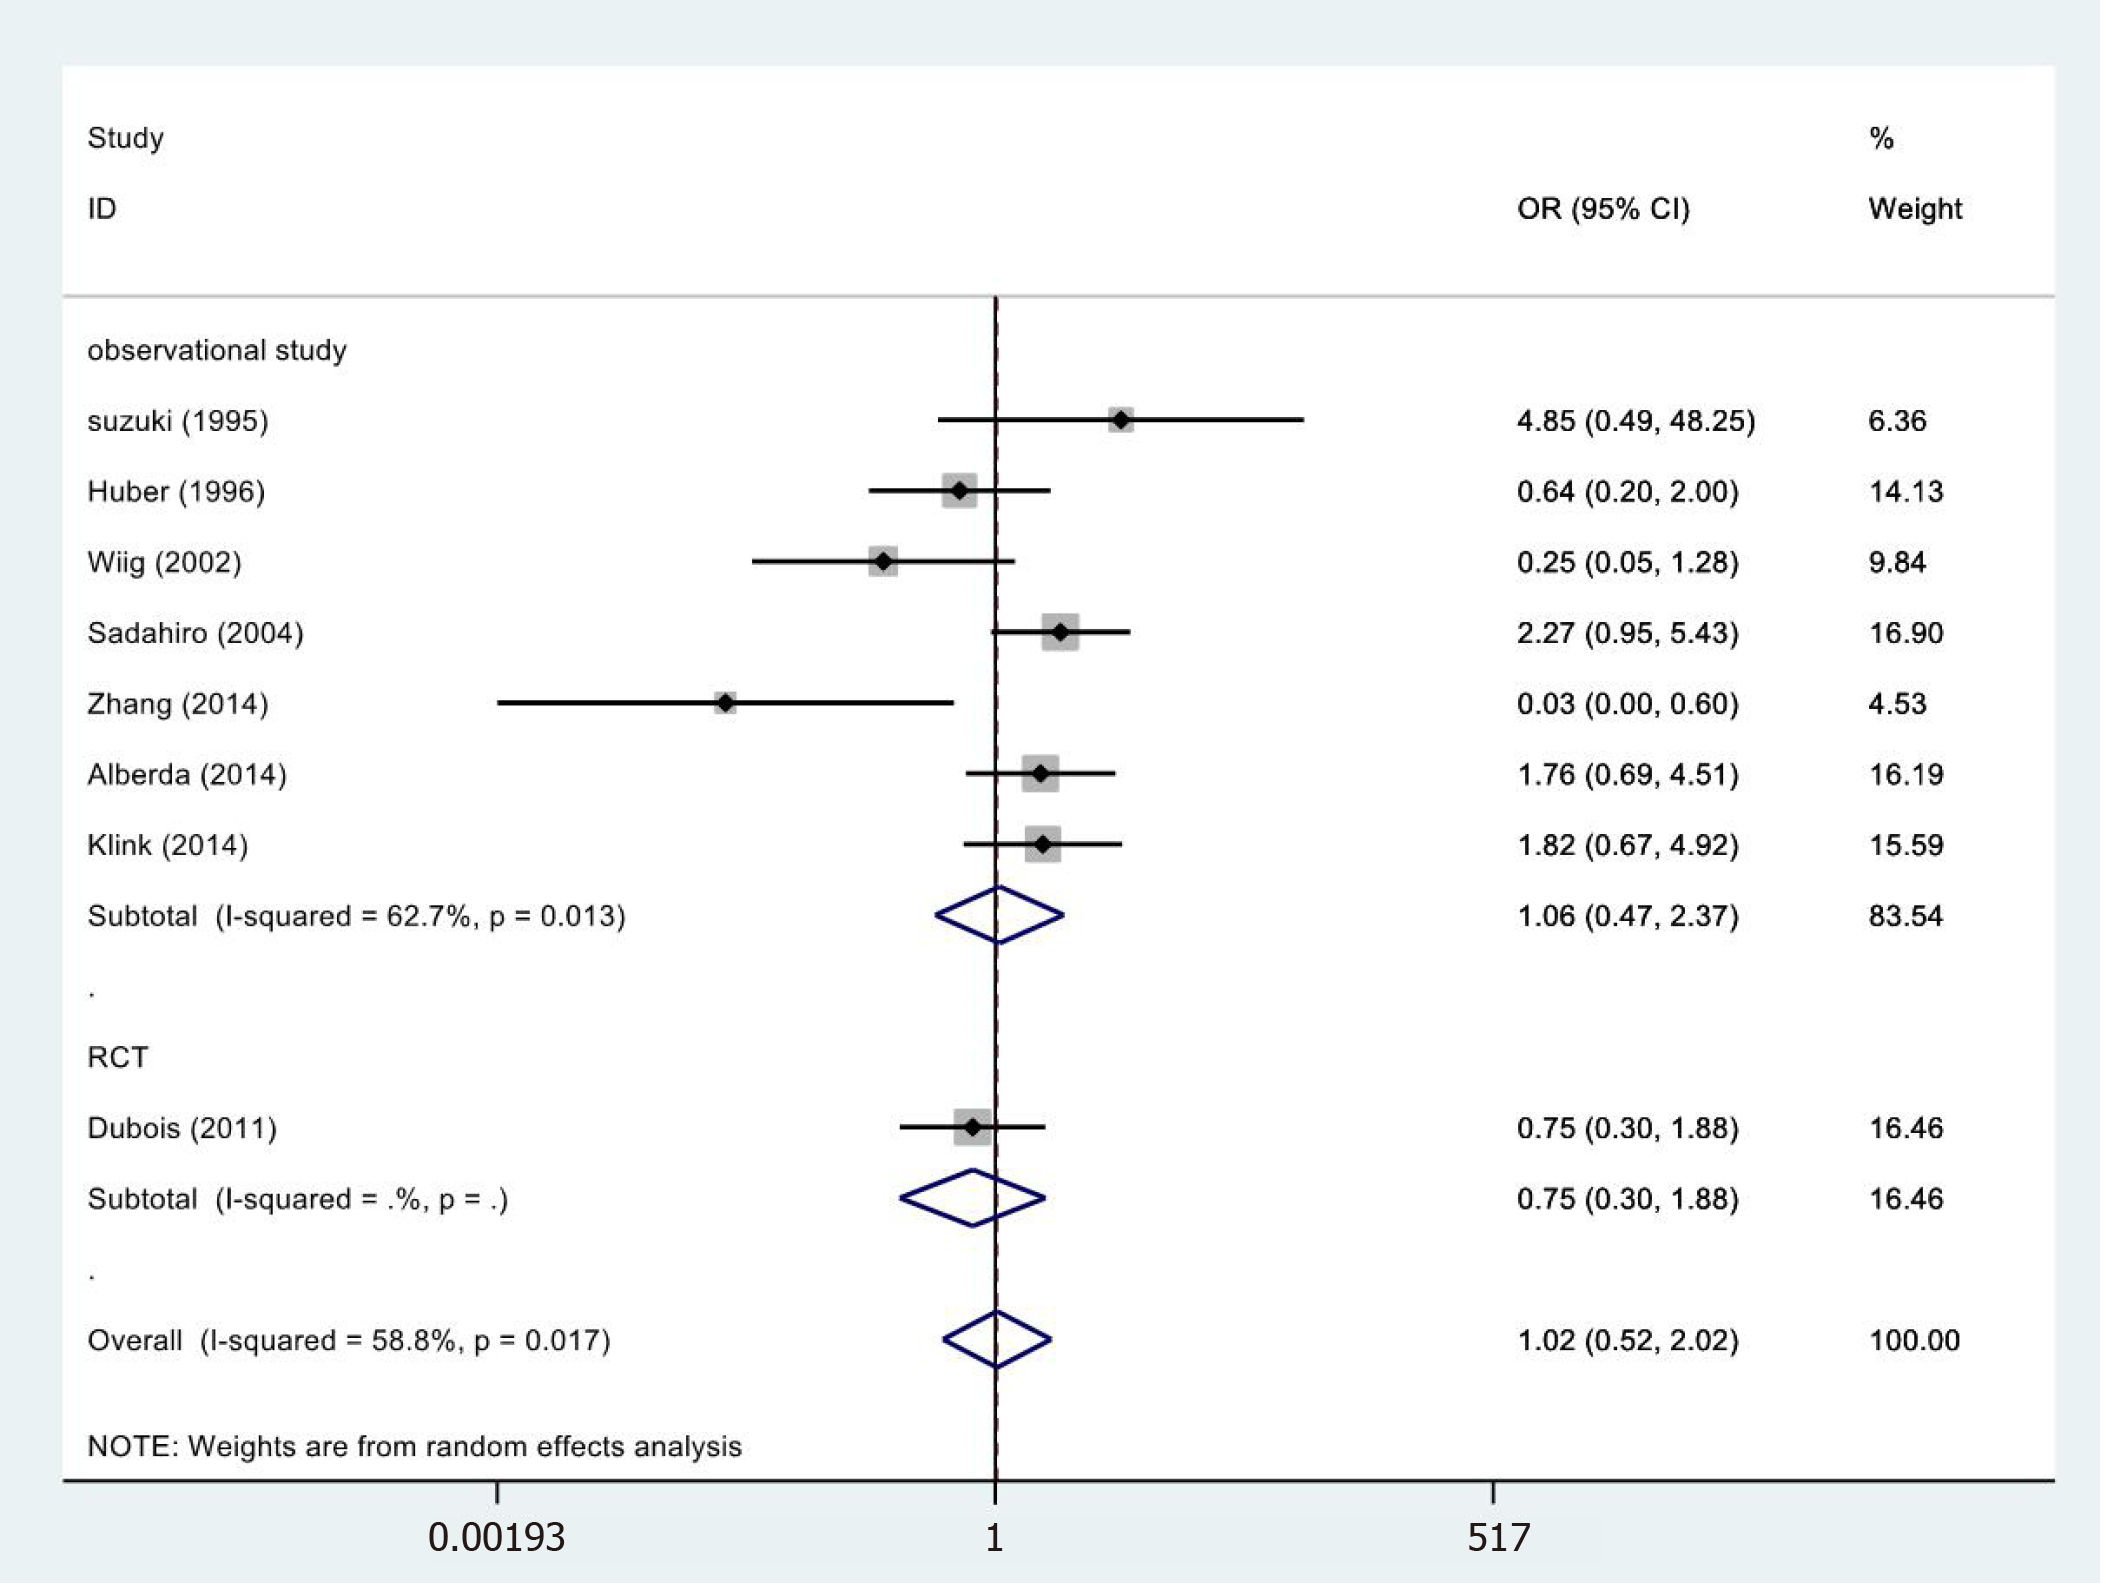
Figure 7 Results of meta-analysis: Wound complications.
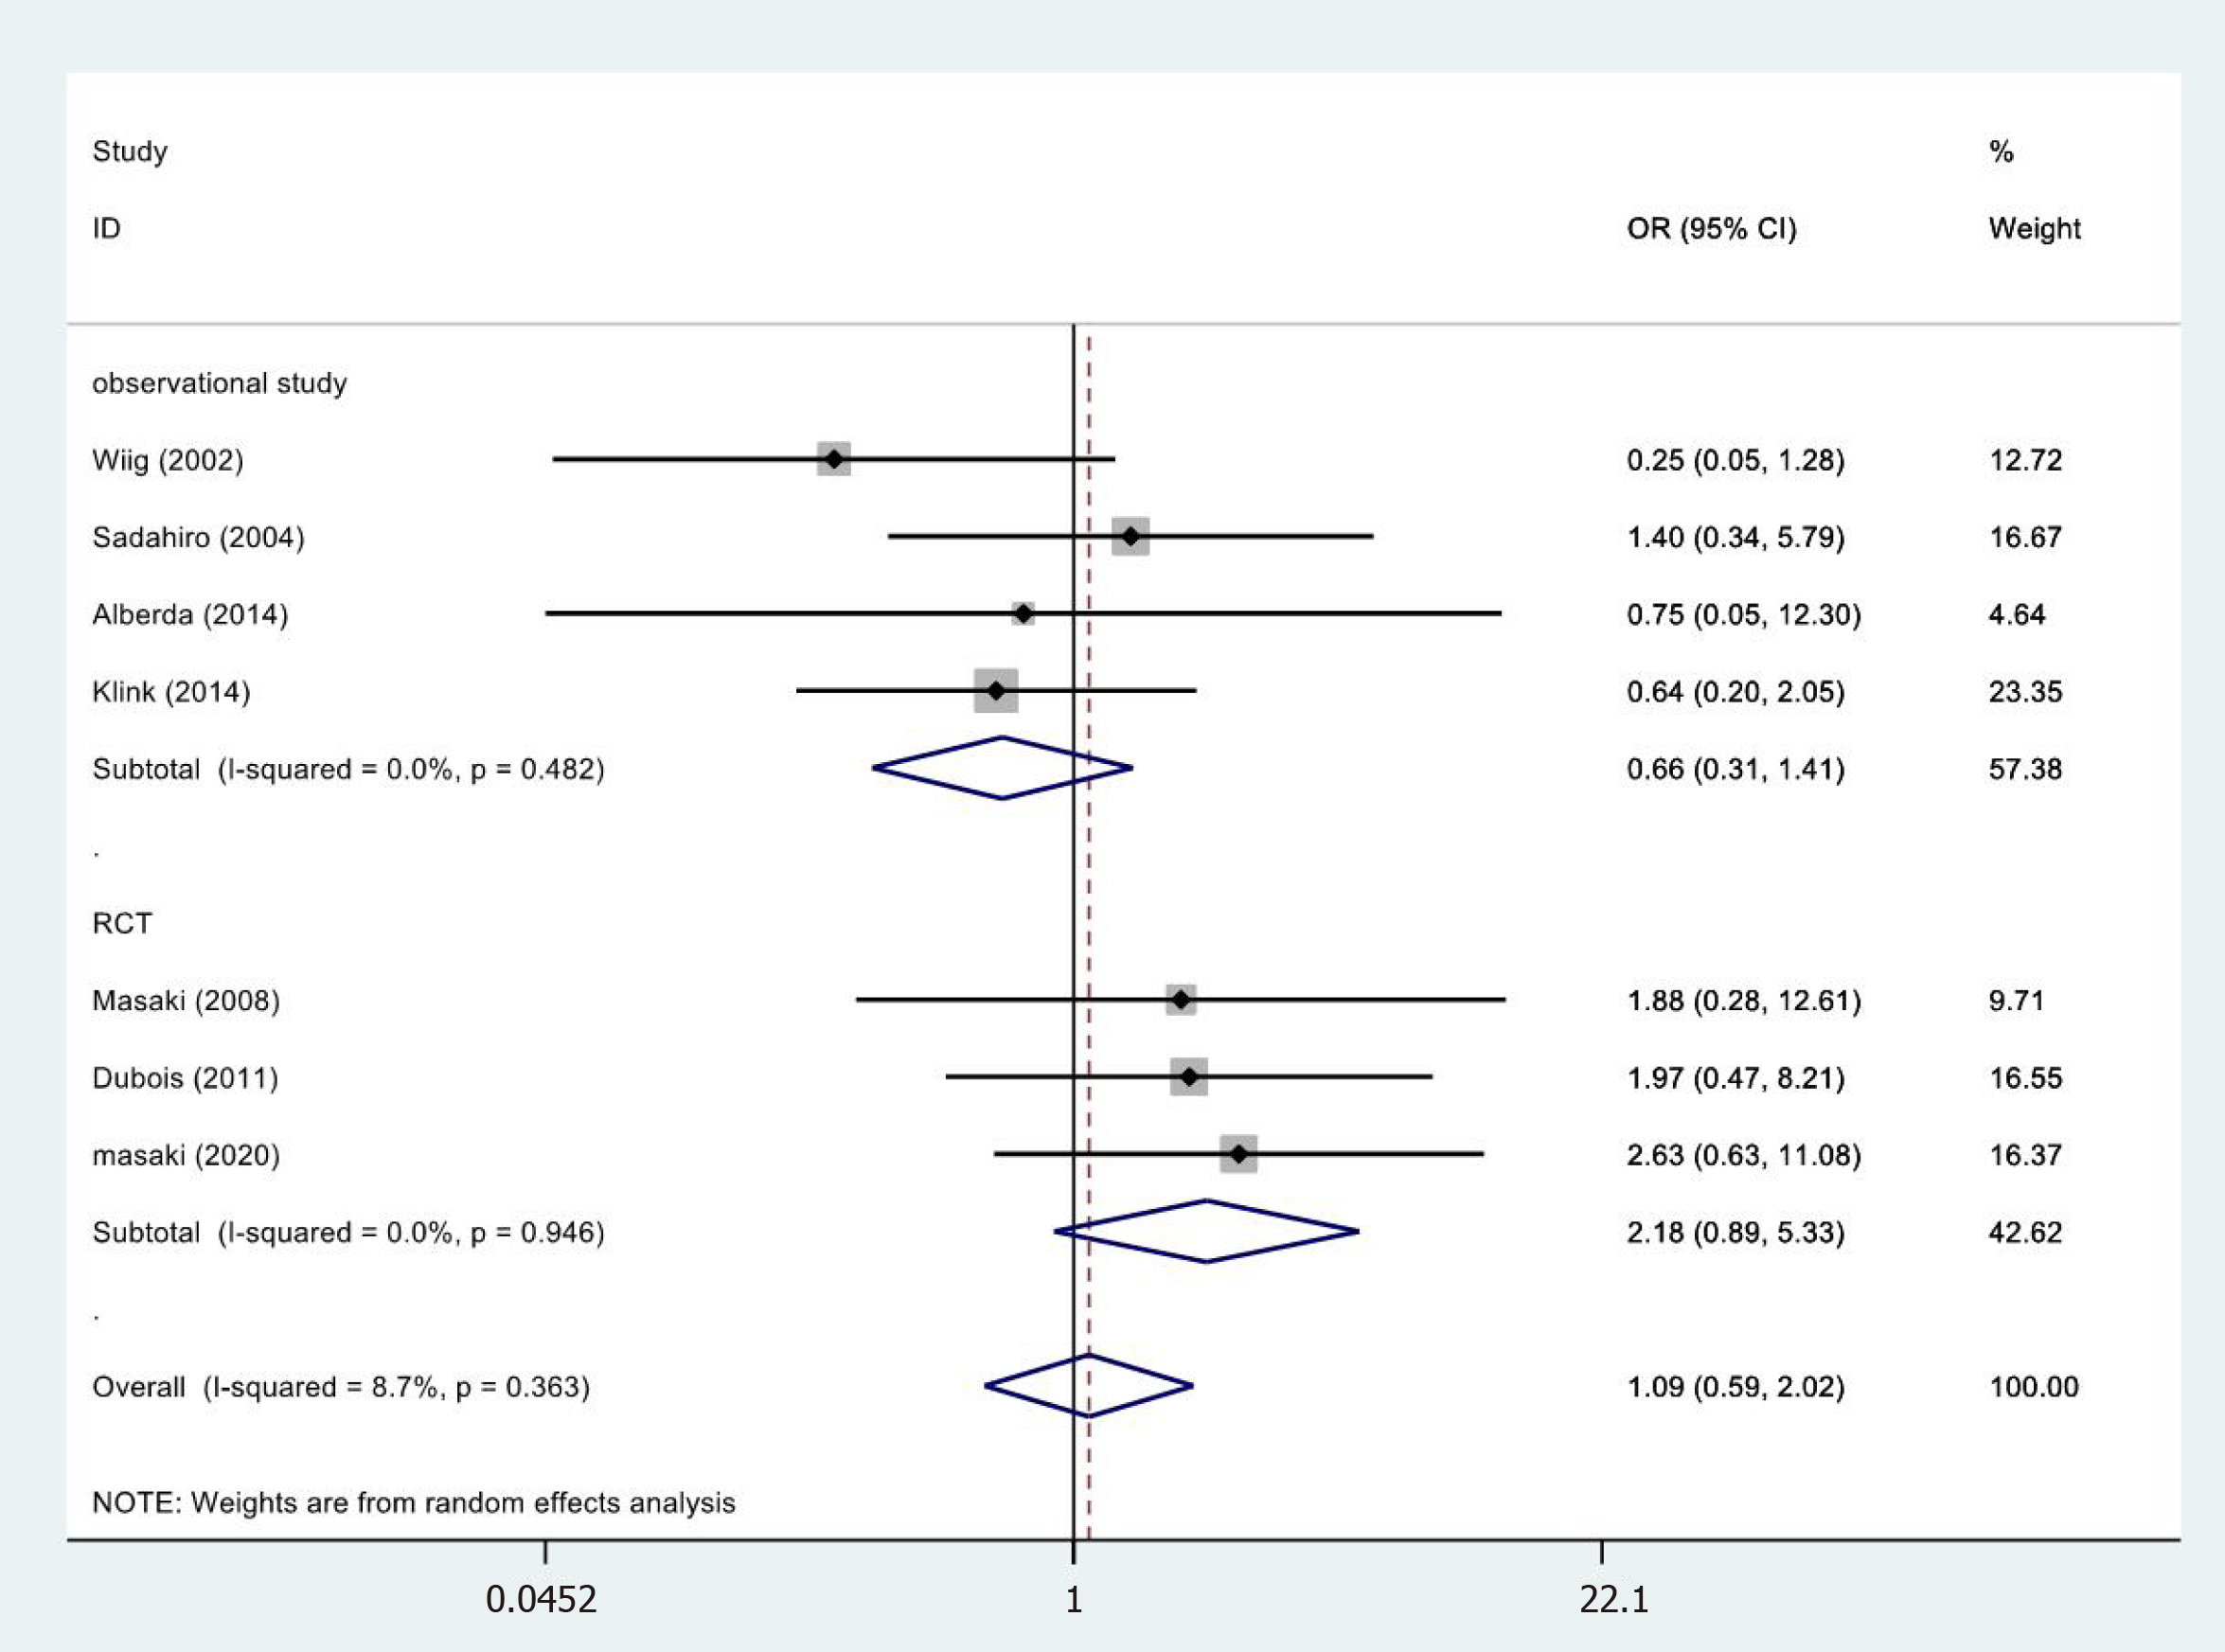
Figure 8 Results of meta-analysis: Fistulae anastomotic leakage.
Figure 9 Results of meta-analysis: Neurogenic bladder dysfunction.
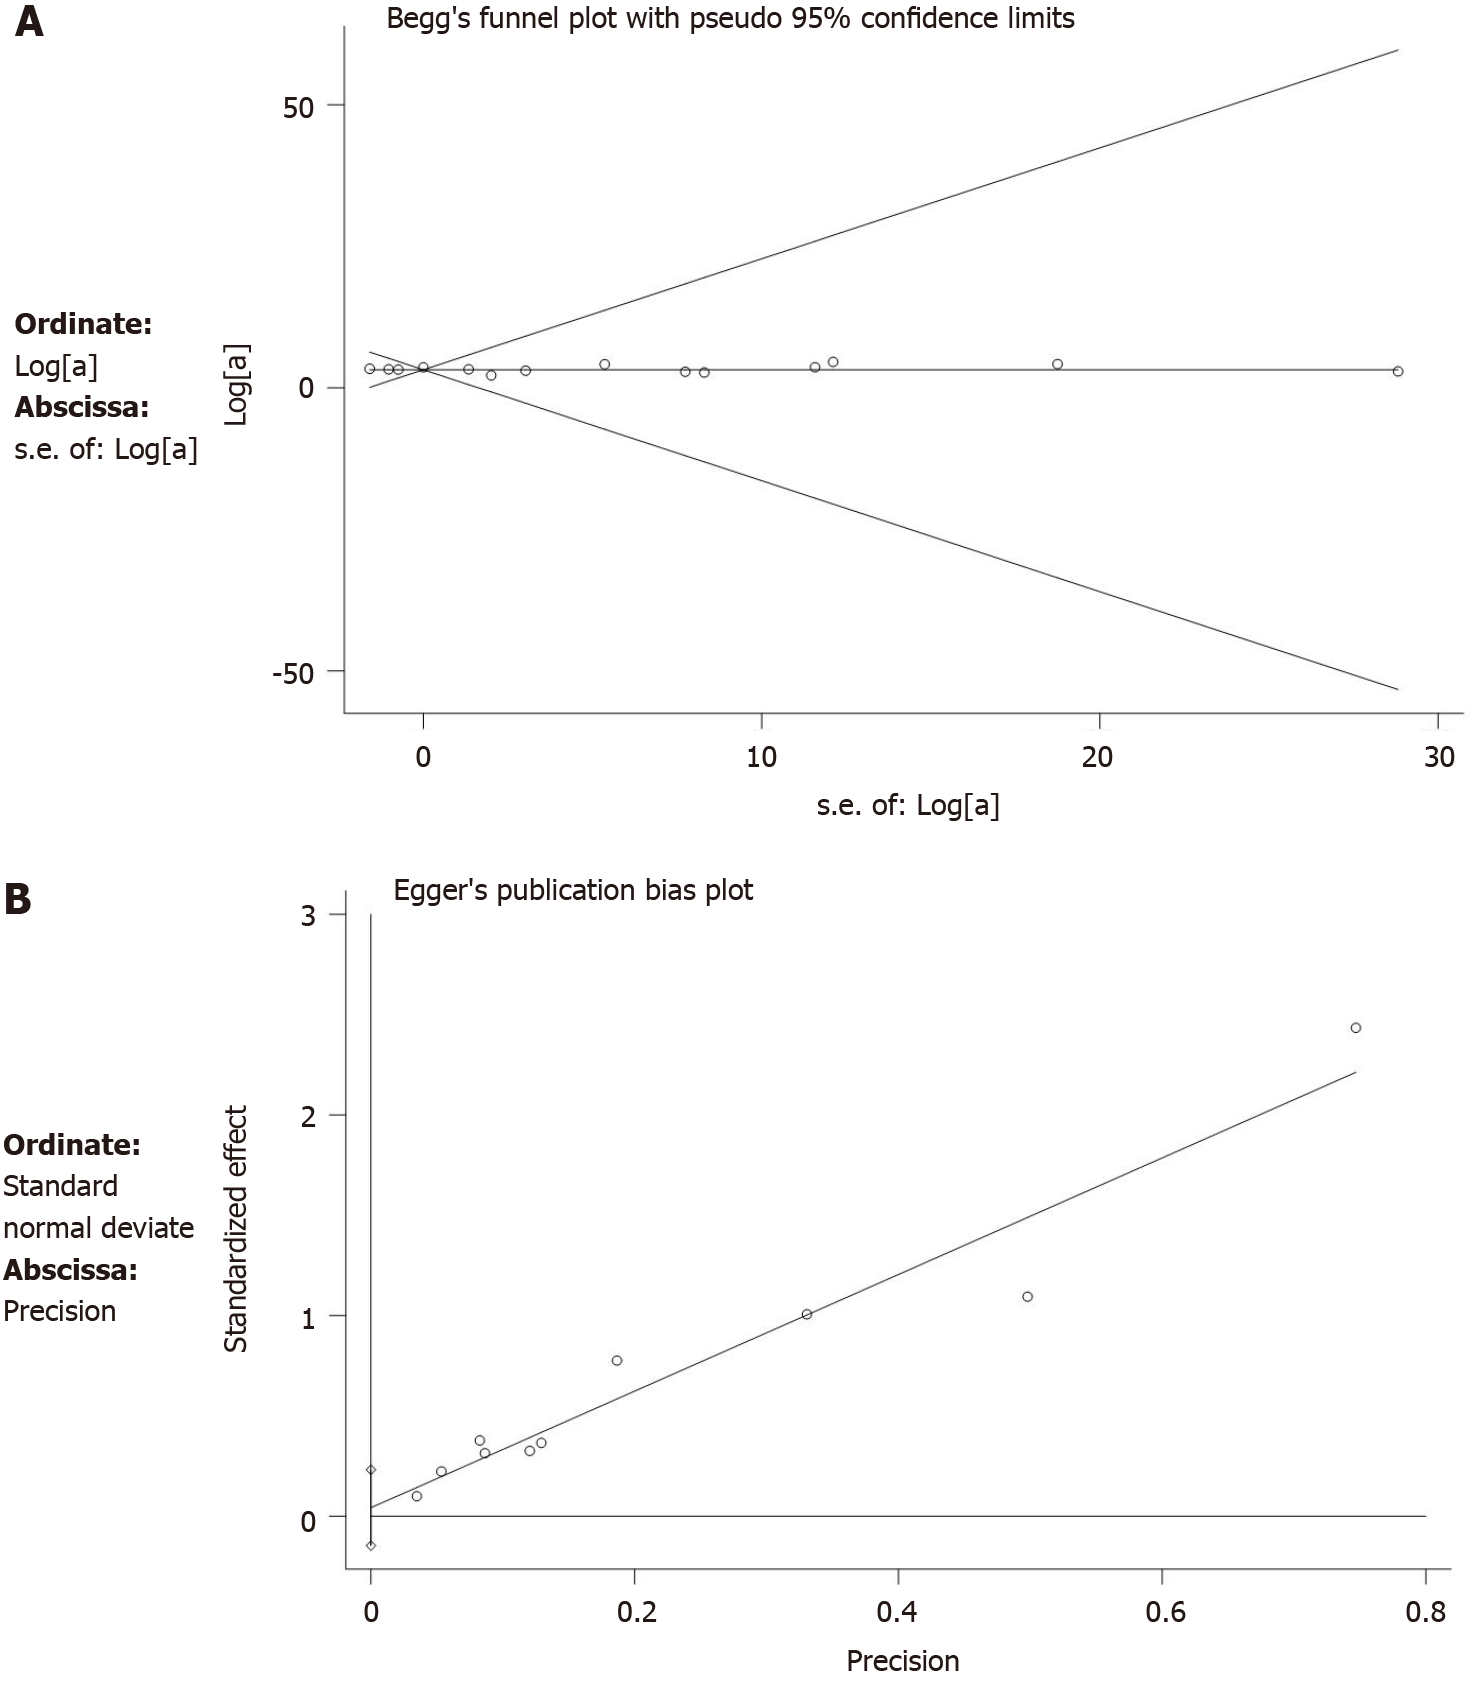
Figure 10 Publication bias.
A: Results of Begg’s funnel plot; B: Egger’s publication bias plot for assessing publication bias of local control.
- Citation: Liu B, Ge L, Wang J, Chen YQ, Ma SX, Ma PL, Zhang YQ, Yang KH, Cai H. Efficacy and safety of intraoperative radiotherapy in rectal cancer: A systematic review and meta-analysis. World J Gastrointest Oncol 2021; 13(1): 69-86
- URL: https://www.wjgnet.com/1948-5204/full/v13/i1/69.htm
- DOI: https://dx.doi.org/10.4251/wjgo.v13.i1.69


