Copyright
©The Author(s) 2020.
World J Gastrointest Oncol. Aug 15, 2020; 12(8): 877-892
Published online Aug 15, 2020. doi: 10.4251/wjgo.v12.i8.877
Published online Aug 15, 2020. doi: 10.4251/wjgo.v12.i8.877
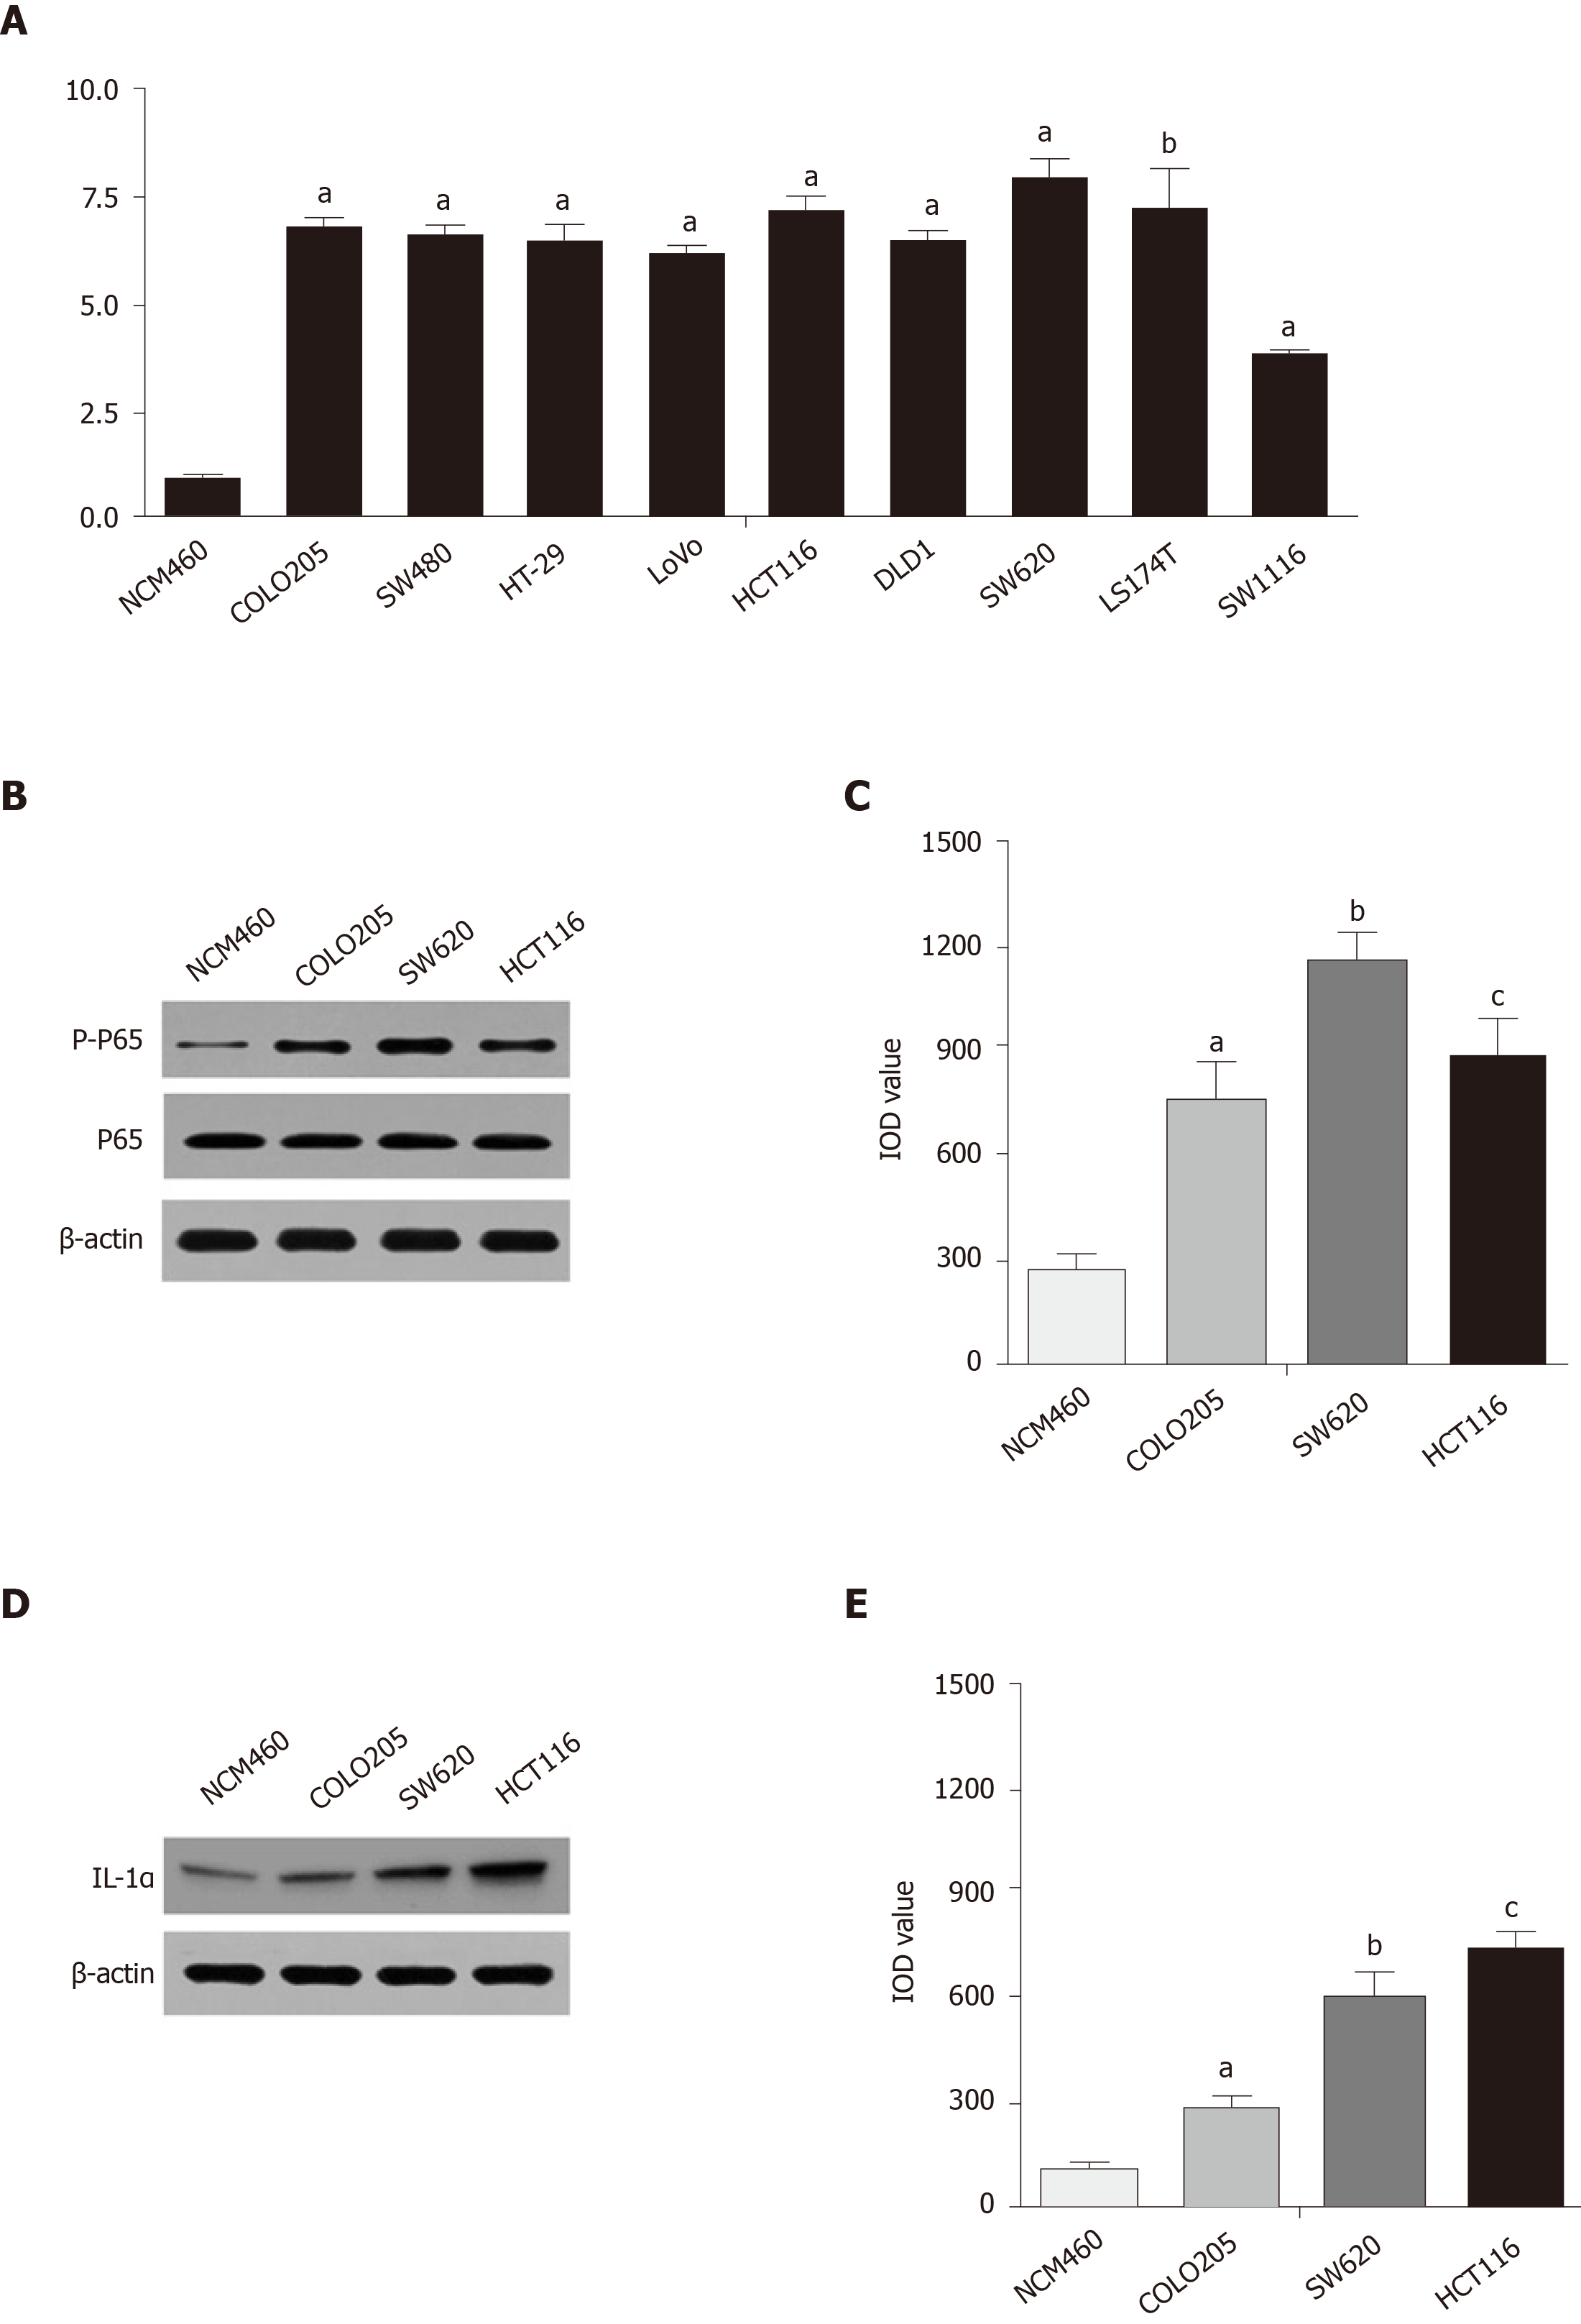
Figure 1 Expression of phosphorylated nuclear factor kappa-B in Kras mutant colon carcinoma cell lines.
A: Reverse transcription-polymerase chain reaction assays showed that the expression of the Kras gene in the COLO205, SW480, HT-29, LoVo, HCT116, DLD1, SW620, LS174T, and SW1116 cell lines was high. The expression level of Kras in the COLO205 cell line was significantly higher than that in NCM460 (aP < 0.0001, bP = 0.0001 vs NCM460; comparison of multiple groups: P < 0.0001); B and C: Western blot assays showed that the expression levels of phosphorylated nuclear factor kappa-B (NF-κB) in the COLO205, SW620, and HCT116 cell lines were increased compared with that of NCM460 (COLO205 vs NCM460, aP = 0.0467; SW620 vs NCM460, bP = 0.0050; HCT116 vs NCM460, cP = 0.0177; comparison of multiple groups: P = 0.0081); D and E: Western blot assays showed that the expression of interleukin-1α was higher in the COLO205, SW620, and HCT116 cell lines than the NCM460 cell line (COLO205 vs NCM460, aP = 0.0427; SW620 vs NCM460, bP = 0.0100; HCT116 vs NCM460, cP = 0.0024; comparison of multiple groups: P = 0.0019).
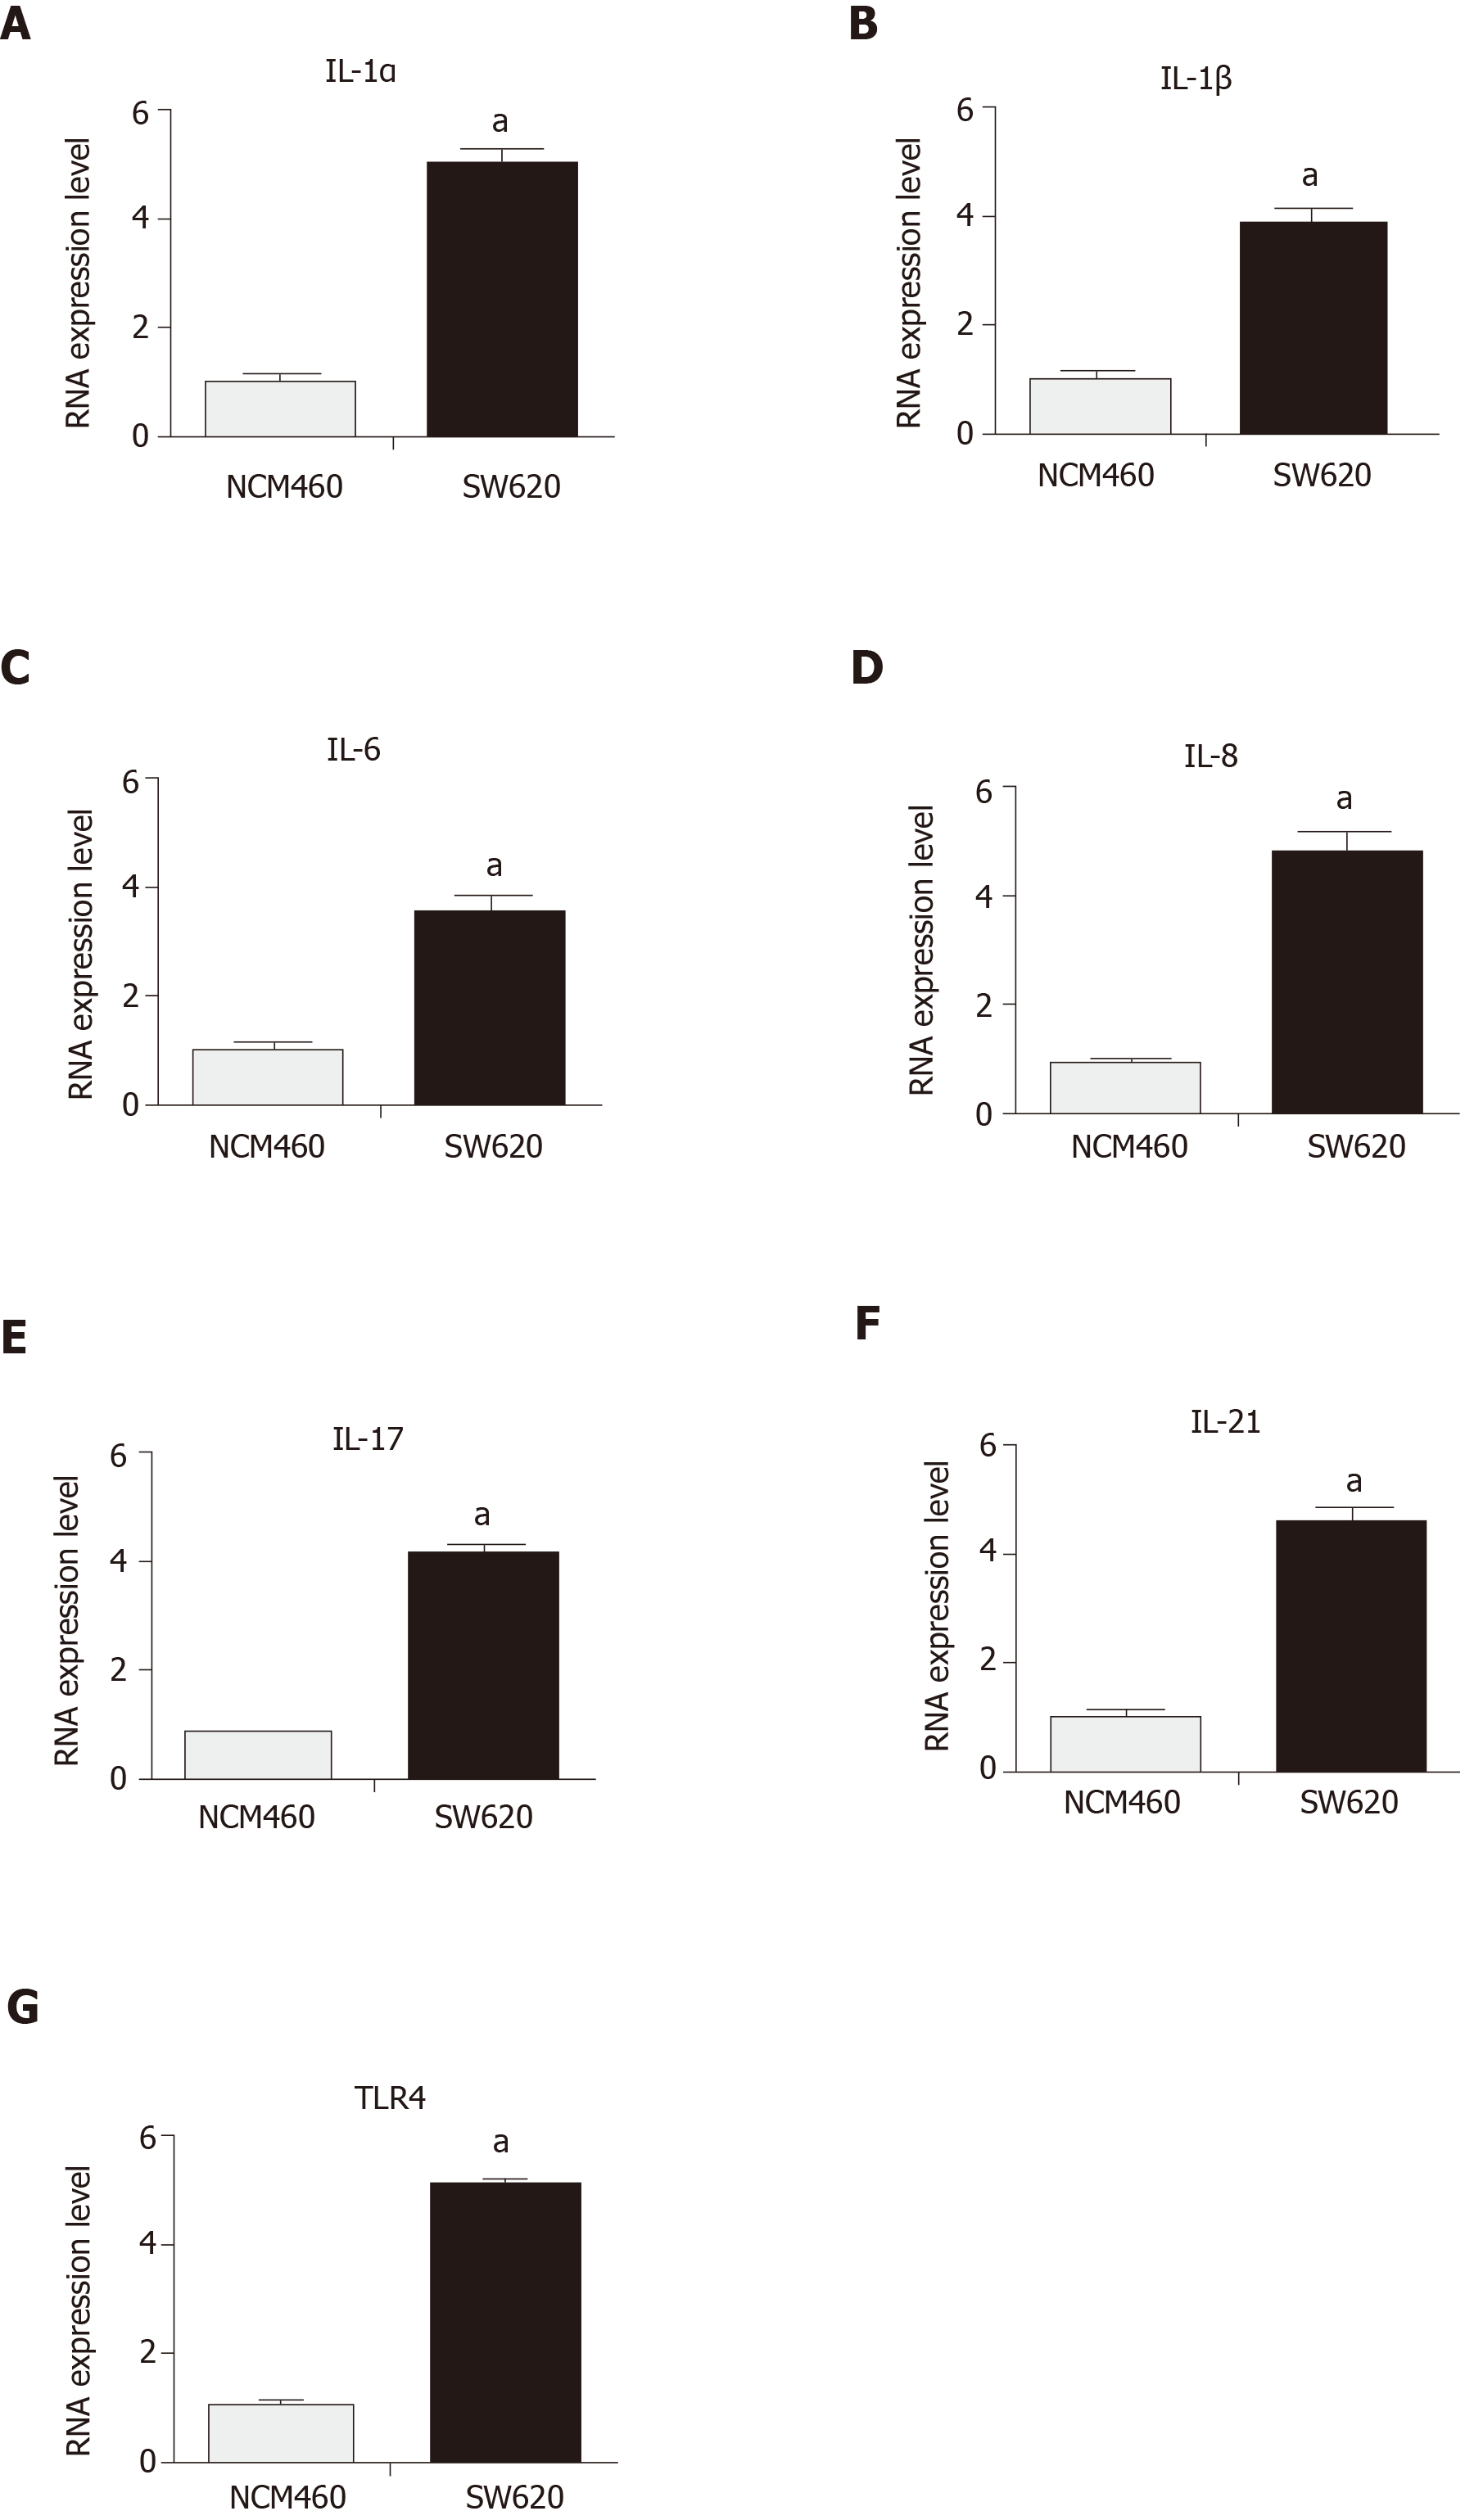
Figure 2 Expression of interleukins in the activated nuclear factor kappa-B pathway in SW620 cells.
A and B: Reverse transcription-polymerase chain reaction (RT-PCR) assay showed that the expression of interleukin (IL)-1α and IL-1β was significantly higher in SW620 cells than in NCM460 cells (IL-1α: SW620 vs NCM460, aP = 0.0003; IL-1β: SW620 vs NCM460, aP = 0.0001); C-G: RT-PCR assay showed that the expression of IL-6, IL-8, IL-17, IL-21, and TLR4 was significantly higher in SW620 cells than in NCM460 cells (IL-6: SW620 vs NCM460, aP = 0.0005; IL-8: SW620 vs NCM460, aP = 0.0007; IL-17: SW620 vs NCM460, aP < 0.0001; IL-21: SW620 vs NCM460, aP < 0.0001; TLR4-6 : SW620 vs NCM460, aP < 0.0001).
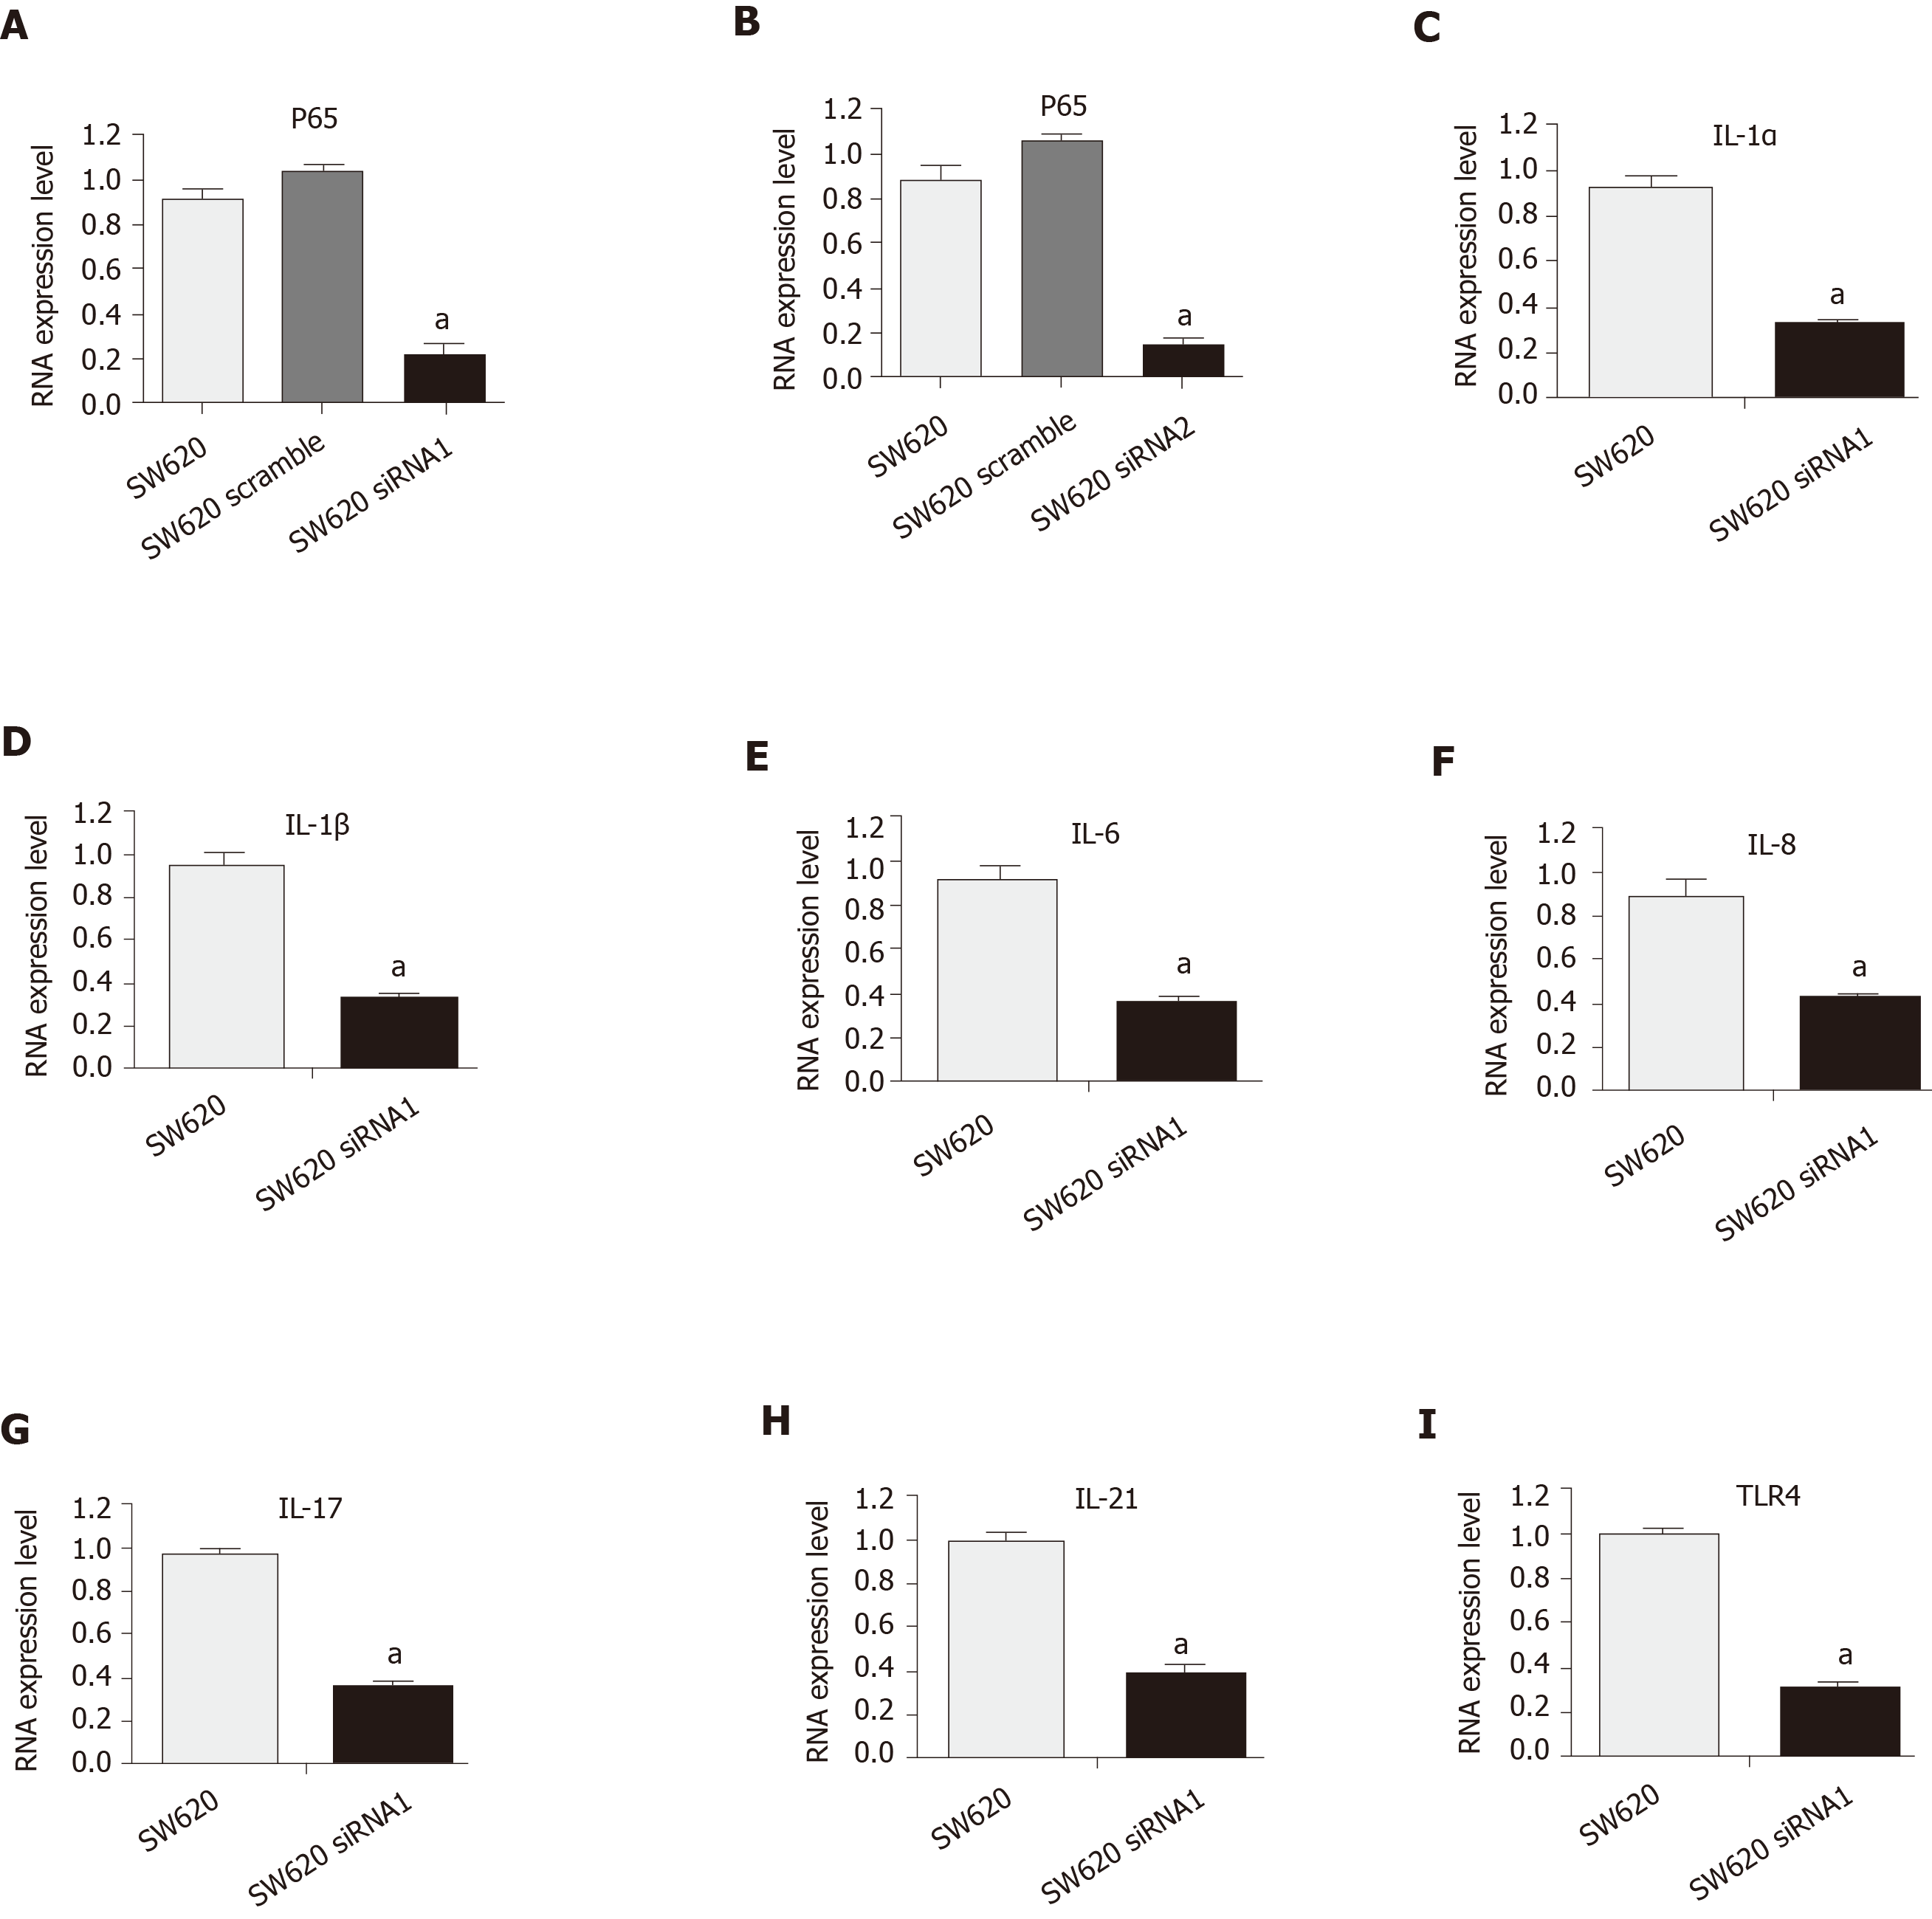
Figure 3 Expression of interleukin-1α, interleukin-1β, and other interleukins in the siRNA-P65 SW620 cell line.
A: Reverse transcription-polymerase chain reaction (RT-PCR) assay showed the nuclear factor kappa-B (NF-Κb) pathway was downregulated in the SW620 cell line after siRNA1 interference at 24 h (SW620 siRNA1 vs SW620, aP = 0.0003); B RT-PCR assay showed the NF-κB pathway was downregulated in the SW620 cell line after siRNA2 treatment at 24 h (SW620 siRNA2 vs SW620, aP = 0.0001); C: RT-PCR assay showed that the expression of IL-1α was significantly decreased in the SW620 siNF-κB cell line compared with the SW620 non-siNF-κB cell line (SW620 siNF-κB1 vs SW620, aP = 0.0002); D: RT-PCR assay showed that the expression of IL-1β was significantly decreased in the SW620 siNF-κB cell line compared with the SW620 non-siNF-κB cell line (SW620 siNF-κB1 vs SW620, aP = 0.0012); E: RT-PCR assay showed that the expression of IL-6 was significantly decreased in the SW620 siNF-κB cell line compared with the SW620 non-siNF-κB cell line (SW620 siNF-κB1 vs SW620, aP = 0.0012); F: RT-PCR assay showed that the expression of IL-8 was significantly decreased in the SW620 siNF-κB cell line compared with the SW620 non-siNF-κB cell line (SW620 siNF-κB1 vs SW620, aP = 0.0033); G: RT-PCR assay showed that the expression of IL-17 was significantly decreased in the SW620 siNF-κB cell line compared with the SW620 non-siNF-κB cell line (SW620 siNF-κB1 vs SW620, aP < 0.0001); H: RT-PCR assay showed that the expression of IL-21 was significantly decreased in the SW620 siNF-κB cell line compared with the SW620 non-siNF-κB cell line (SW620 siNF-κB1 vs SW620, aP = 0.0004); I: RT-PCR assay showed that the expression of TLR4 was significantly decreased in the SW620 siNF-κB cell line compared with the SW620 non-siNF-κB cell line (SW620 siNF-κB1 vs SW620, aP < 0.0001).
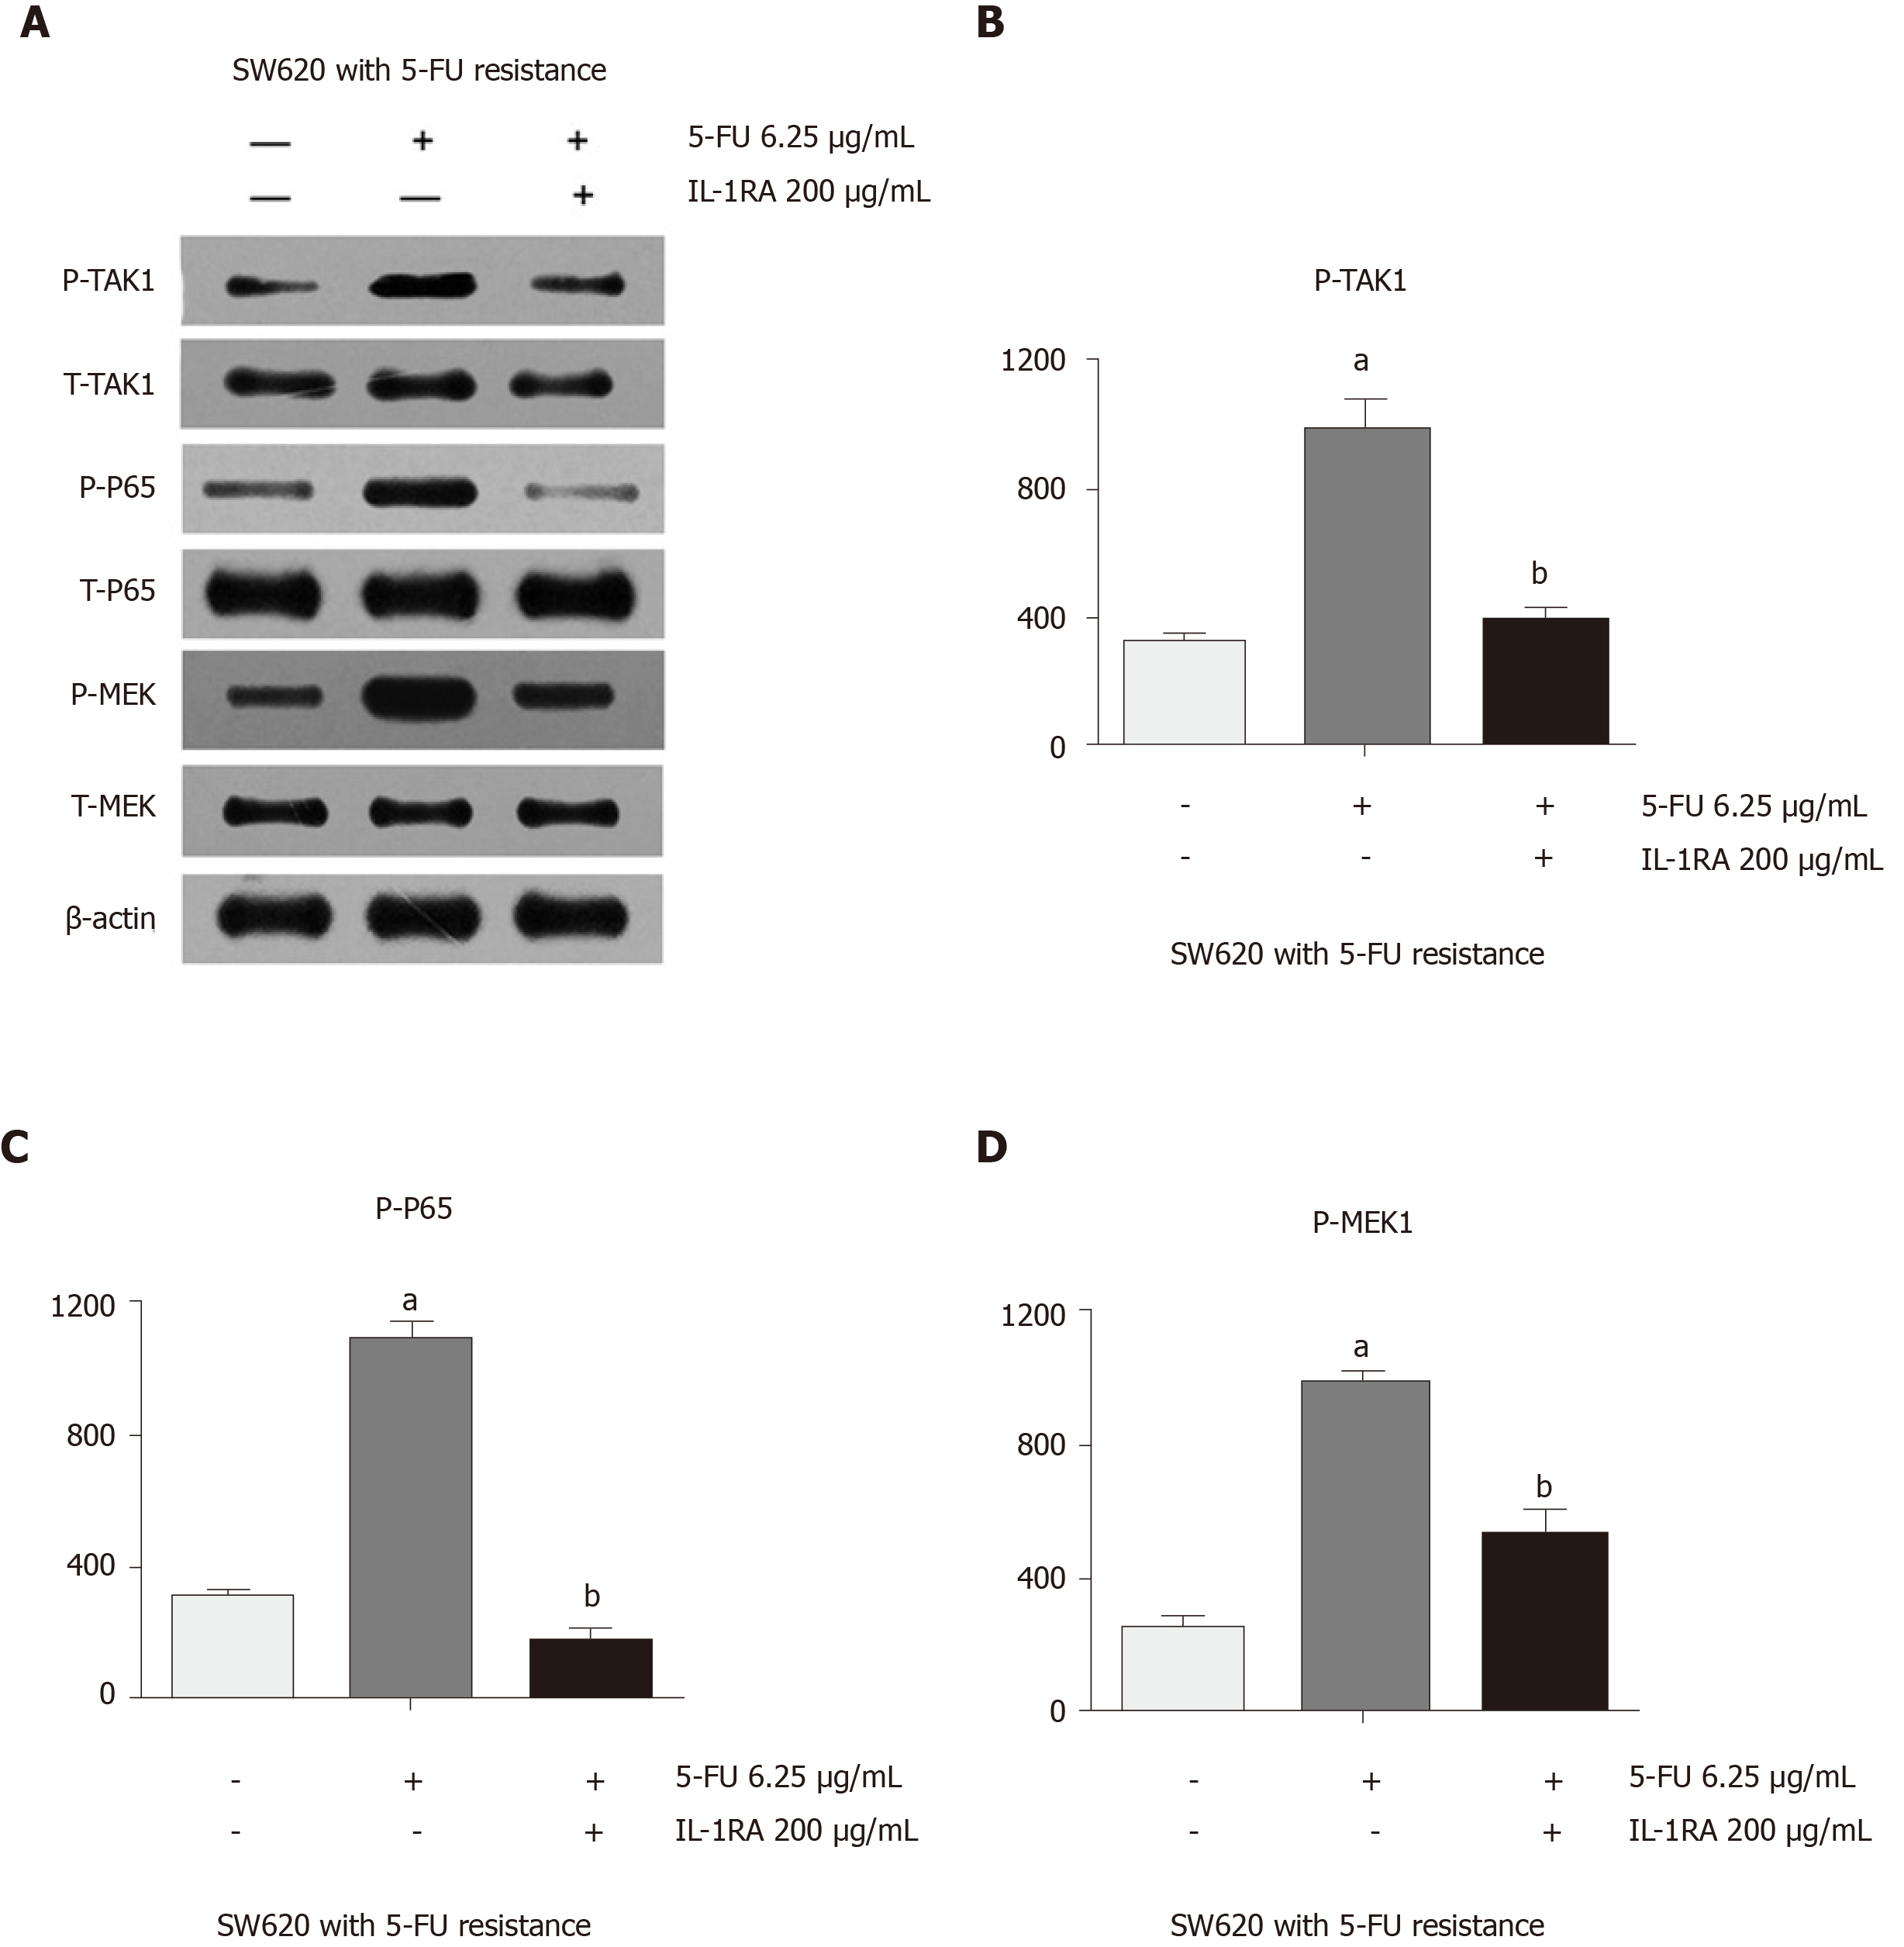
Figure 4 Interleukin-1 RA could counteract the abnormally high expression of P-TAK1, P-P65, and P-MEK caused by fluorouracil in the SW620 cell line.
A: Western blot assay showed that the abnormally high expression of P-TAK1, P-P65 and P-MEK caused by fluorouracil (5-FU) was decreased by interleukin (IL)-1 RA treatment in the SW620 cell line; B: The abnormally high expression of P-TAK1 in the SW620 cell line caused by 5-FU was significantly decreased in the 5-FU and IL-1 RA group (SW620: 5-FU vs the control, aP = 0.0199; 5-FU and IL-1RA vs 5-FU, bP = 0.0269); C: The abnormally high expression of P-P65 in the SW620 cell line caused by 5-FU was significantly decreased in the 5-FU and IL-1 RA group (SW620: 5-FU vs the control, aP = 0.0048; IL-1RA vs 5-FU, bP = 0.0040); D: The abnormally high expression of P-MEK in the SW620 cell line caused by 5-FU was significantly decreased in the 5-FU and IL-1 RA group (SW620: 5-FU vs the control, aP = 0.0019; IL-1RA vs 5-FU, bP = 0.0201).
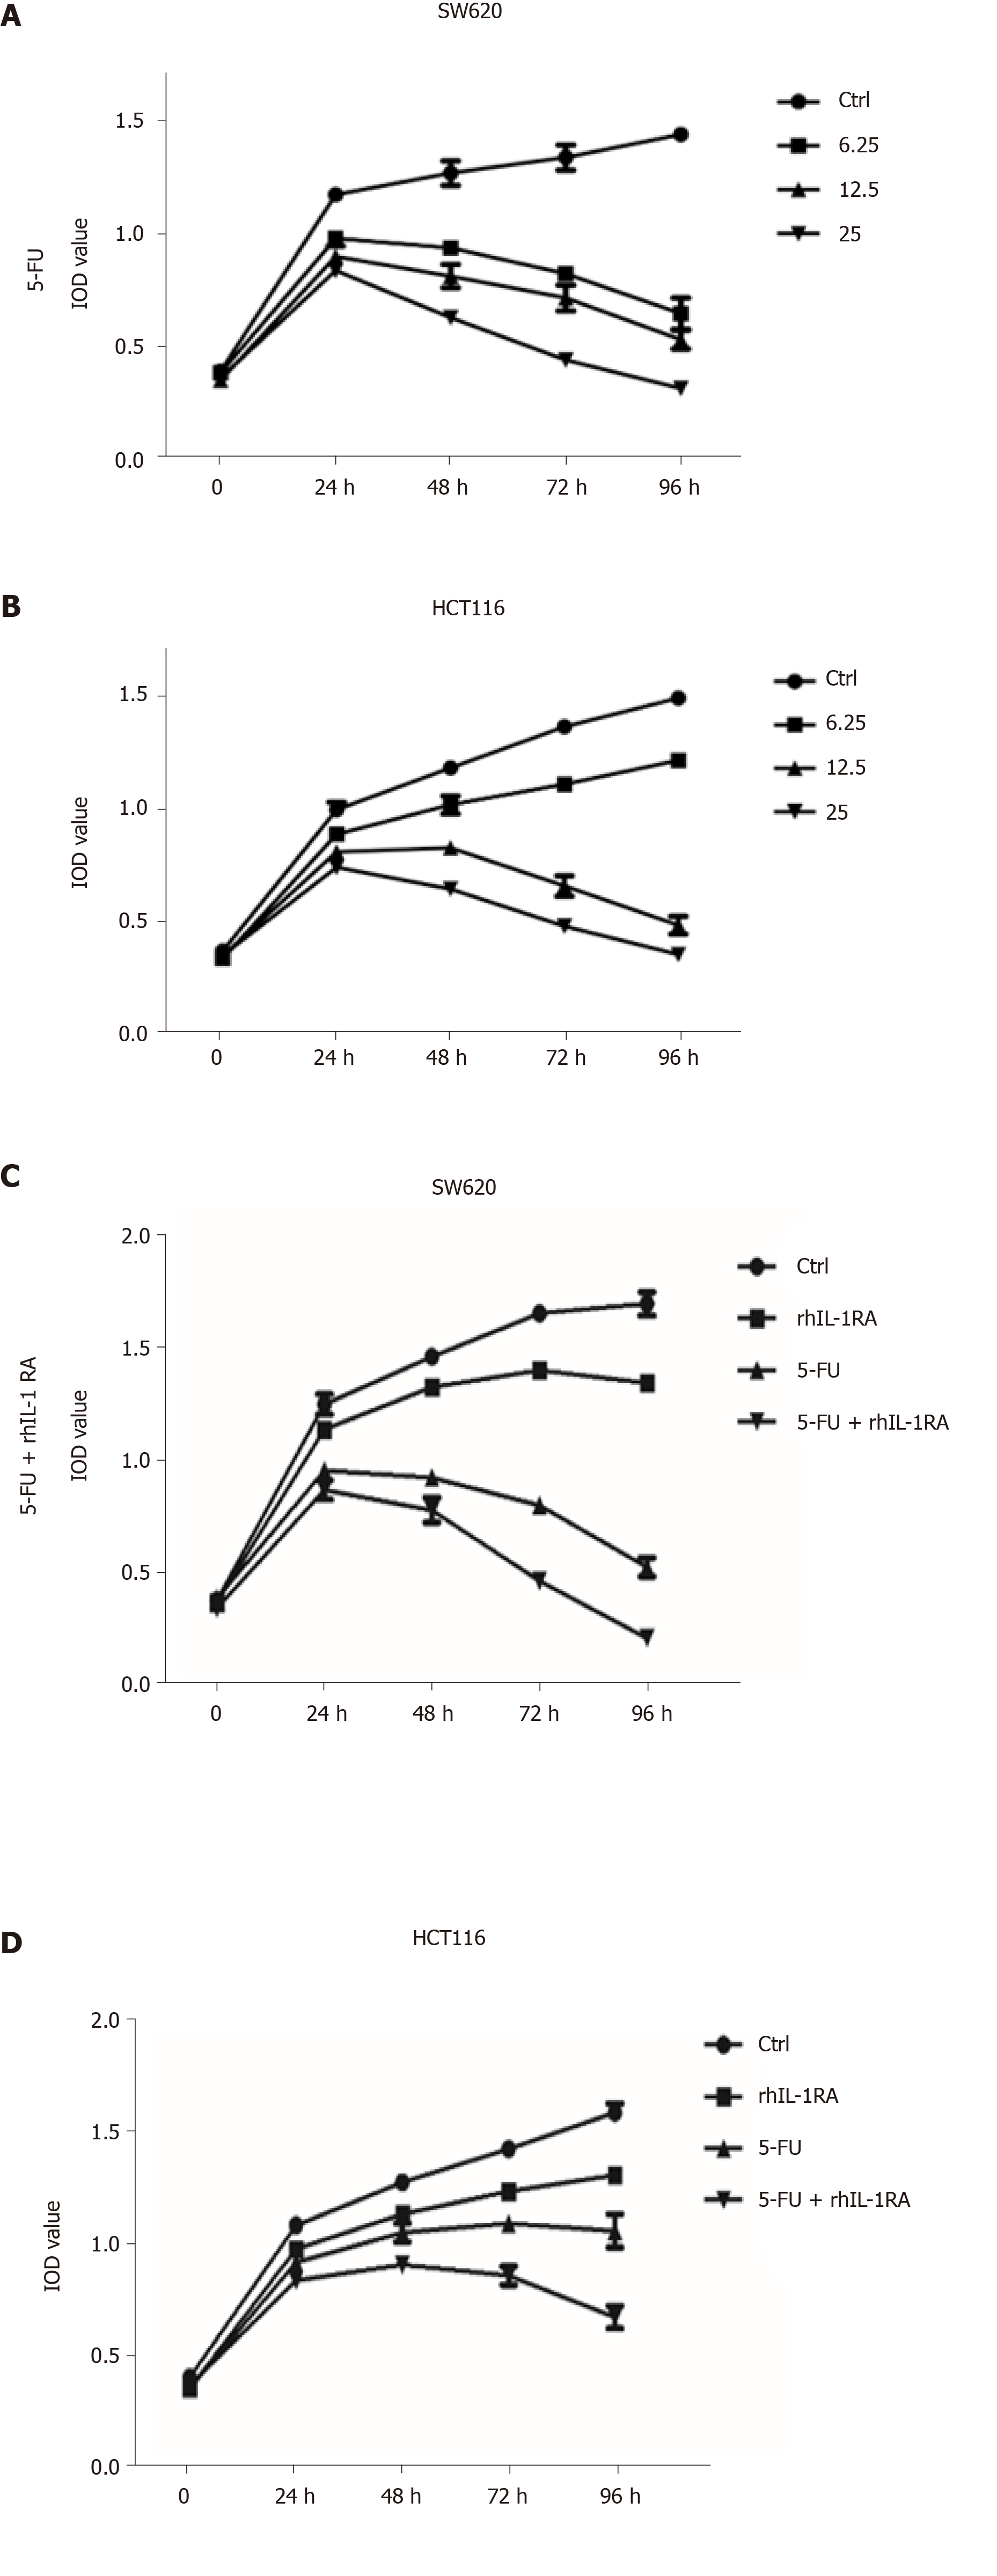
Figure 5 Changes in the growth curves of the SW620 and HCT116 cell lines treated with interleukin-1RA and/or fluorouracil.
A and B: MTT assays showed that the cell growth curves of the SW620 and HCT116 colon cancer cell lines treated with fluorouracil (5-FU) at concentrations of 6.25, 12.5, and 25 mg/mL exhibited a downward trend (SW620: 5-FU at 6.25 µg/mL for 96 h vs Ctrl, P < 0.0001; HCT116: 5-FU at 6.25 µg/mL for 96 h vs Ctrl, P < 0.0001); C: MTT assays showed that the cell growth curve of the SW620 colon cancer cell lines treated with interleukin (IL)-1RA was significantly different compared with the Ctrl (SW620: IL-1RA at 200 µg/mL for 96 h vs Ctrl, P = 0.0005). The cell growth curve of the SW620 colon cancer cell lines treated with IL-1RA combined with 5-FU significantly decreased compared to that in the 5-FU group (SW620: 5-FU at 12.5 µg/mL and IL-1RA at 200 µg/mL for 96 h vs 5-FU at 12.5 µg/mL, P = 0.0003); D: MTT assays showed that the cell growth curve of the HCT116 colon cancer cell lines treated with IL-1RA was significantly different compared with that of the Ctrl (HCT116: IL-1RA at 200 µg/mL for 96 h vs Ctrl, P = 0.0004). The cell growth curve of the SW620 colon cancer cell lines treated with IL-1RA combined with 5-FU significantly decreased compared to that in the 5-FU group (HCT116: 5-FU at 12.5 µg/mL and IL-1RA at 200 µg/mL for 96 h vs 5-FU at 12.5 µg/mL, P = 0.0027).
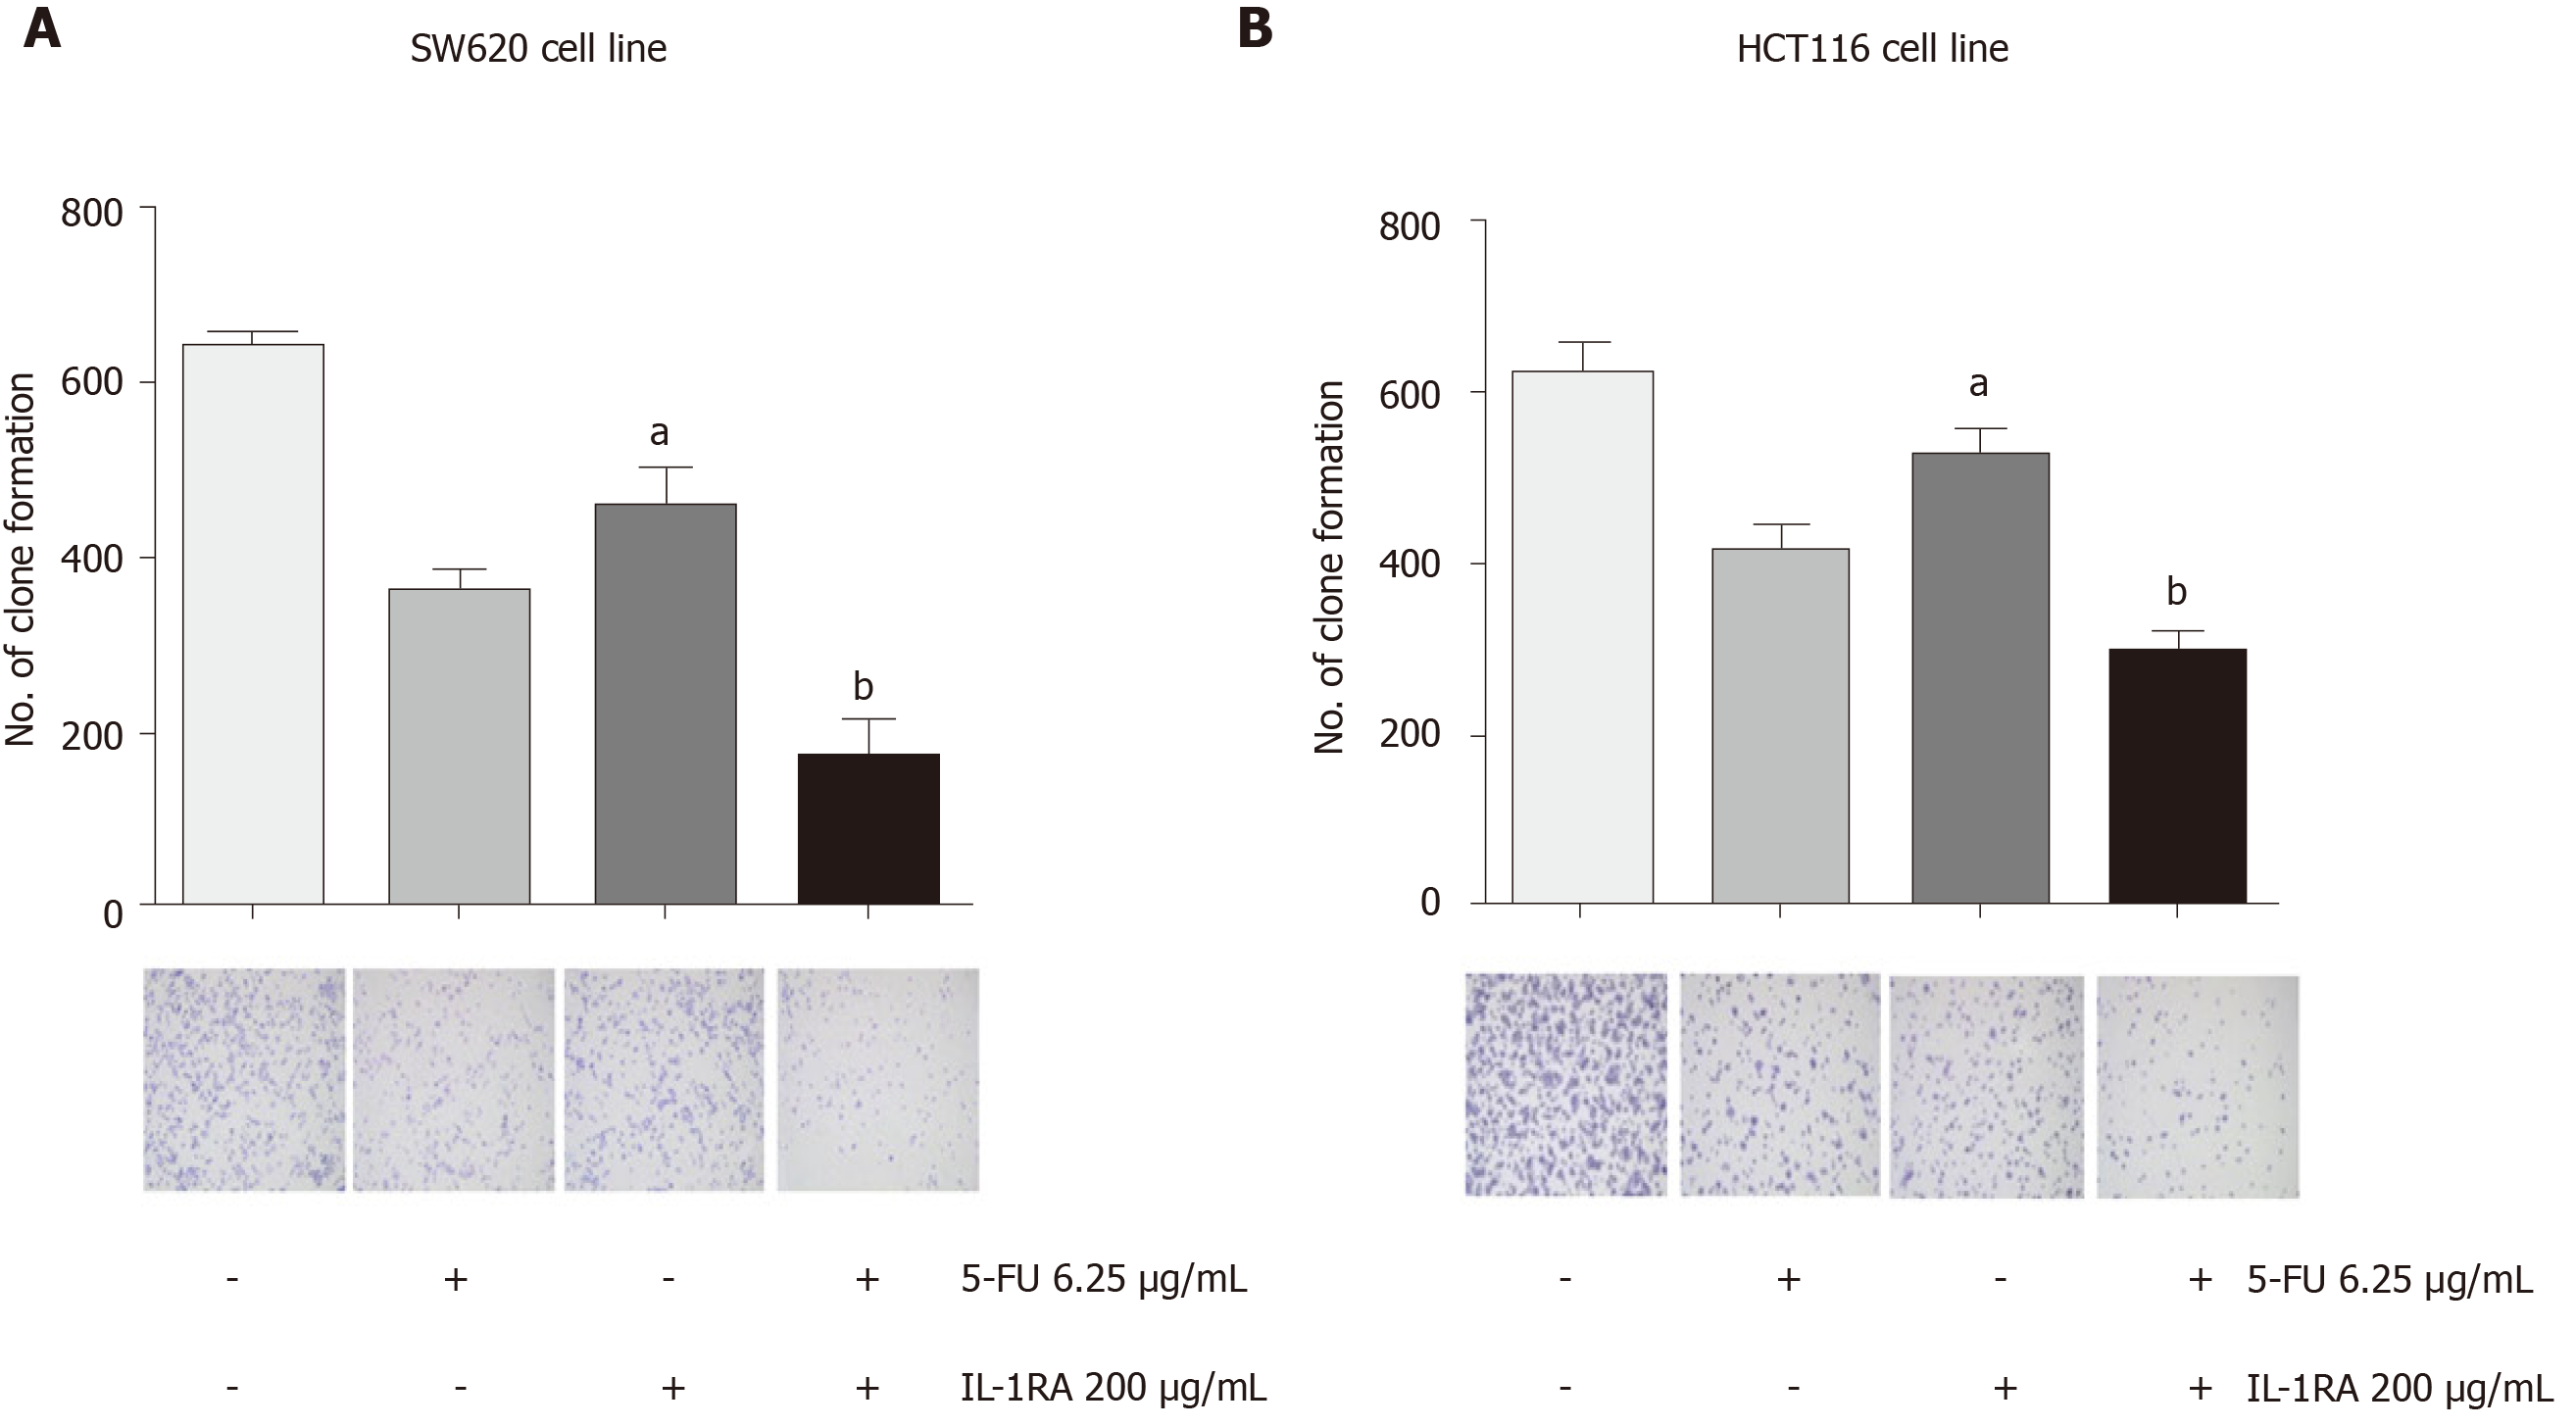
Figure 6 Changes in colony formation in the SW620 and HCT116 cell lines treated with interleukin-1RA and/or fluorouracil.
A: Colony formation assay showed that interleukin (IL)-1RA single drug treatment decreased the colony formation of SW620 cells, while this parameter significantly decreased in the SW620 cells treated with 6.25 mg/mL fluorouracil (5-FU) combined with 200 mg/mLIL-1RA compared with the untreated cells (5-FU vs Ctrl, P = 0.0027; IL-1RA vs Ctrl, aP = 0.0226; 5-FU and IL-1RA vs IL-1RA, bP = 0.0178; comparison of multiple groups: P = 0.0016); B: Colony formation assay showed that IL-1RA single drug treatment decreased the colony formation of HCT116 cells, while this parameter significantly decreased in the HCT116 cells treated with 6.25 mg/mL 5-FU combined with 200 mg/mLIL-1RA compared with the untreated cells (5-FU vs Ctrl, P = 0.0104; IL-1RA vs Ctrl, aP = 0.0451; 5-FU and IL-1RA vs IL-1RA, bP = 0.0063; comparison of multiple groups: P = 0.0013).
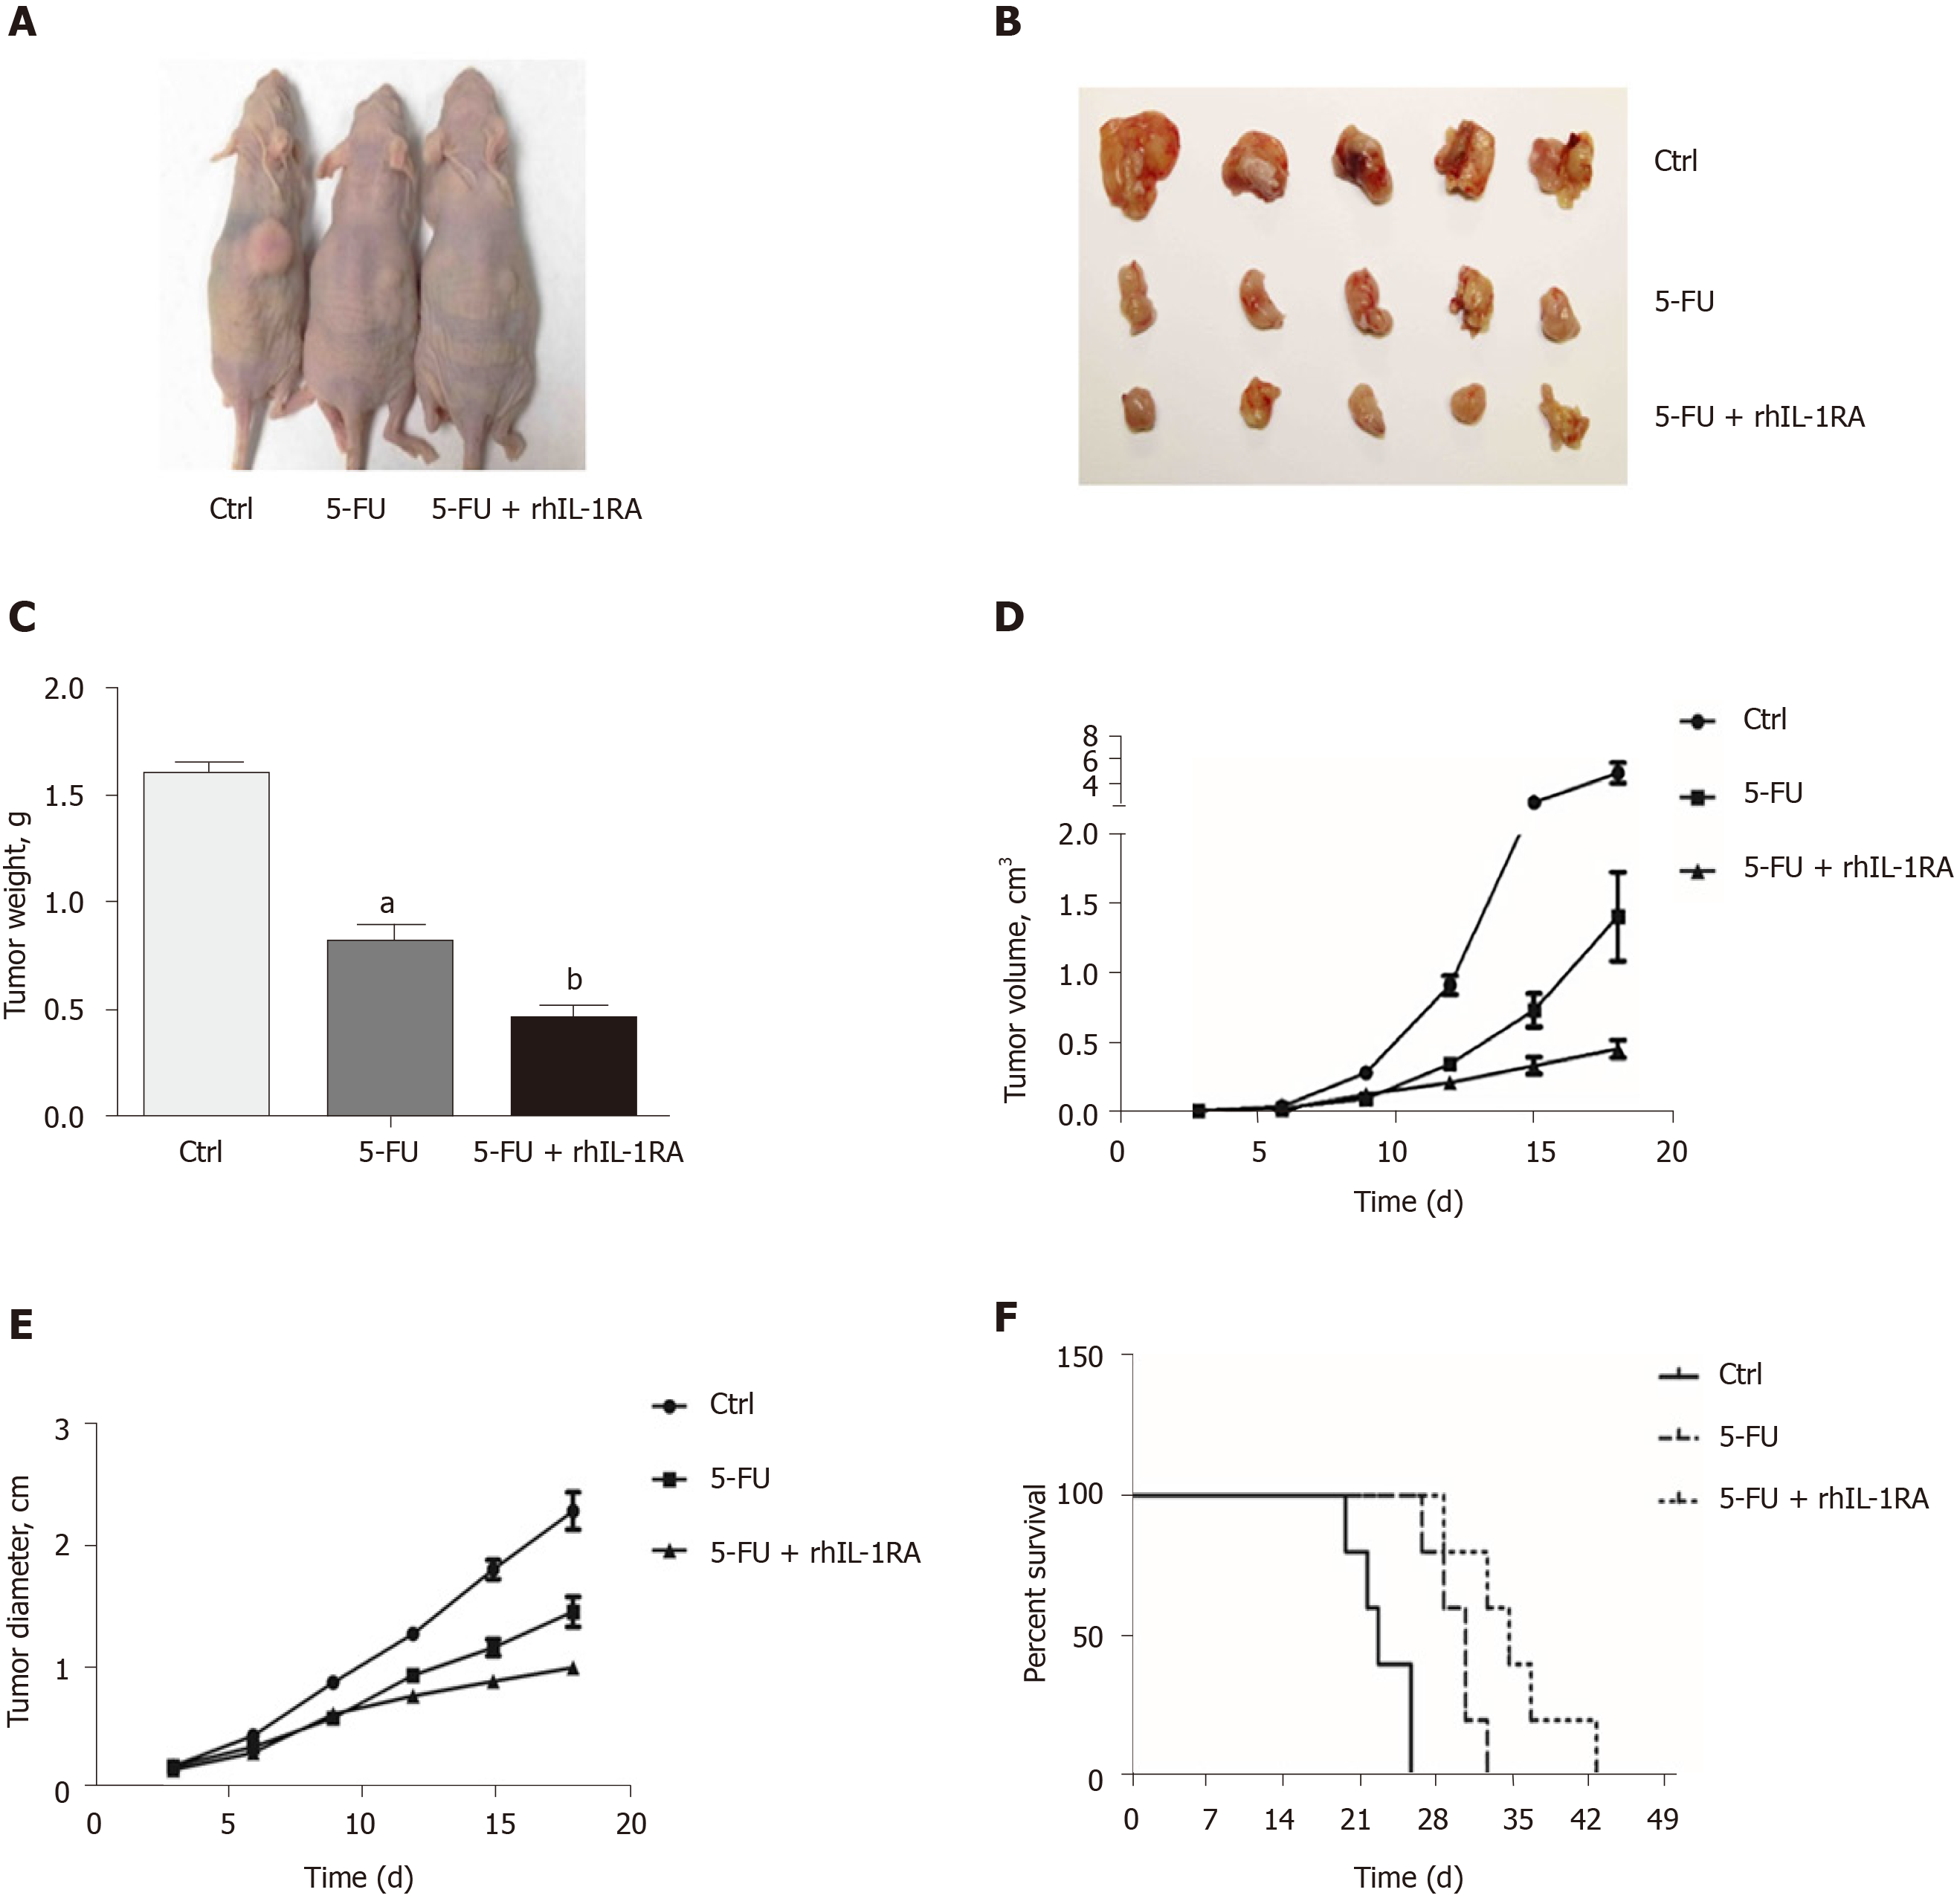
Figure 7 Interleukin-1RA enhances the chemosensitivity to fluorouracil and delays the survival time of tumor-bearing nude mice.
A and B: The tumor size of the control group treated with PBS (100 μL/mouse) for 3 wk significantly increased compared to that in the fluorouracil (5-FU) group and the 5-FU and interleukin (IL)-1RA group (dose per nude mouse: 20 mg/kg of 5-FU; 1.5 mg of IL-1RA); C: The tumor weights (g) of the nude mice in the 5-FU and IL-1RA group were decreased compared with those in the 5-FU group (5-FU group vs Ctrl: aP < 0.0001; 5-FU and IL-1RA group vs 5-FU group: bP = 0.0006; comparison of multiple groups: P < 0.0001); D: The tumor volumes (cm3) of nude mice in the 5-FU and IL-1RA group were decreased compared with those in the 5-FU group and the control group (18th day: 5-FU and IL-1RA group vs Ctrl: P = 0.0007; 5-FU and IL-1RA group vs 5-FU group: P = 0.0192; comparison of multiple groups: P = 0.0001); E: The tumor diameter (cm) of the nude mice in the 5-FU and IL-1RA group was decreased compared with that in the 5-FU group and the control group (18th day: t5-FU and IL-1RA group vs Ctrl: P < 0.0001; 5-FU and IL-1RA group vs 5-FU group: P = 0.0086; comparison of multiple groups: P < 0.0001); F: The survival time (d) of nude mice with xenograft tumors treated with 5-FU and IL-1RA was significantly longer than that of the nude mice with tumors treated with 5-FU (log-rank test, P = 0.0008; 5-FU and IL-1RA group vs 5-FU group: P = 0.0413).
- Citation: Yan Y, Lin HW, Zhuang ZN, Li M, Guo S. Interleukin-1 receptor antagonist enhances chemosensitivity to fluorouracil in treatment of Kras mutant colon cancer. World J Gastrointest Oncol 2020; 12(8): 877-892
- URL: https://www.wjgnet.com/1948-5204/full/v12/i8/877.htm
- DOI: https://dx.doi.org/10.4251/wjgo.v12.i8.877


