Copyright
©The Author(s) 2020.
World J Gastrointest Oncol. Mar 15, 2020; 12(3): 248-266
Published online Mar 15, 2020. doi: 10.4251/wjgo.v12.i3.248
Published online Mar 15, 2020. doi: 10.4251/wjgo.v12.i3.248
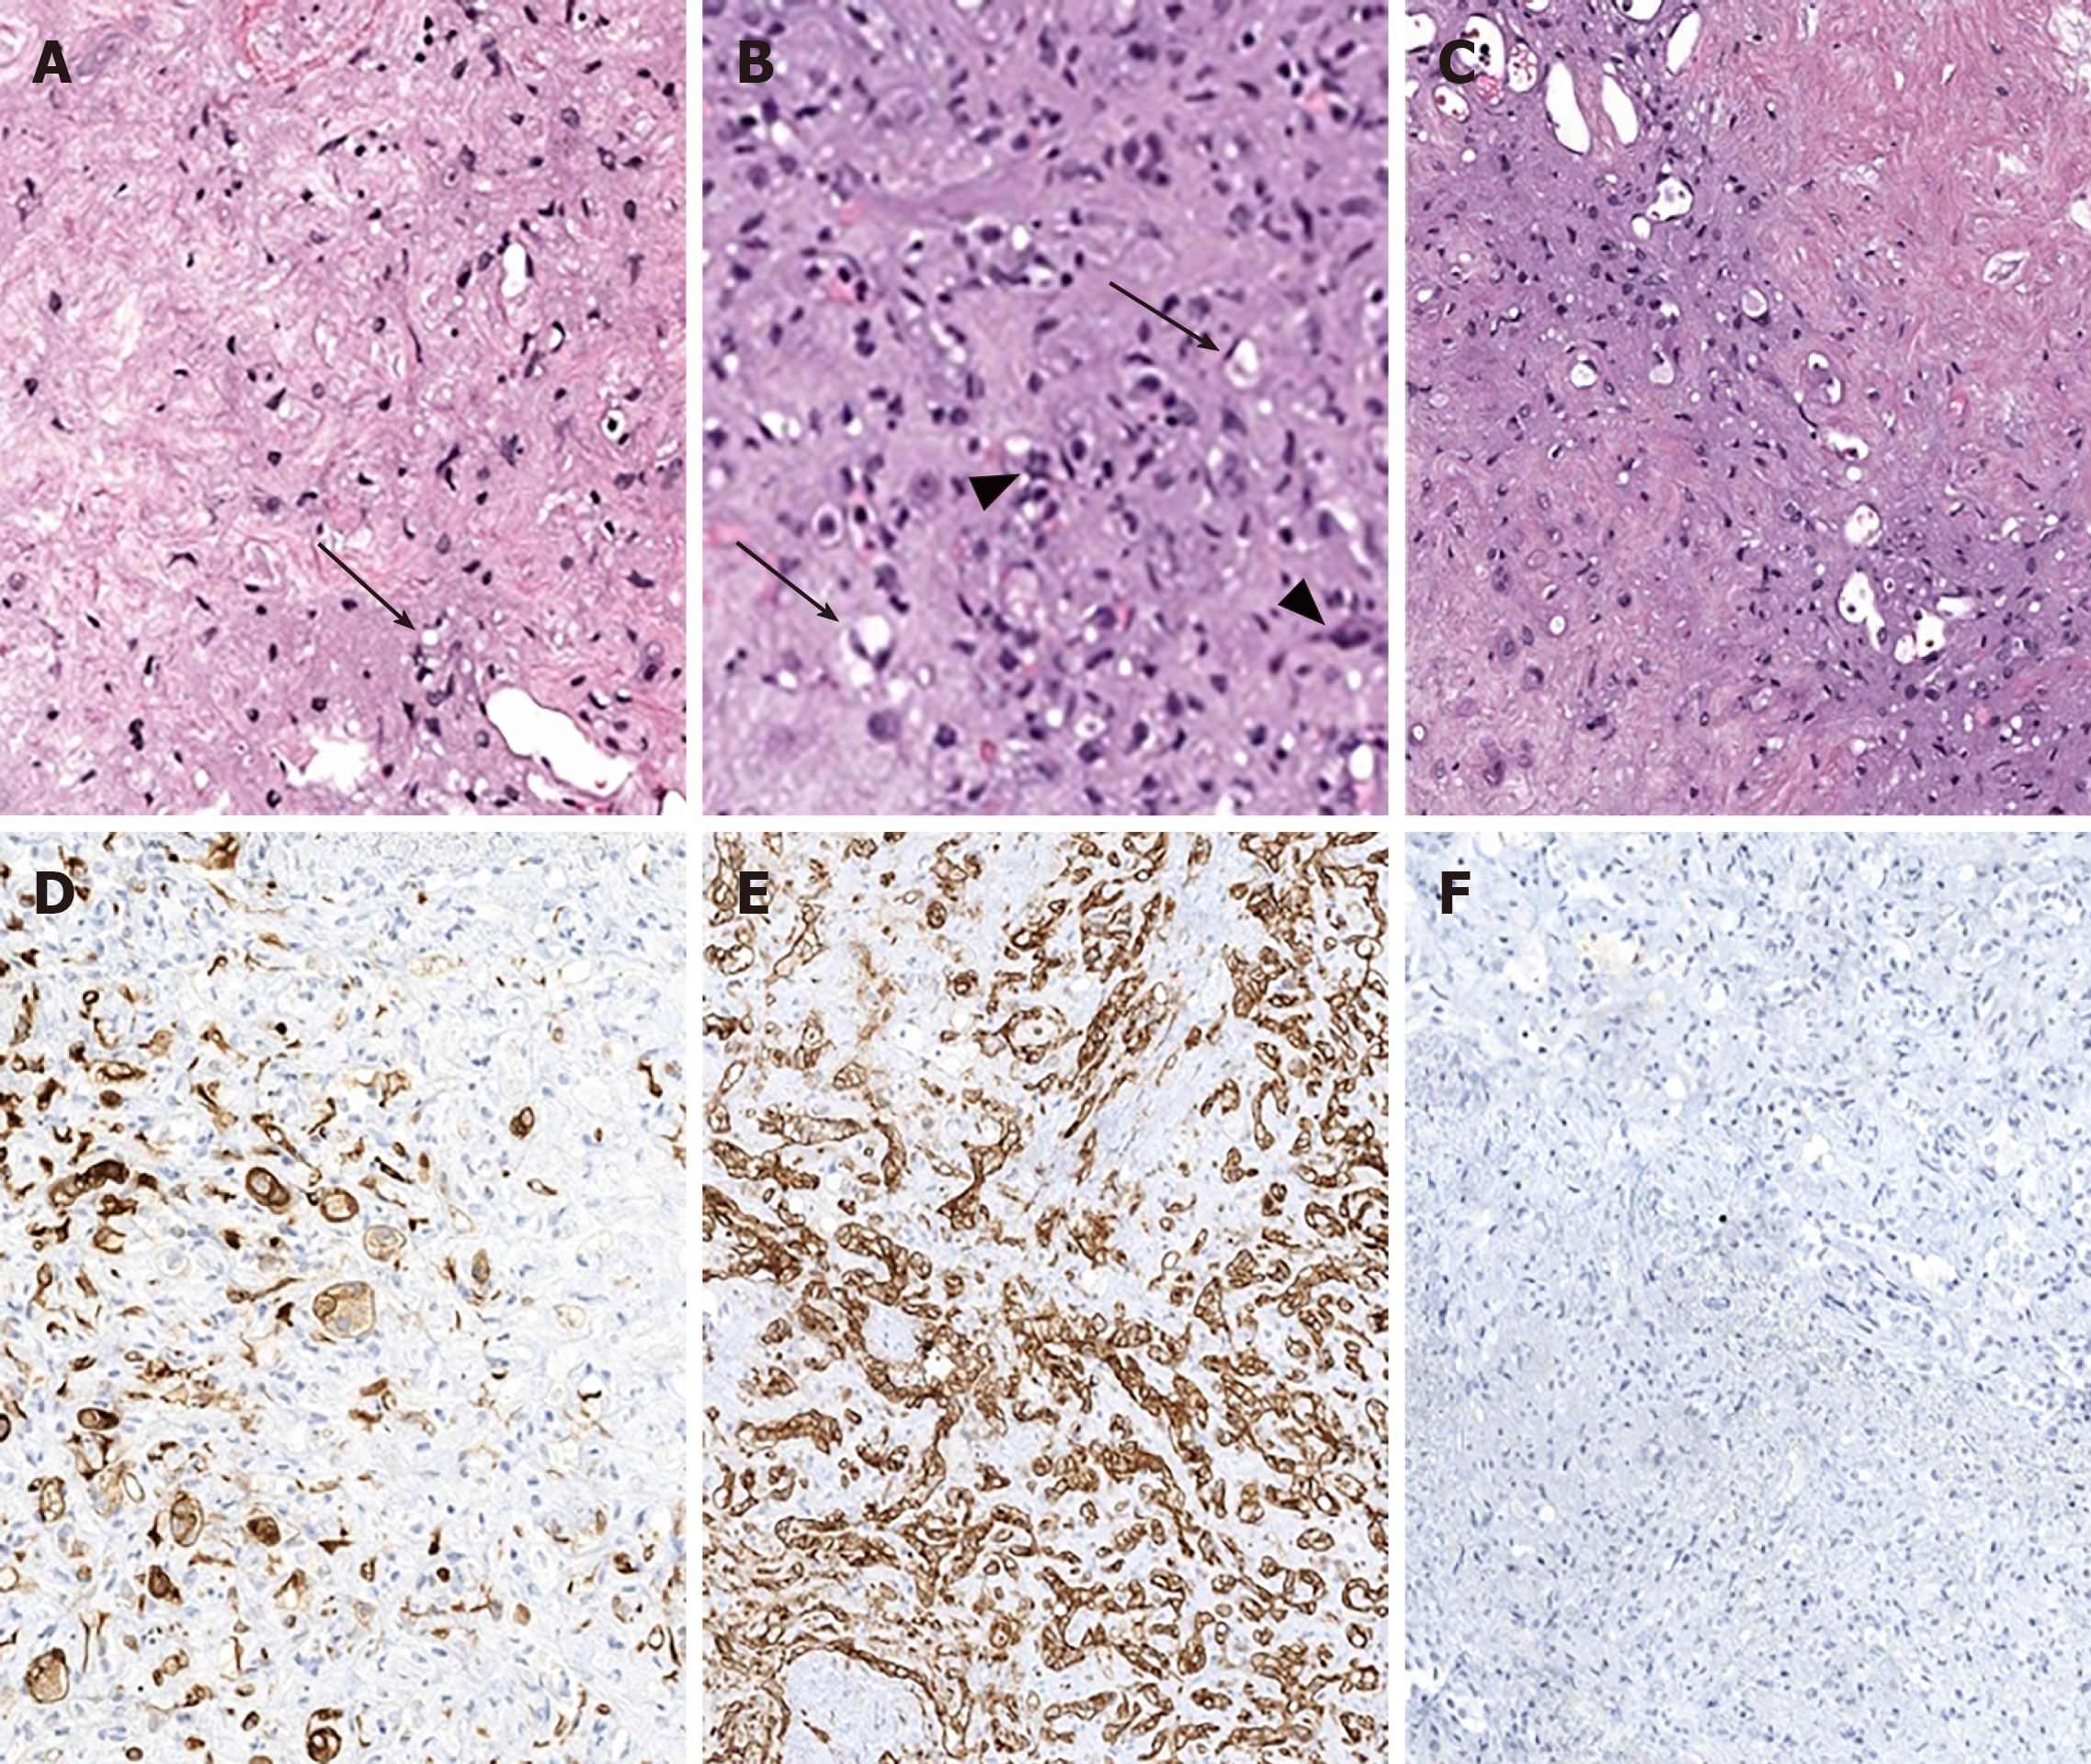
Figure 1 Epithelioid hemangioendothelioma microscopic features.
There is variable cellularity, ranging from stromal-rich areas, mimicking cartilage to highly cellular regions. A: The tumor consists mostly of stellate cells with only rare epithelioid cells containing intracytoplasmic lumen/vacuoles (arrows); B: In more cellular areas, the intracellular lumens (arrows) are more prominent. In addition, the tumor infiltrates sinusoids forming tufted foci (arrowheads); C: Transitional areas between fibrous and moderately cellular areas. To confirm and differentiate epithelioid hemangioendothelioma from tumors with similar histologic features (most commonly cholangiocarcinoma, hepatocellular carcinoma and metastatic signet ring cell carcinoma), immunohistochemical stains are needed; D: Patchy staining for cytokeratin 7, a stain commonly expressed in adenocarcinomas of the upper gastrointestinal tract and pancreaticobiliary tree; E: Diffusely positive for the endothelial marker cluster of differentiation-31 (CD31); F: Negative for the hepatocellular marker, Hepatocyte Paraffin 1 (HepPar1). CD31: Cluster of differentiation-31; HepPar1: Hepatocyte Paraffin 1.
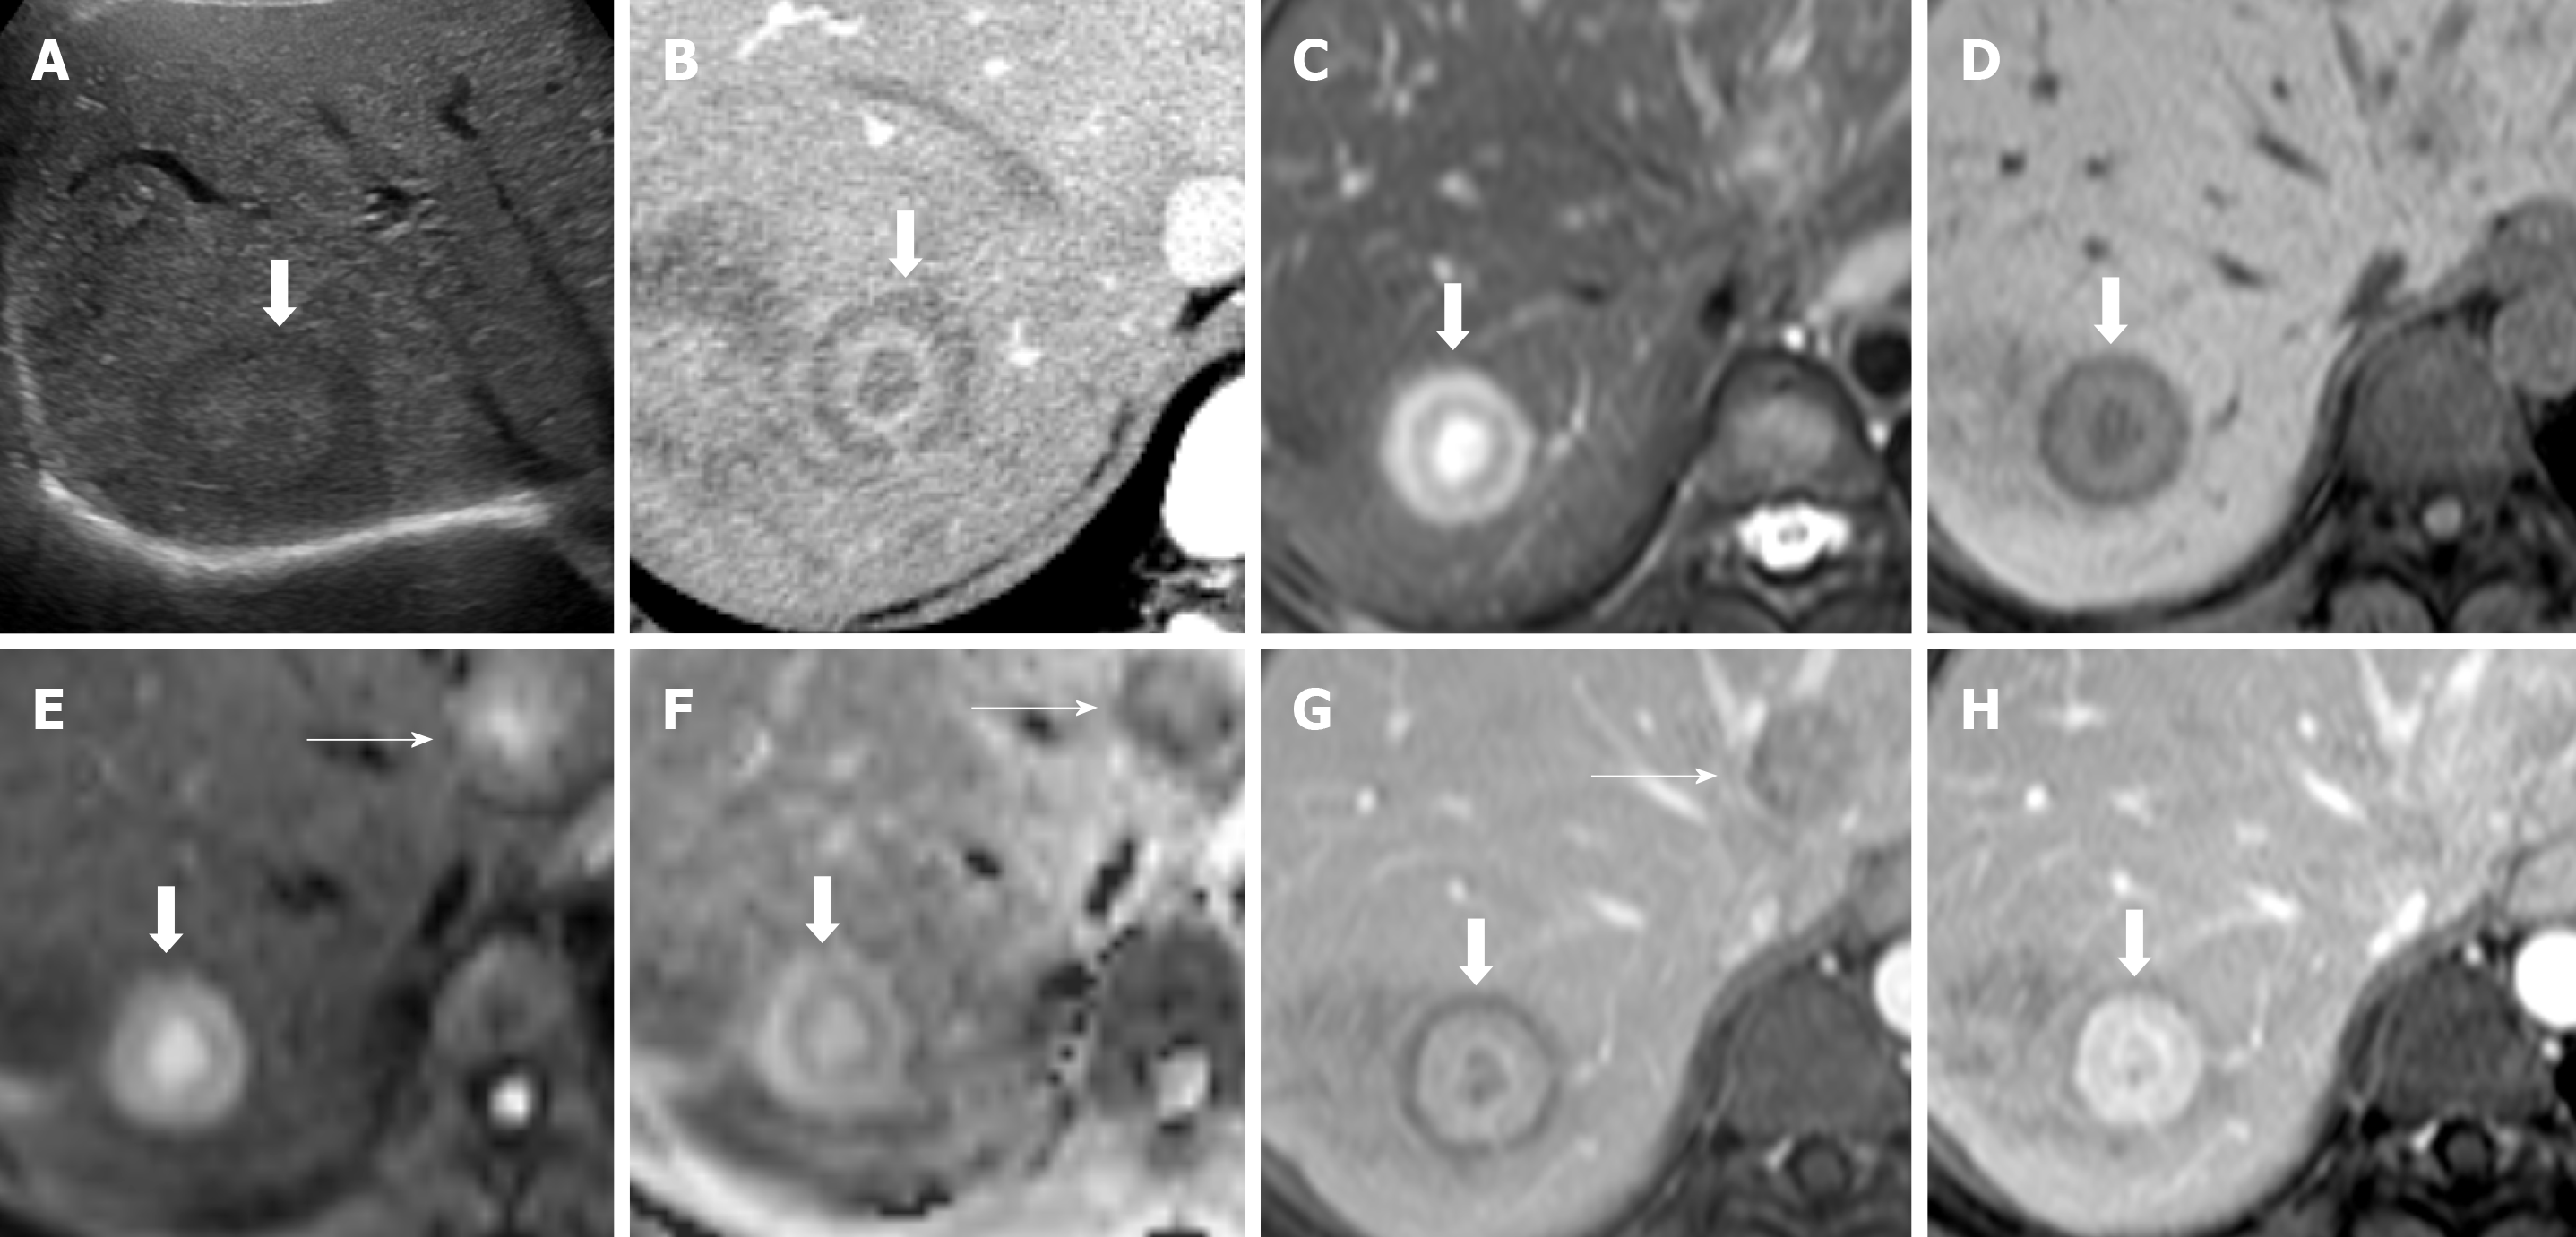
Figure 2 Hepatic hemangioepithelioma imaging feature.
A: Transverse ultrasound of the right upper abdomen reveals a iso to mildly hypoechoic lesion (arrow) in the liver; B: Axial contrast enhanced CT image of the liver; C: Axial T2 weighted images (T2WI); D: Axial pre contrast T1 weighted images (T1WI); E: Axial diffusion weighted image (DWI); F: Apparent diffusion coefficient; G: Axial post contrast T1WI portovenous; and H: Axial post contrast T1WI venous magnetic resonance imaging (MRI) images. On T2WI, a target appearance consists of a core with high signal intensity (similar to fluid), a thin ring with low signal intensity, and a peripheral halo with slight hyperintense signal (thick arrows). On dynamic study, it consists of an hypodense/hypointense core, surrounded by a layer of enhancement and a thin peripheral hypodense/hypointense halo (thick arrows). Other hepatic hemangioepithelioma nodules are also noted (thin nodules). T2WI: T2 Weighted Images; T1WI: T1 weighted images; DWI: diffusion weighted image; MRI: Magnetic resonance imaging.
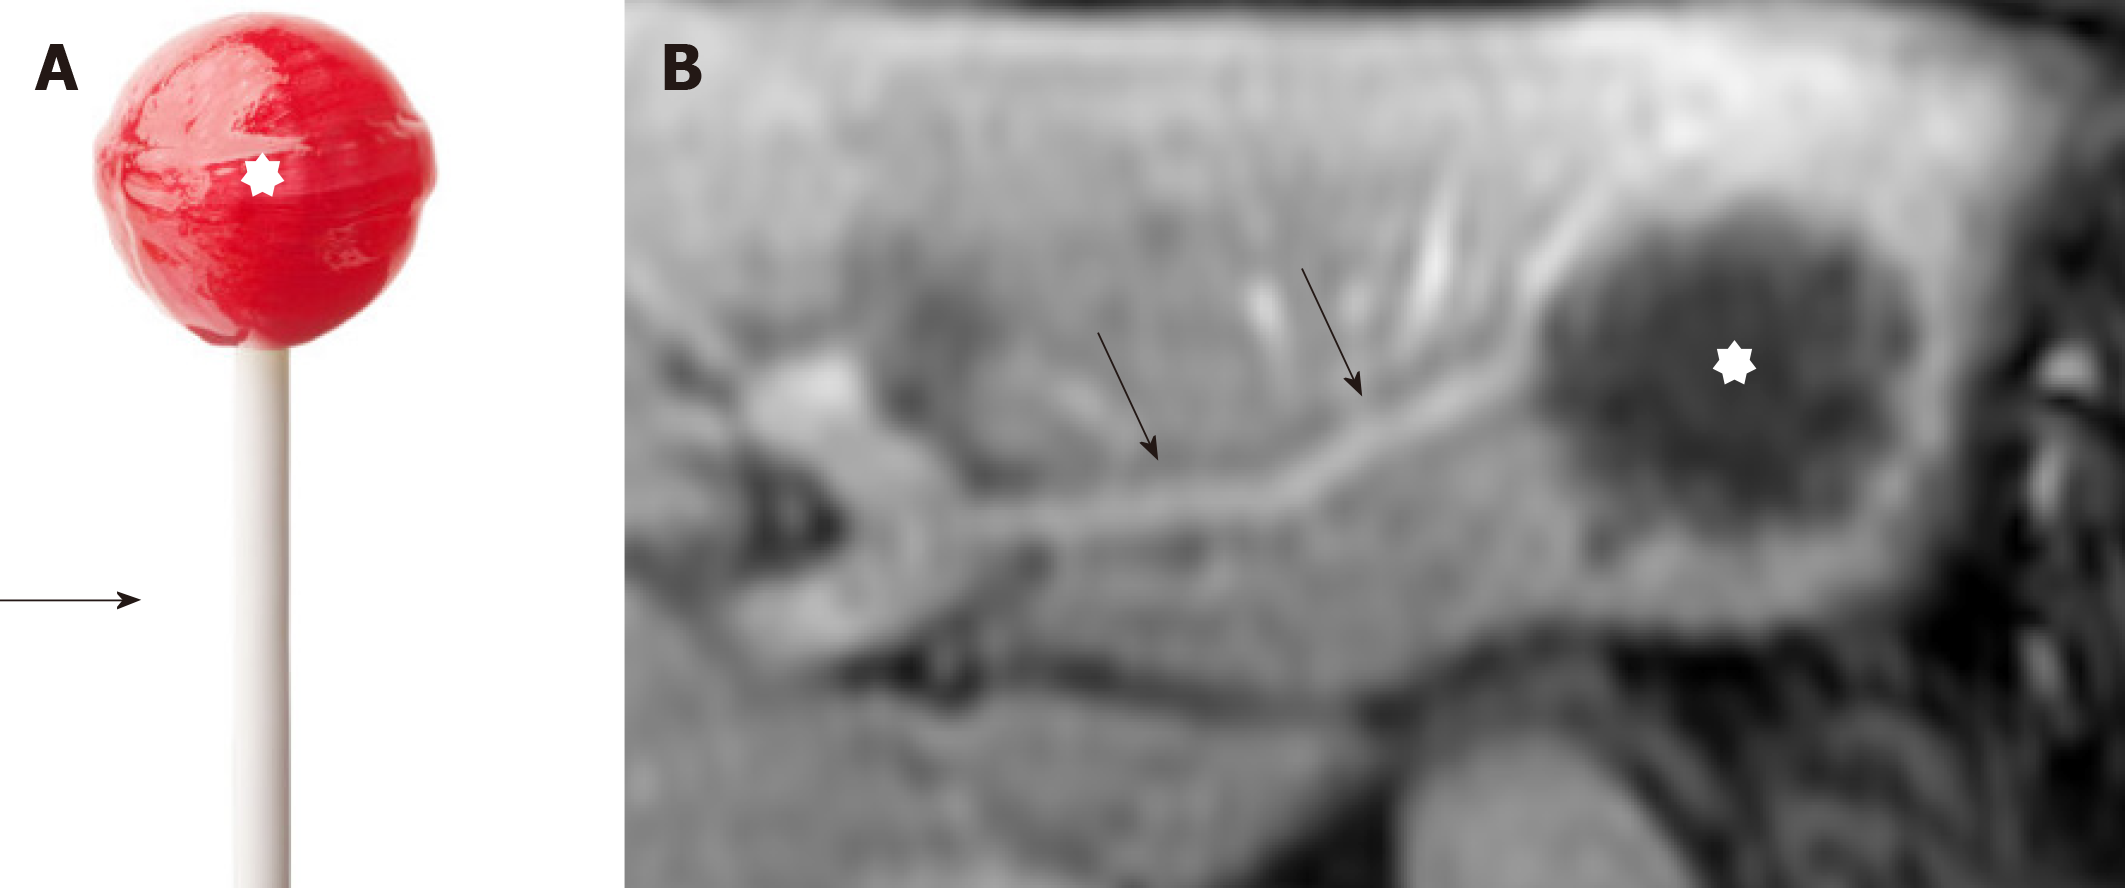
Figure 3 Hepatic hemangioepithelioma imaging feature.
A: A lollipop; B: Axial post contrast T1 Weighted Images images. Hepatic hemangioepithelioma nodule (star) with portal veins entering and terminating in the periphery of the lesion (arrow). This configuration resembles a lollipop. The ‘‘Lollipop sign’’ is a combination of two structures: the well-defined tumor mass on enhanced images (the candy in the lollipop) and the adjacent occluded vein (the stick), because hepatic hemangioepithelioma has the tendency to spread within the portal and hepatic vein branches. The vein should terminate smoothly at the edge or just within the rim of the lesion; vessels that traverse the entire lesion or are displaced and collateral veins cannot be included in the sign.
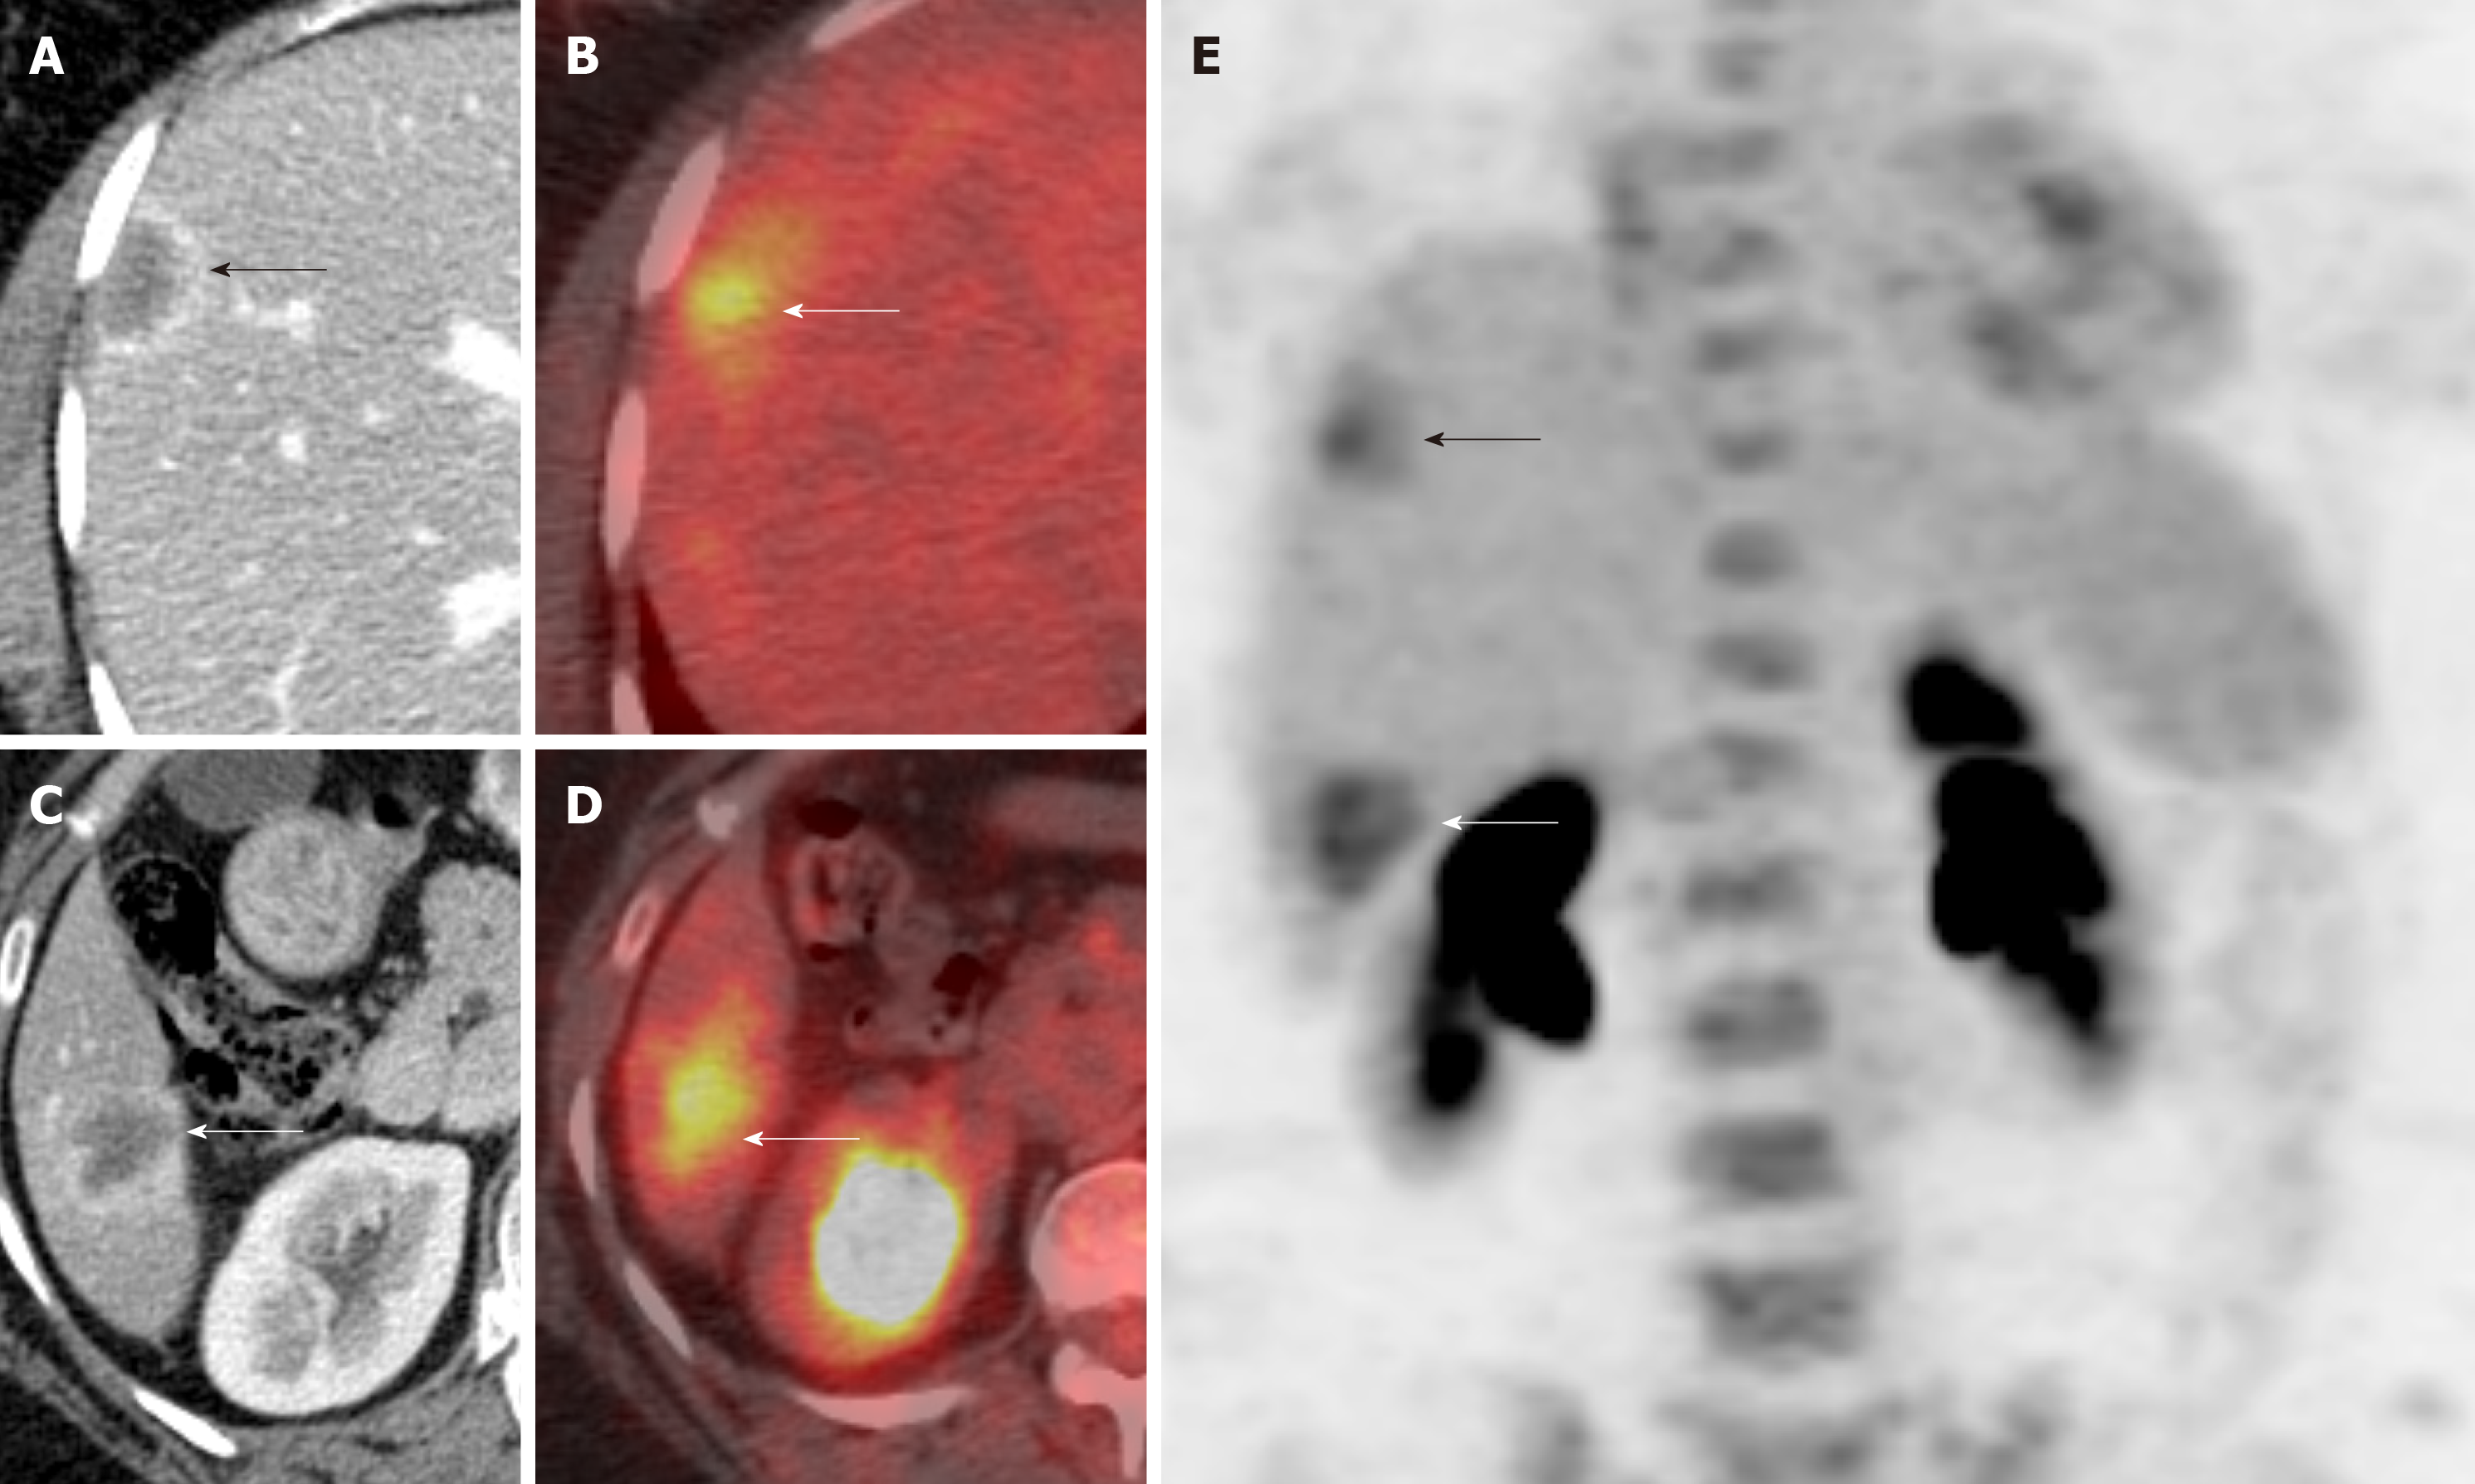
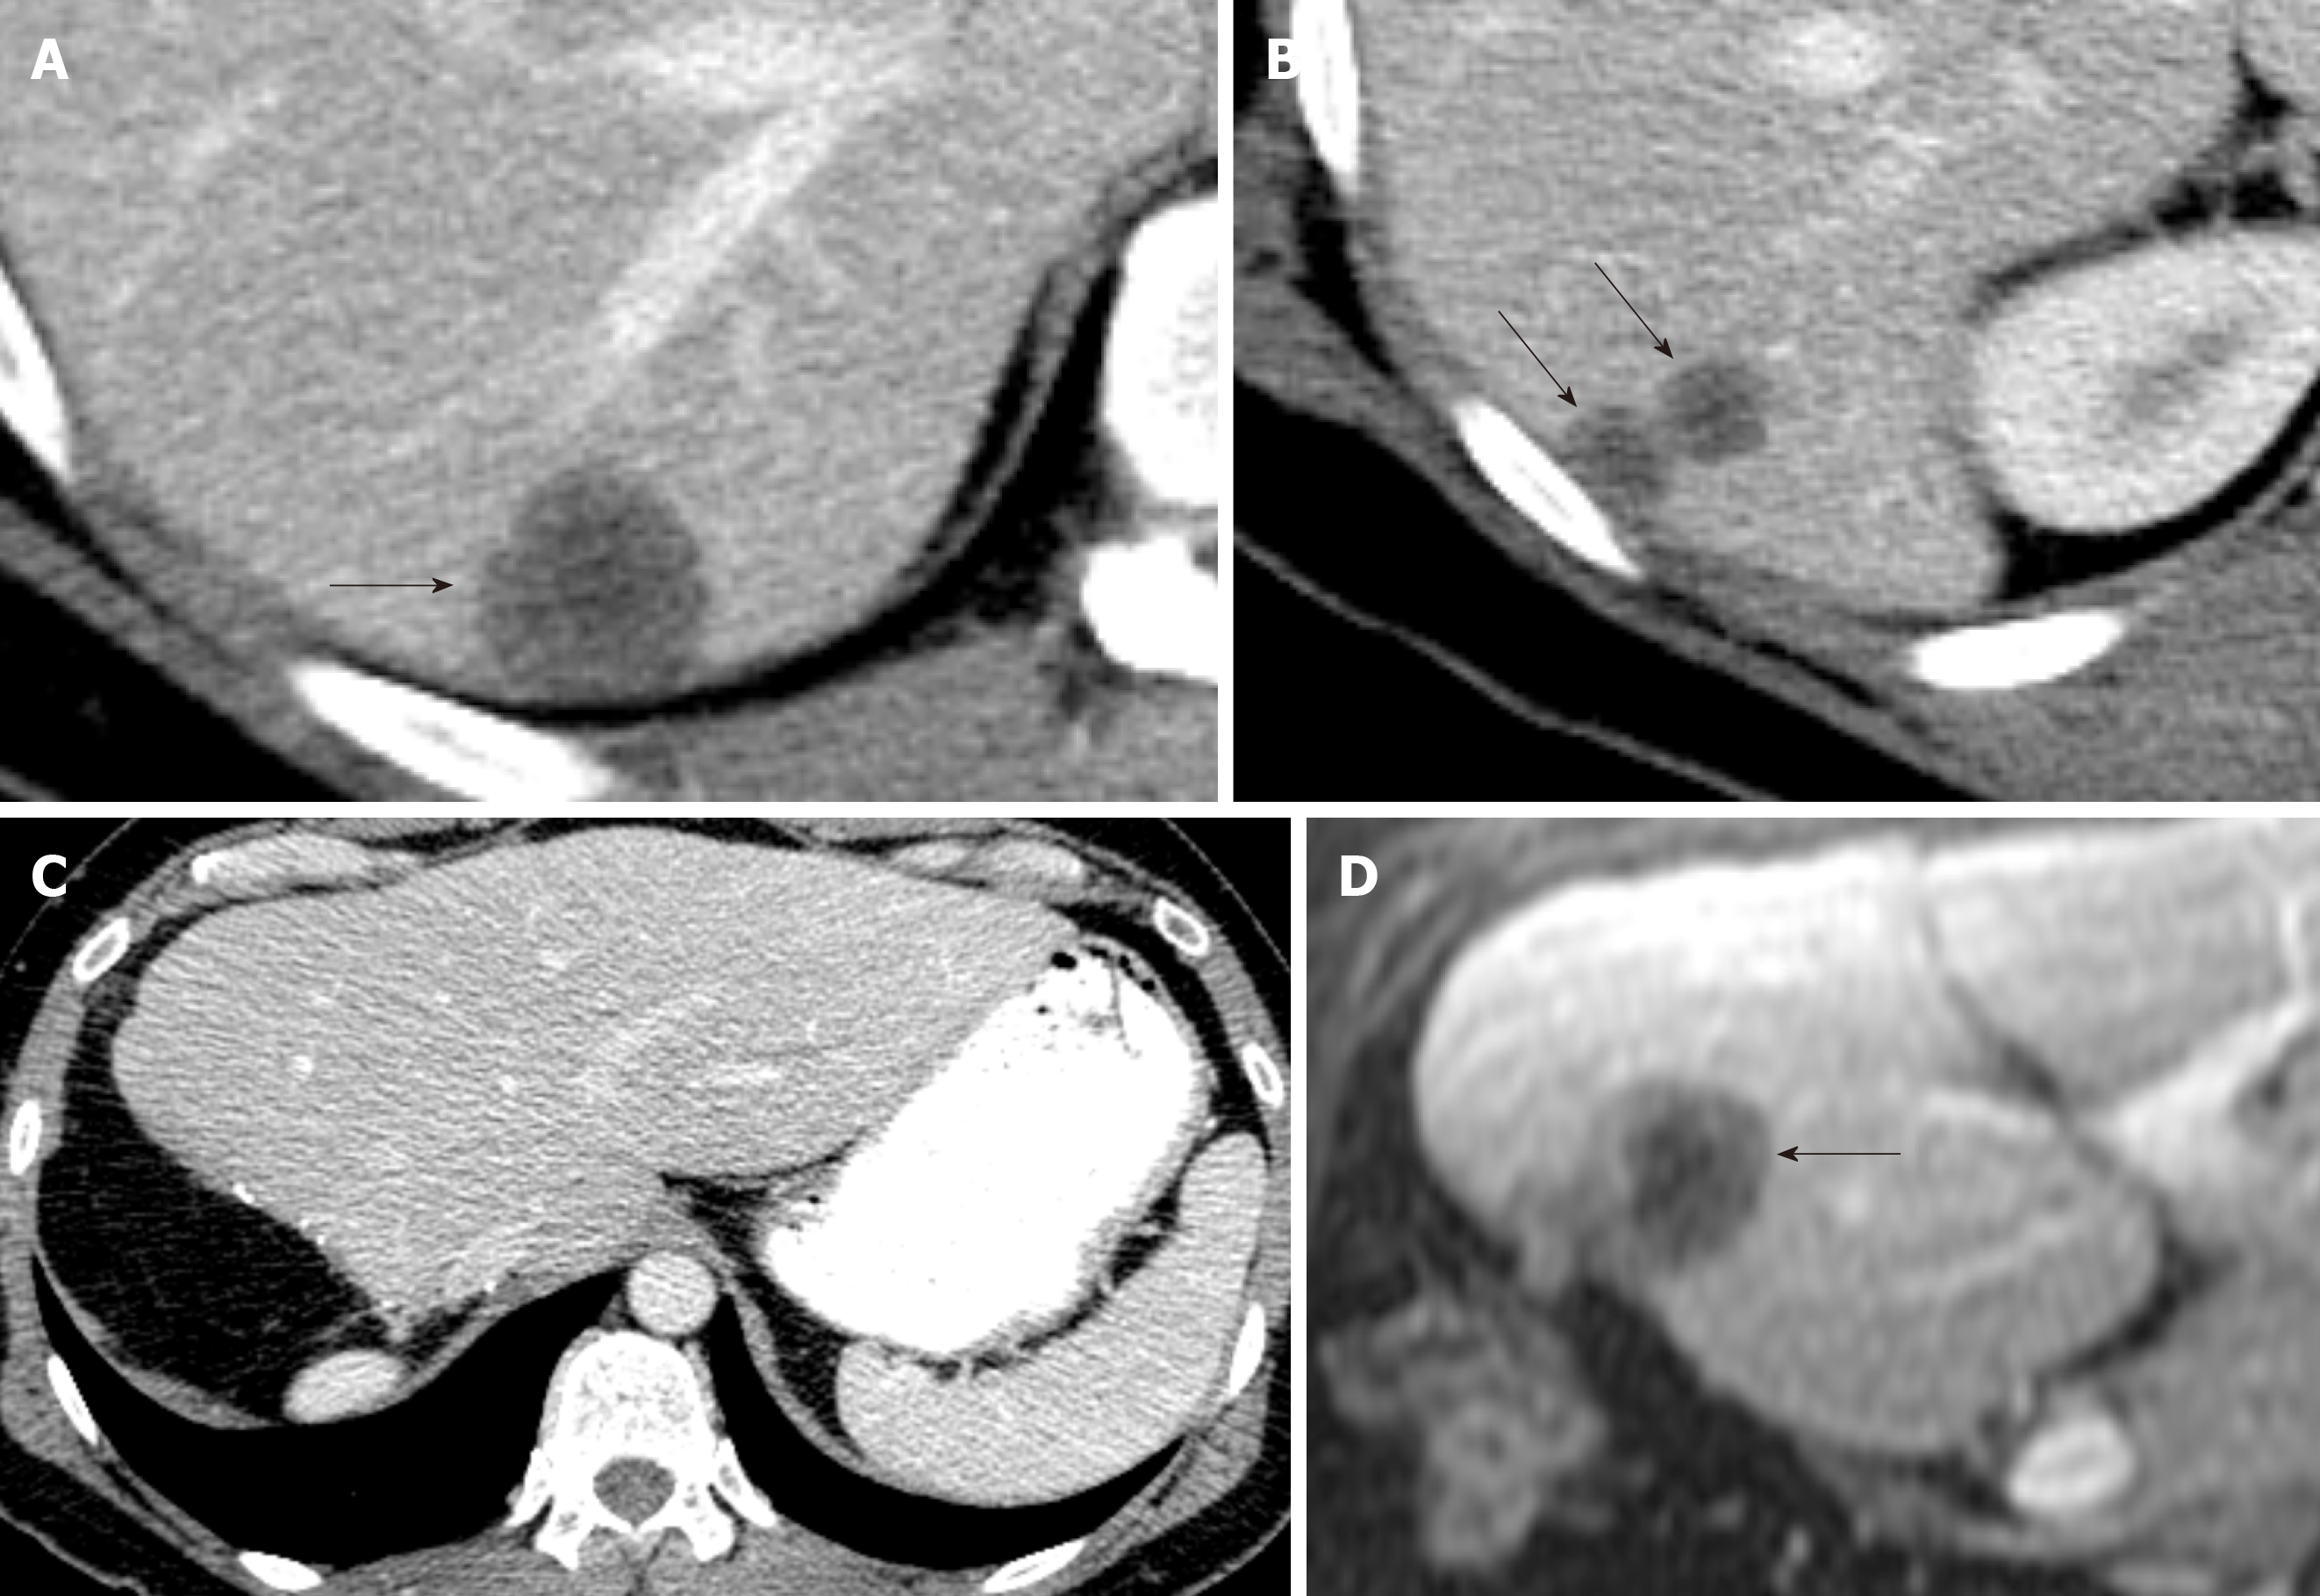
Figure 4 Imaging of hepatic hemangioepithelioma.
A and B: Axial contrast enhanced (Computed Tomography) CT images show hepatic hemangioepithelioma nodules (arrows); C and D: Axial 18F-labeled fluoro-2-deoxyglucose positron emission tomography/computed tomography; E: Coronal maximum intensity projection images shows fluoro-2-deoxyglucose avid hepatic hemangioepithelioma nodules (arrows).
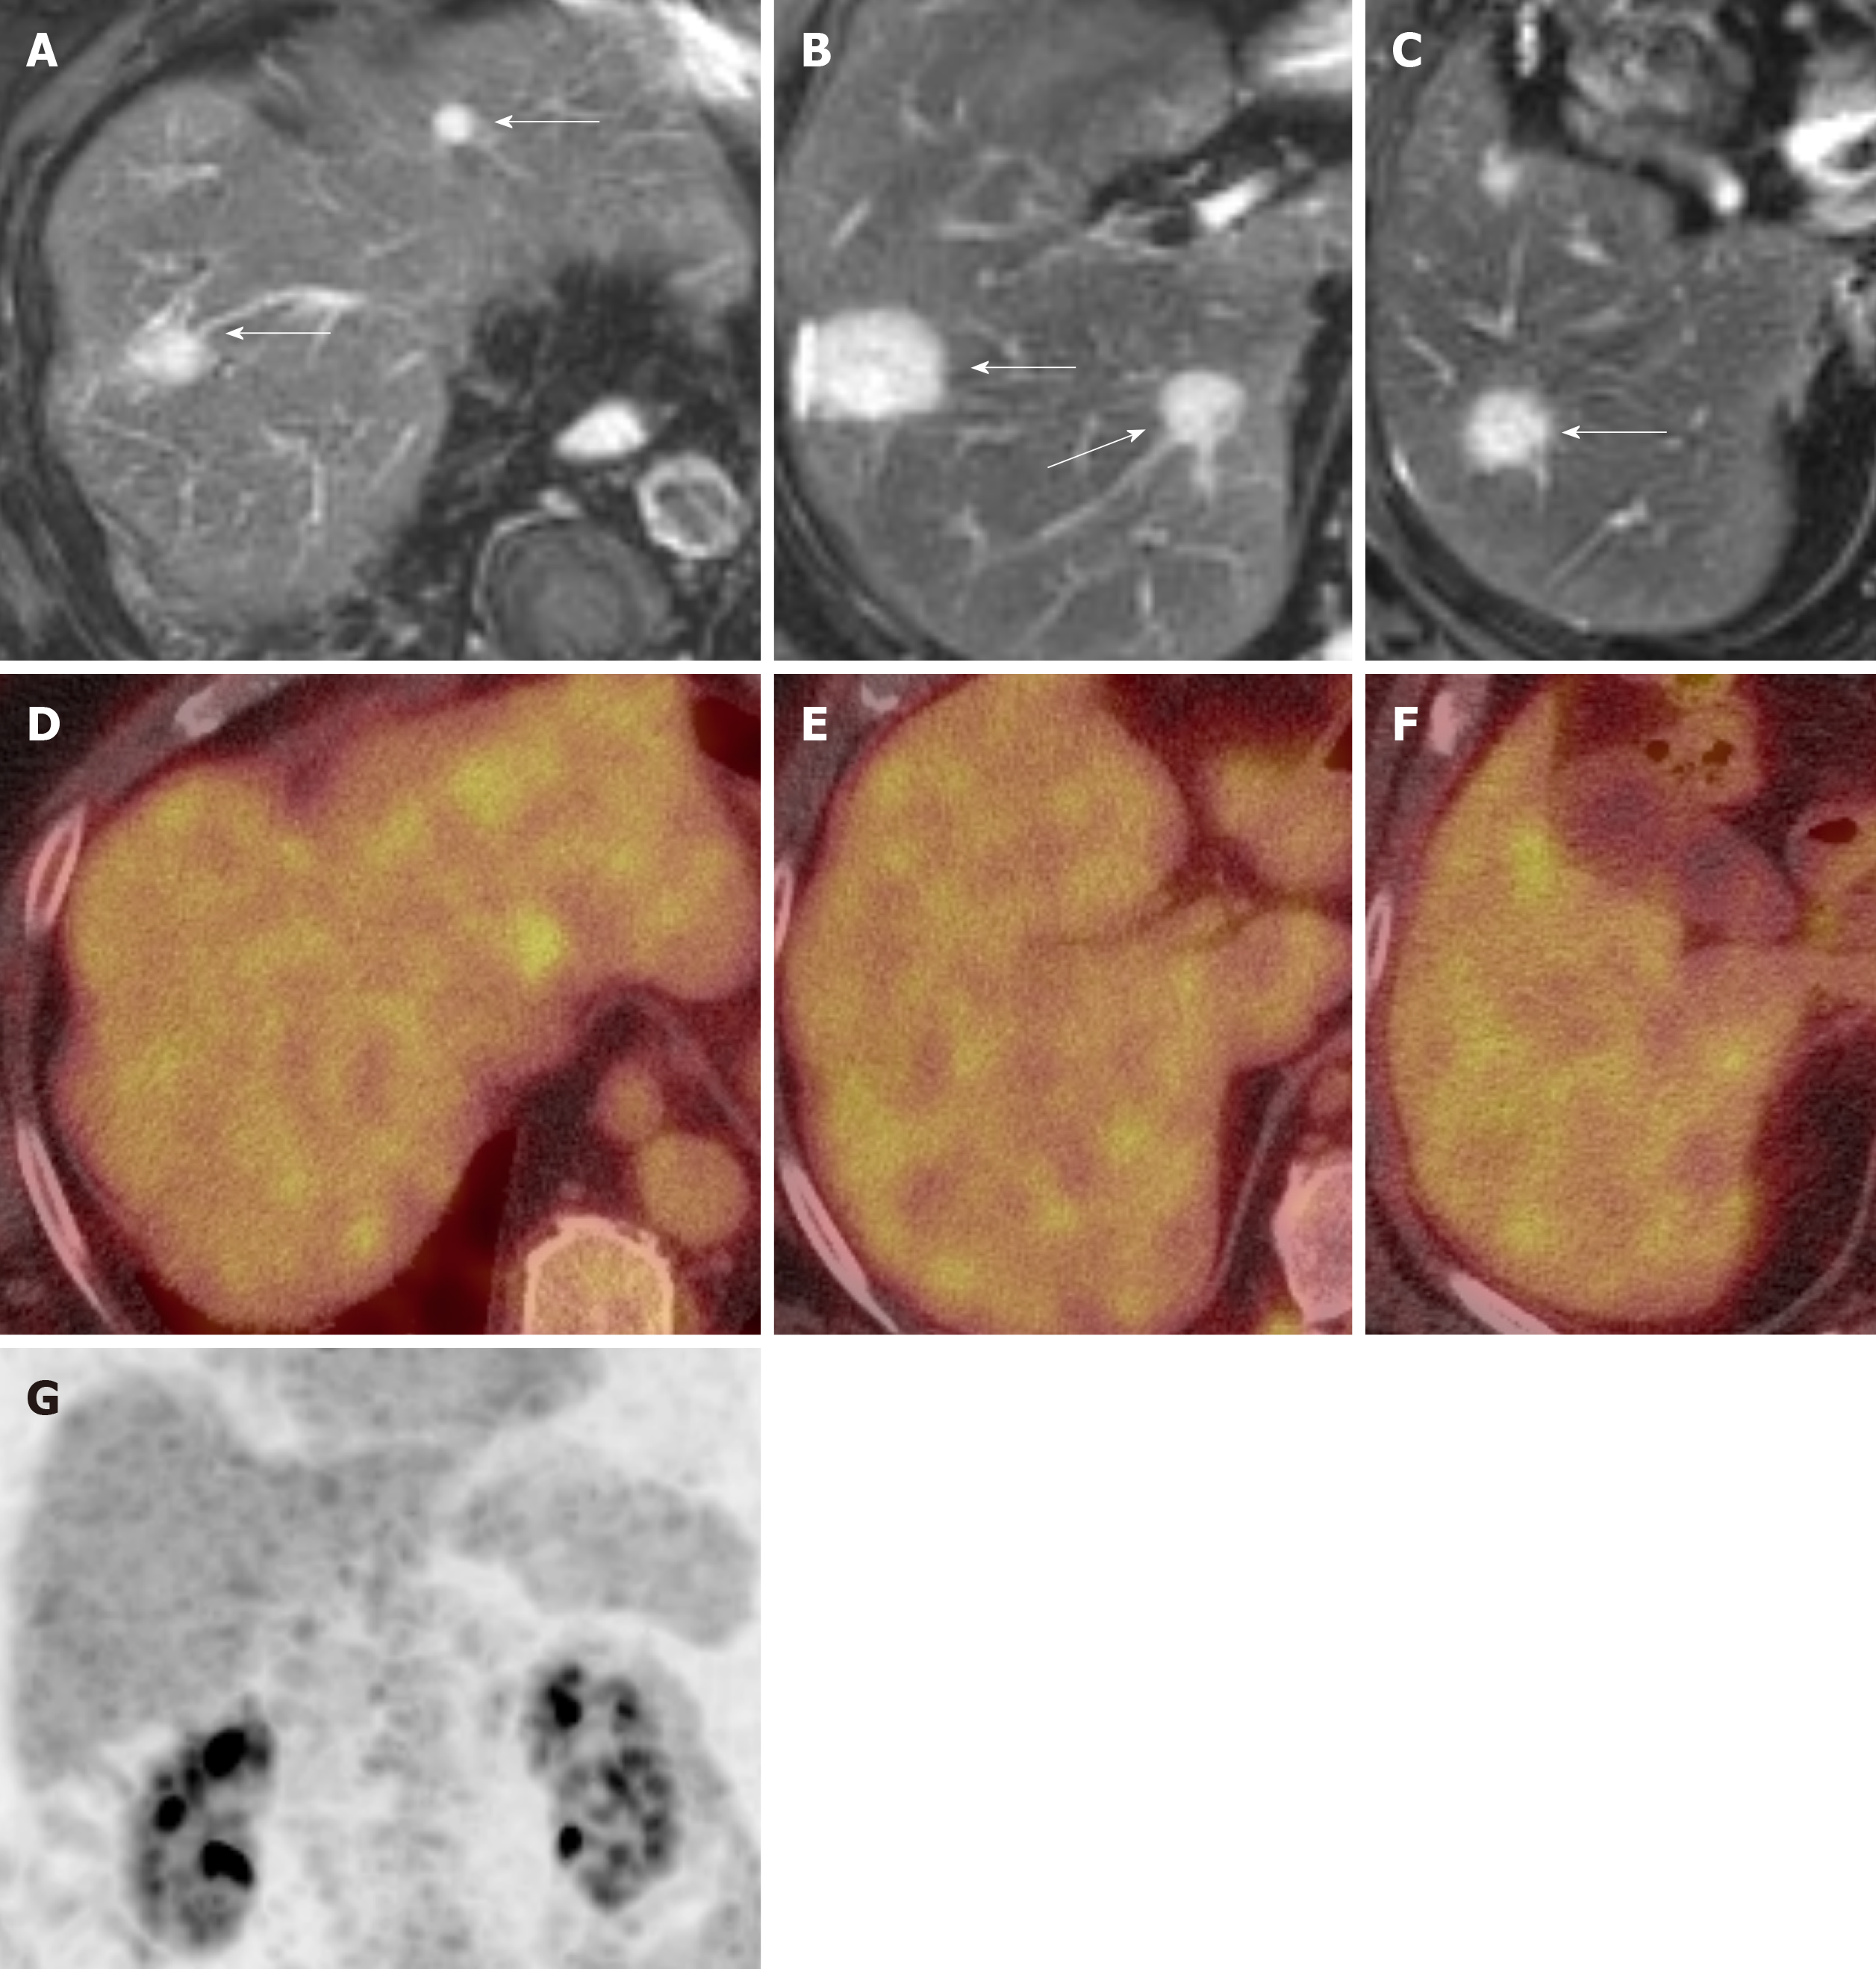
Figure 5 Imaging of hepatic hemangioepithelioma.
A, B and C: Axial T2 Weighted Image Magnetic Resonance Imaging images show hepatic hemangioepithelioma nodules (arrows); D, E and F: Axial 18F-labeled fluoro-2-deoxyglucose positron emission tomography/computed tomography and G: Coronal maximum intensity projection images show no fluoro-2-deoxyglucose update by the hepatic hemangioepithelioma nodules.
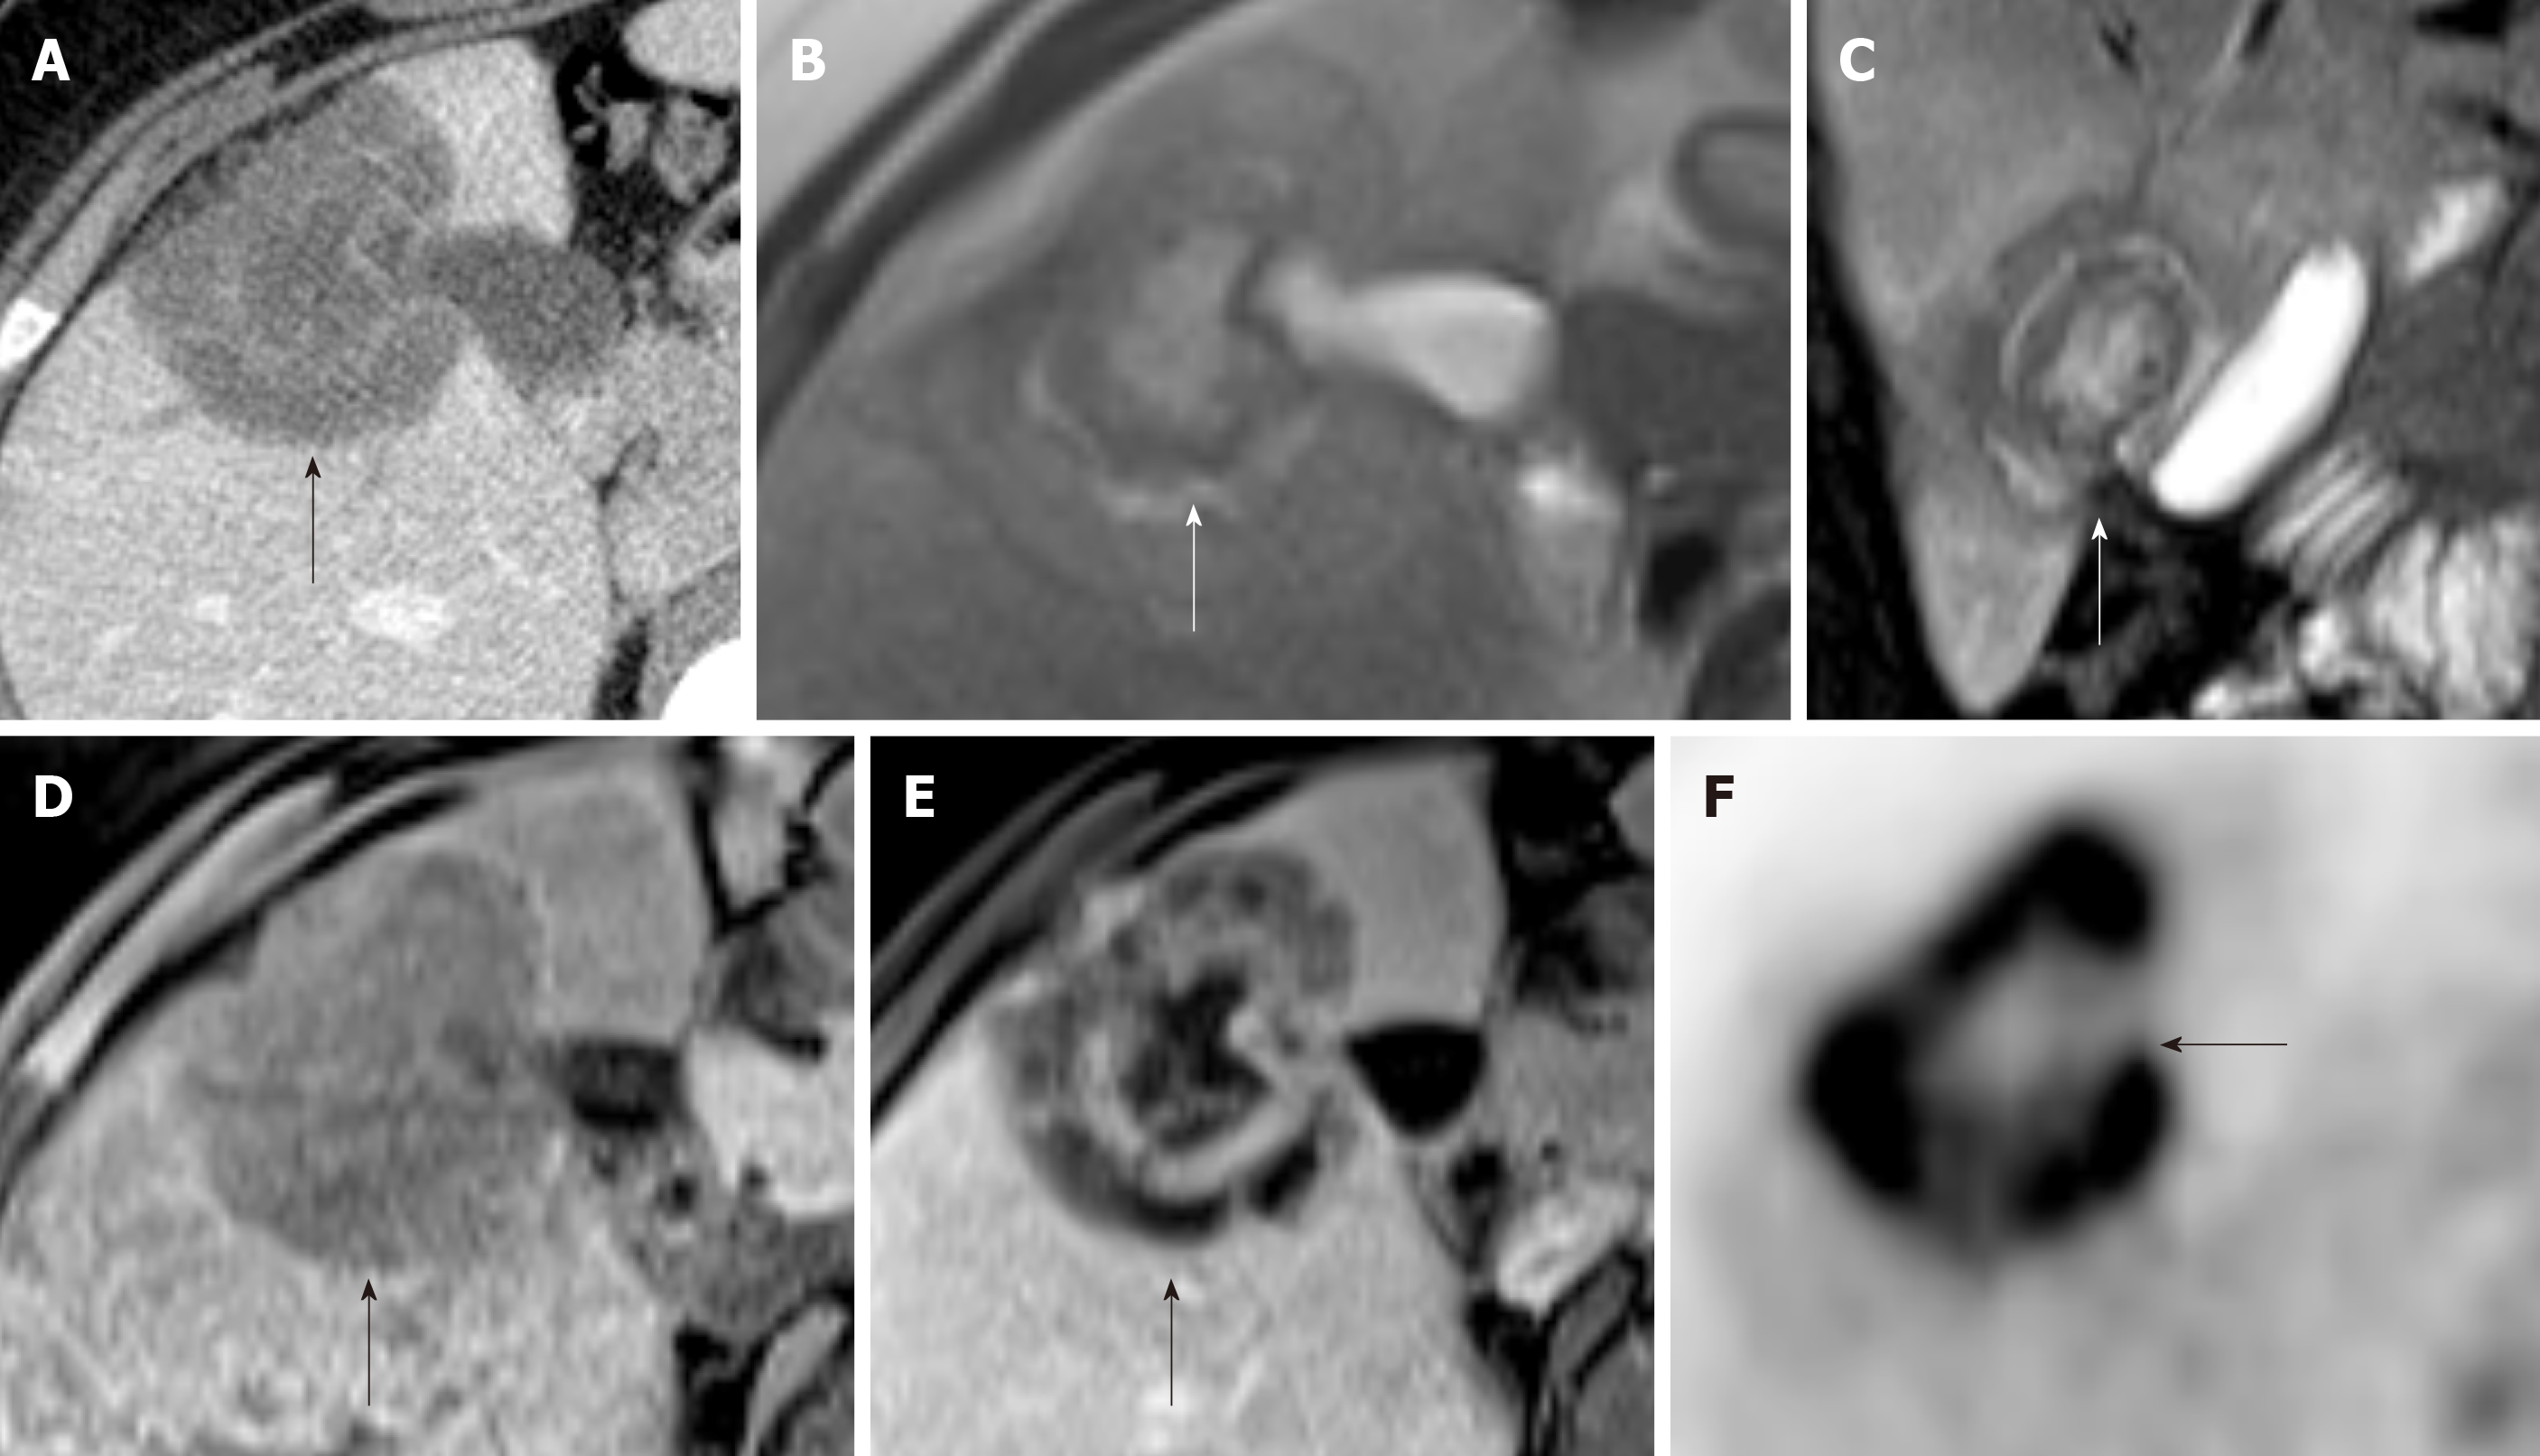
Figure 6 Imaging of hepatic hemangioepithelioma.
A: Axial contrast enhanced CT image; B: Axial T2 weighted images; C: coronal T2 weighted images; D: Axial pre contrast T1 Weighted Image; E: Axial post contrast T1 Weighted Image MRI Images; and F: Axial 18F-labeled fluoro-2-deoxyglucose positron emission tomography/computed tomography attenuation corrected image show a hepatic hemangioepithelioma nodule (arrow) with fluoro-2-deoxyglucose update.
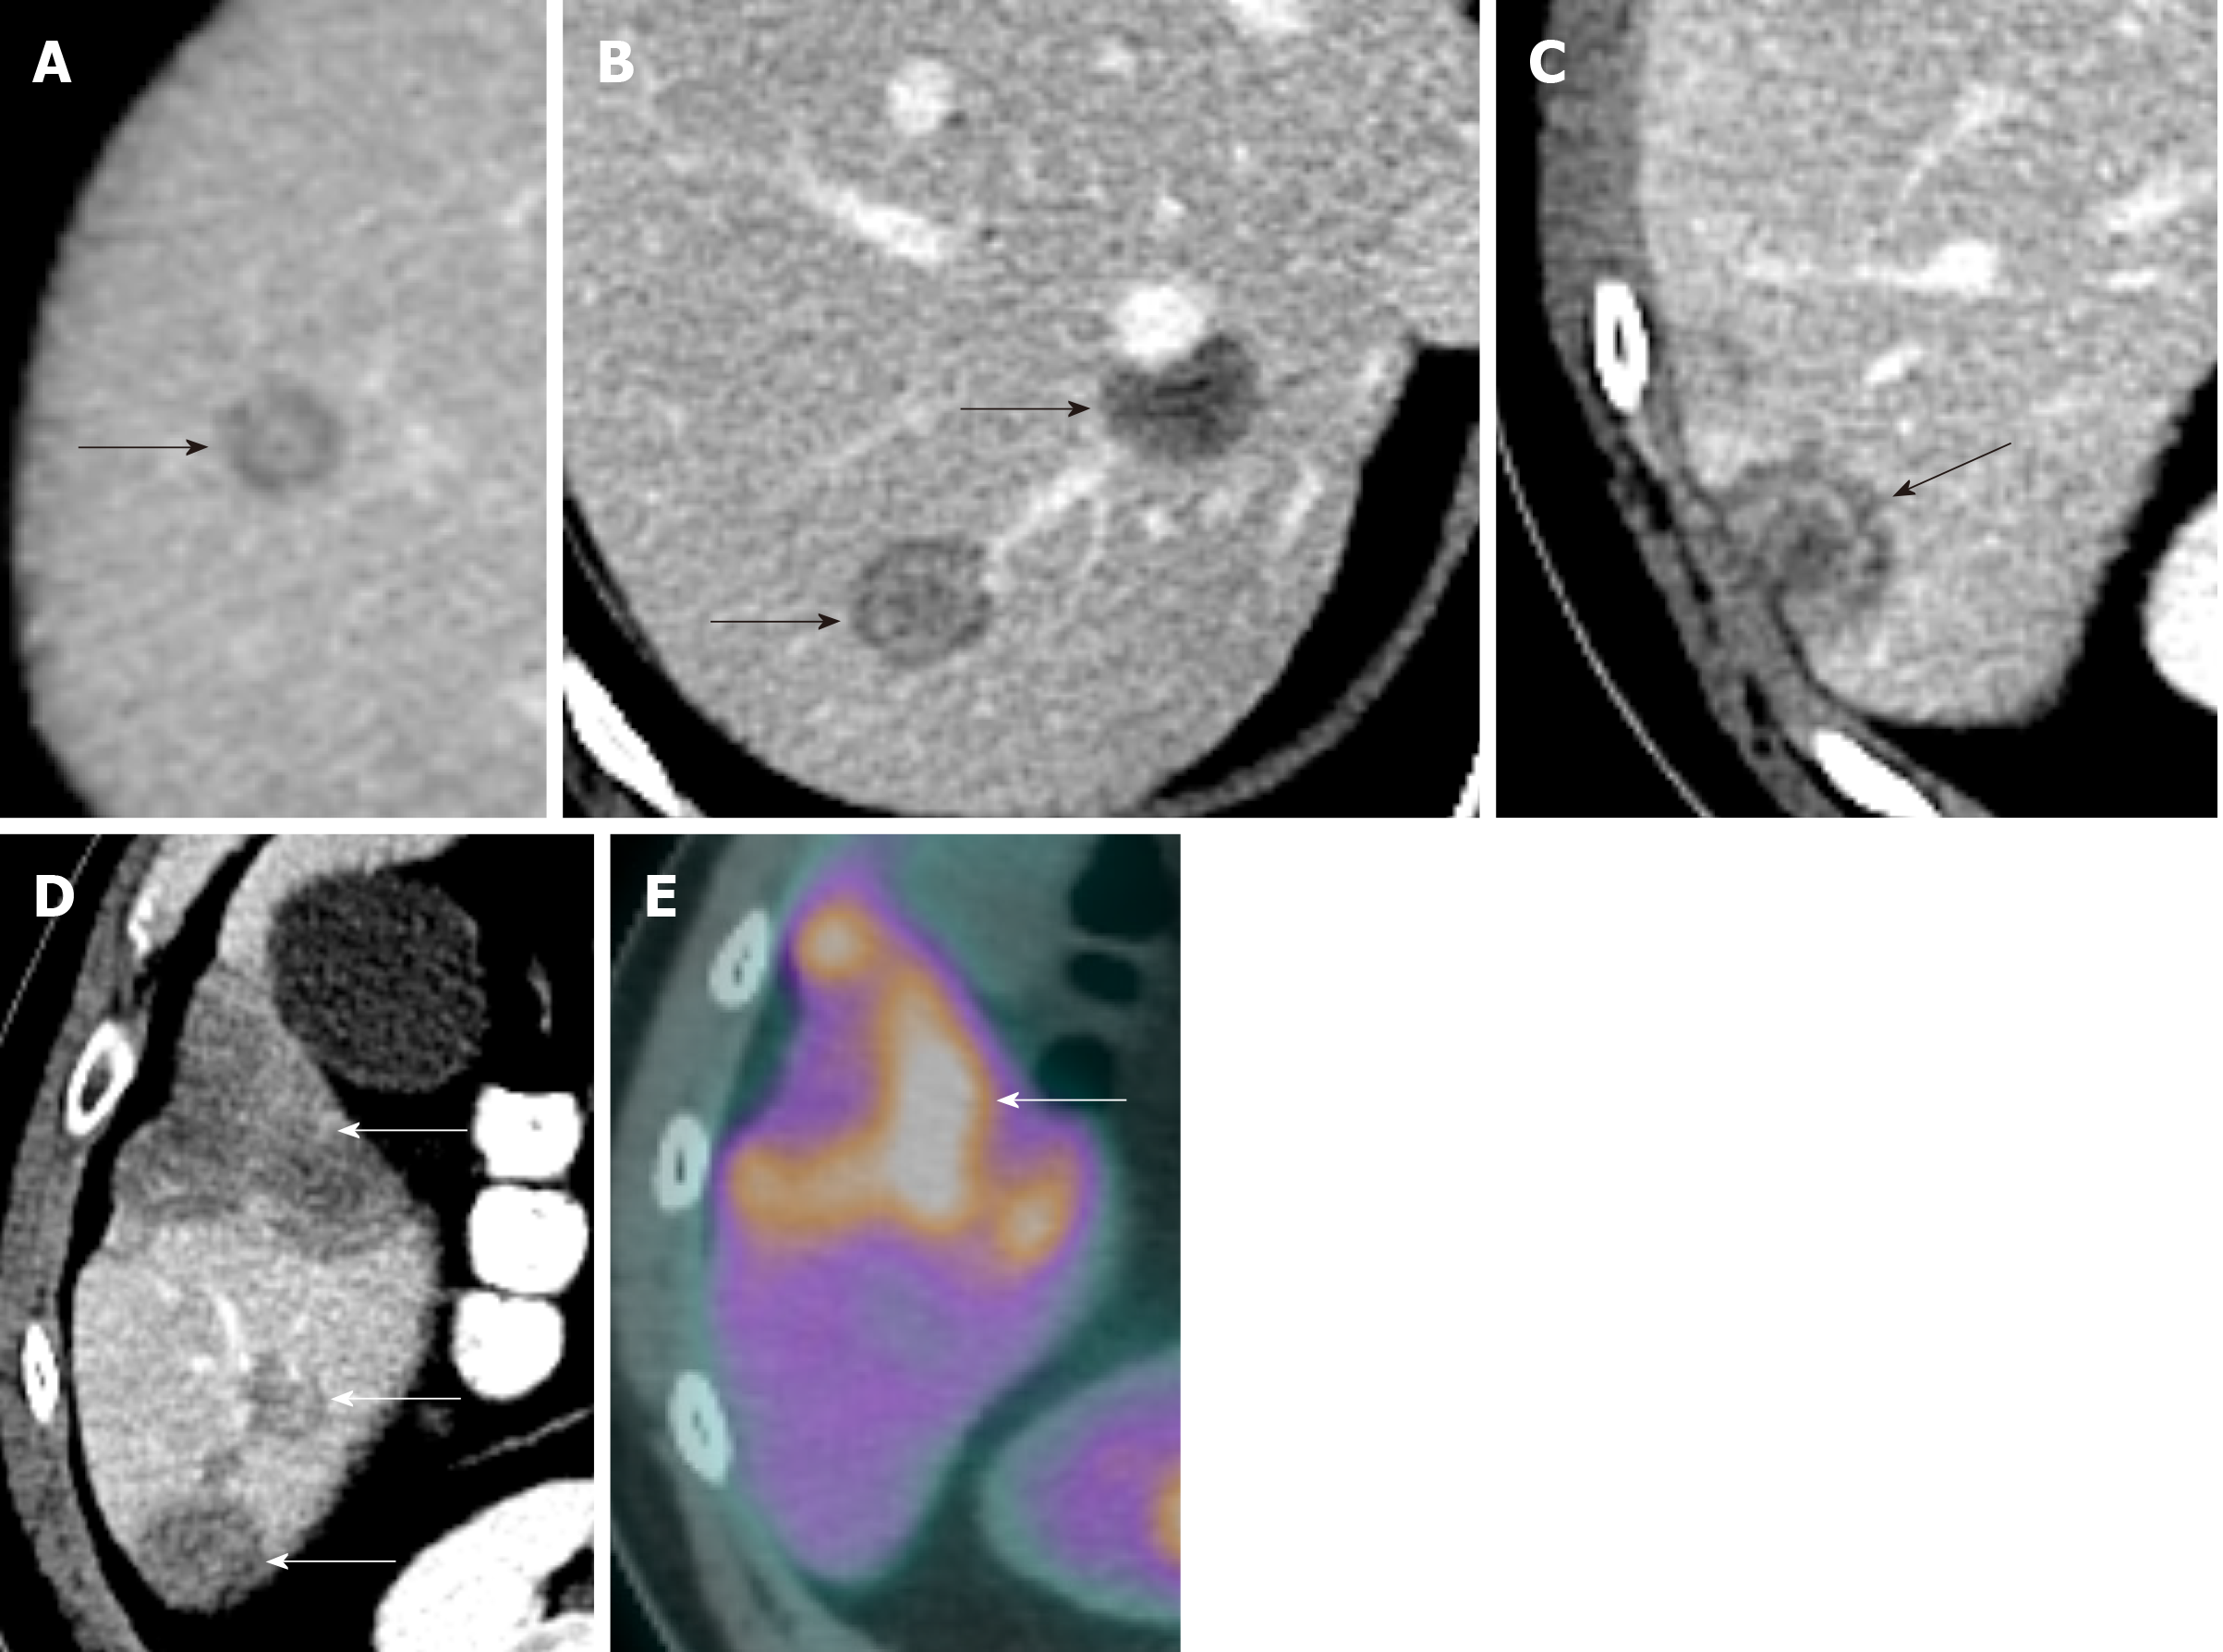
Figure 7 Imaging of hepatic hemangioepithelioma.
A, B, C and D: Axial contrast enhanced CT images show hepatic hemangioepithelioma nodules (arrows); E: Axial 18F-labeled fluoro-2-deoxyglucose positron emission tomography/computed tomography image shows a heterogeneous uptake by hepatic hemangioepithelioma nodule (arrow), while rest of the nodules showed no fluoro-2-deoxyglucose update.
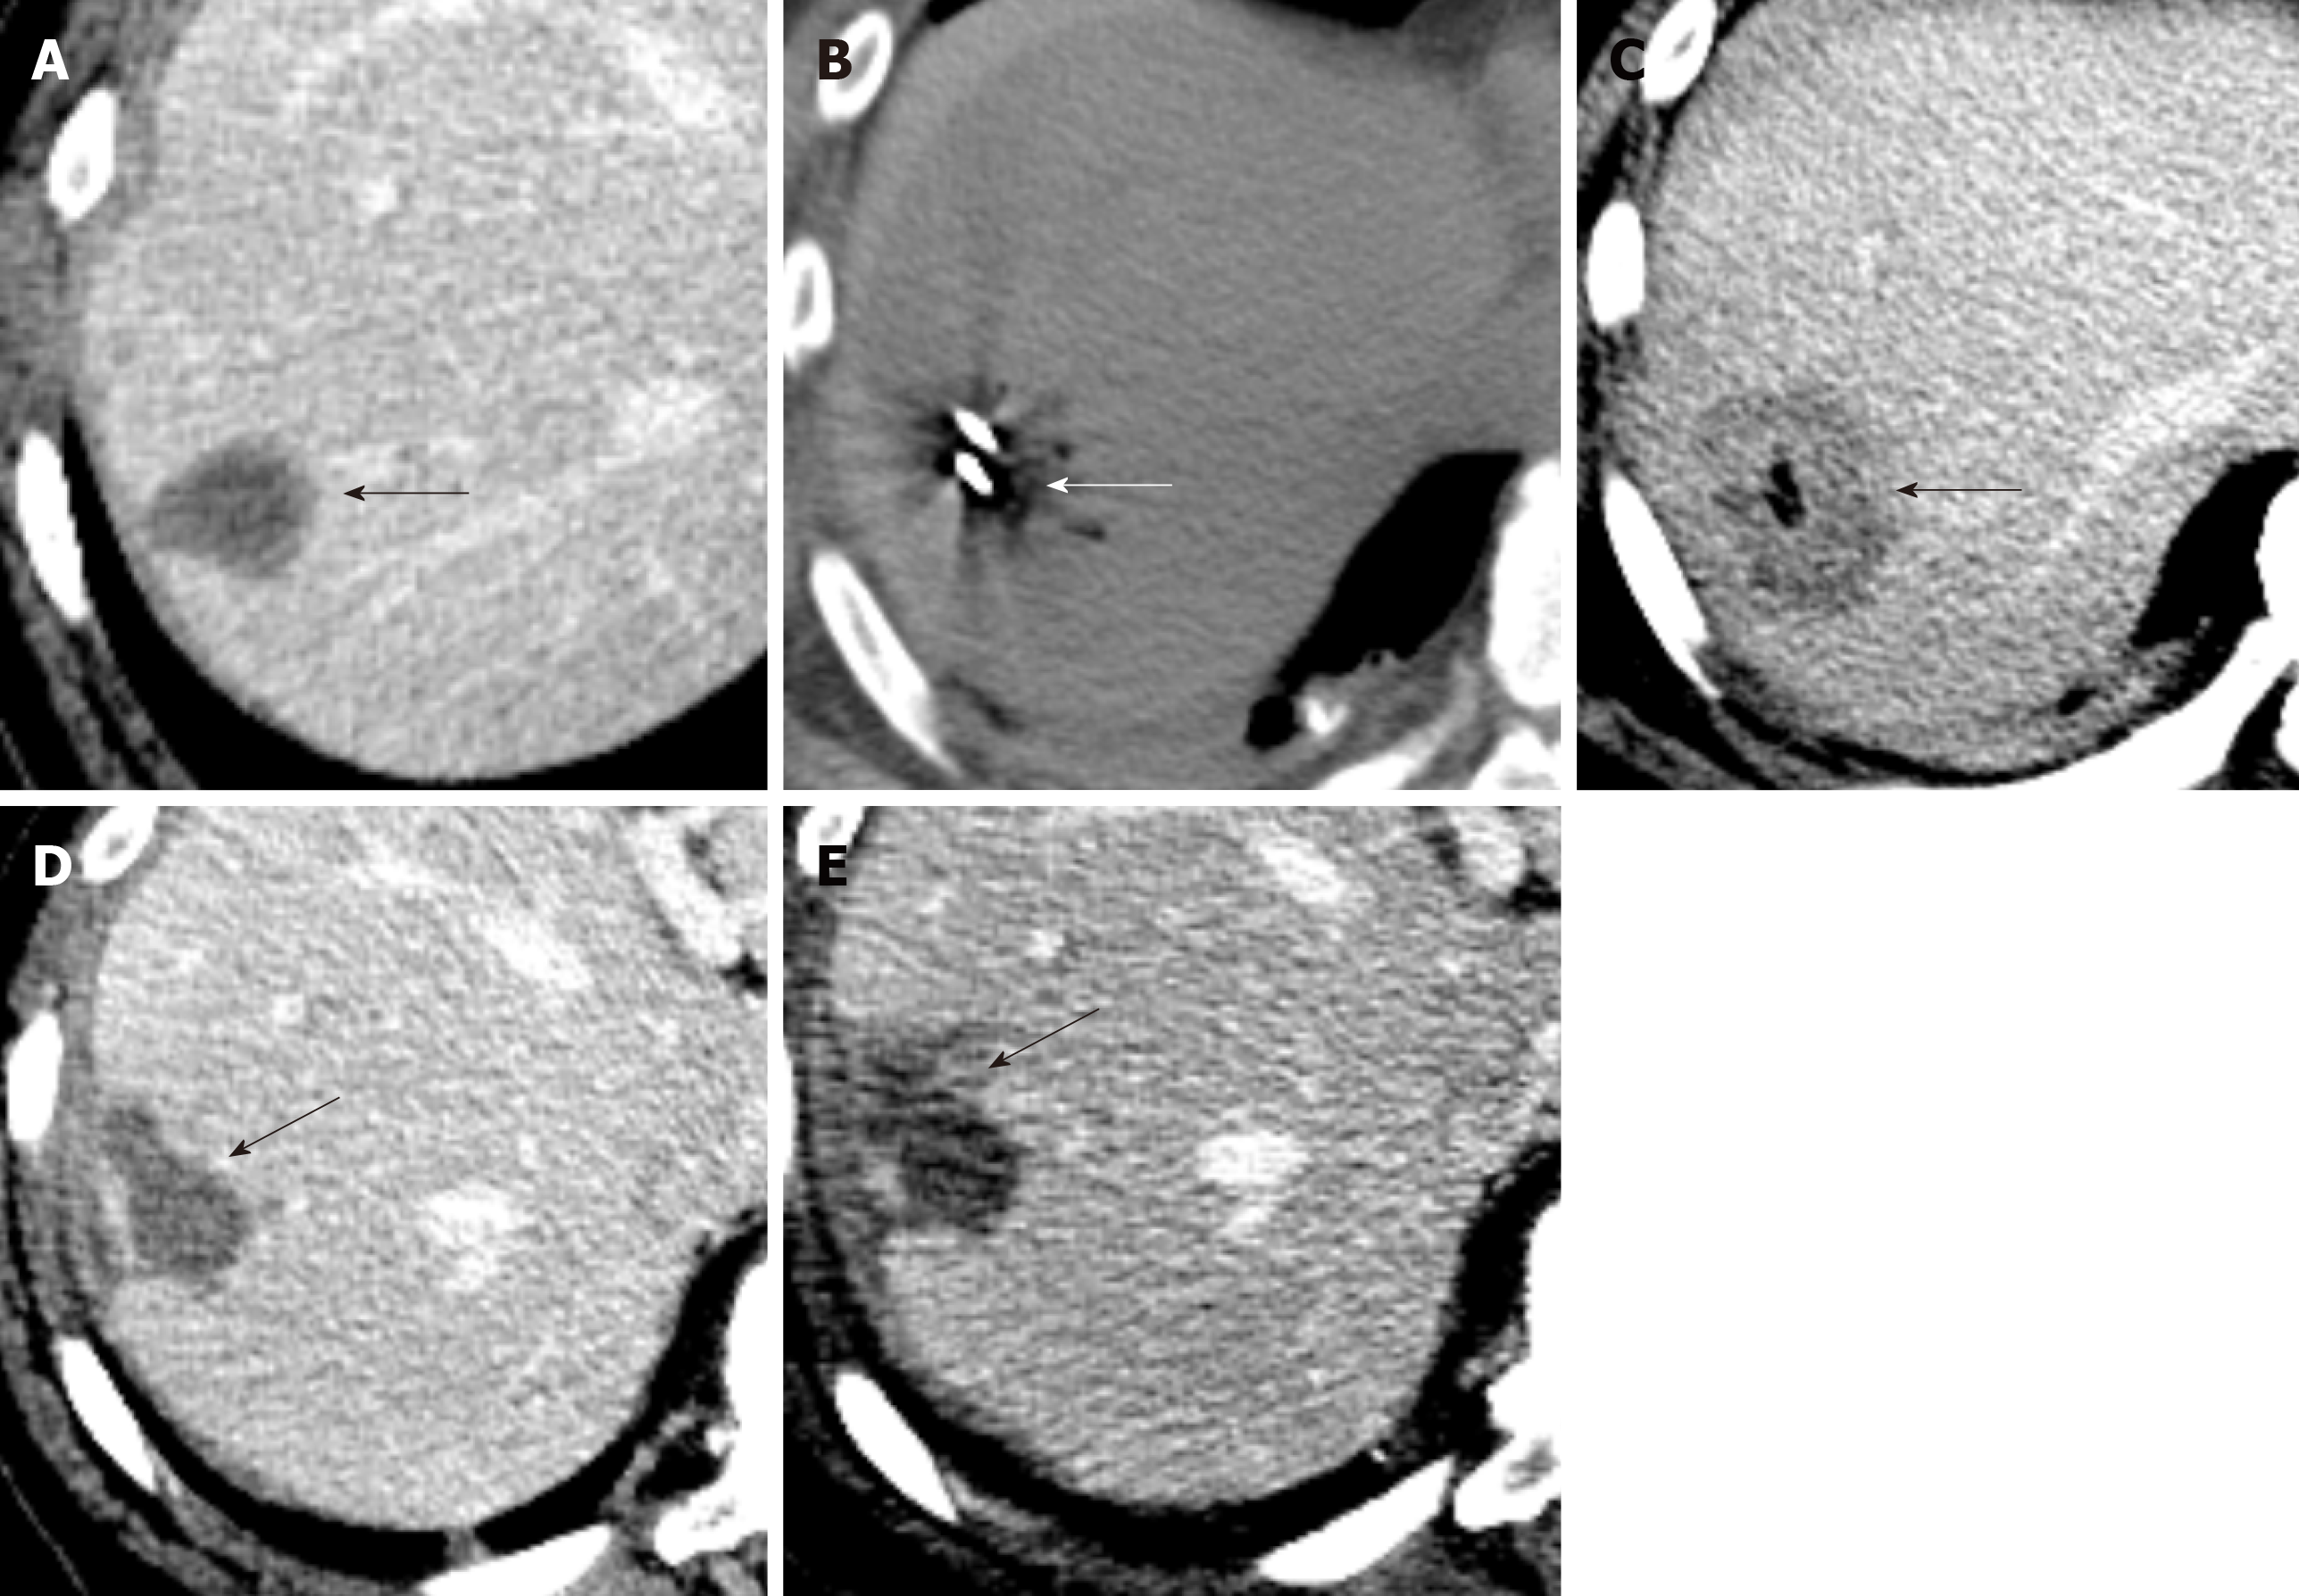
Figure 8 Ablation of hepatic hemangioepithelioma.
A: Axial contrast enhanced CT image shows a 3 cm hepatic hemangioepithelioma nodule (arrow) in segment 7 of the liver; B: Axial non-contrast CT image shows microwave ablation of liver of the segment 7 nodule (arrow); C: Immediate post ablation axial contrast enhanced CT image shows an ablation cavity (arrow); D: Follow up axial contrast CT image after 3 mo and; E: Axial contrast CT image 6 mo show an evolving post ablation cavity and tract (arrow).
Figure 9 Recurrent hepatic hemangioepithelioma.
A and B: Axial contrast enhanced CT images show hepatic hemangioepithelioma nodules (arrows); C: Axial contrast enhanced CT image shows post-surgical changes related to right hepatectomy; D: 3 mo follow up axial post contrast T1 Weighted Image Magnetic Resonance Imaging image shows a recurrent hepatic hemangioepithelioma (arrow).
- Citation: Virarkar M, Saleh M, Diab R, Taggart M, Bhargava P, Bhosale P. Hepatic Hemangioendothelioma: An update. World J Gastrointest Oncol 2020; 12(3): 248-266
- URL: https://www.wjgnet.com/1948-5204/full/v12/i3/248.htm
- DOI: https://dx.doi.org/10.4251/wjgo.v12.i3.248


