Copyright
©The Author(s) 2020.
World J Gastrointest Oncol. Nov 15, 2020; 12(11): 1237-1254
Published online Nov 15, 2020. doi: 10.4251/wjgo.v12.i11.1237
Published online Nov 15, 2020. doi: 10.4251/wjgo.v12.i11.1237
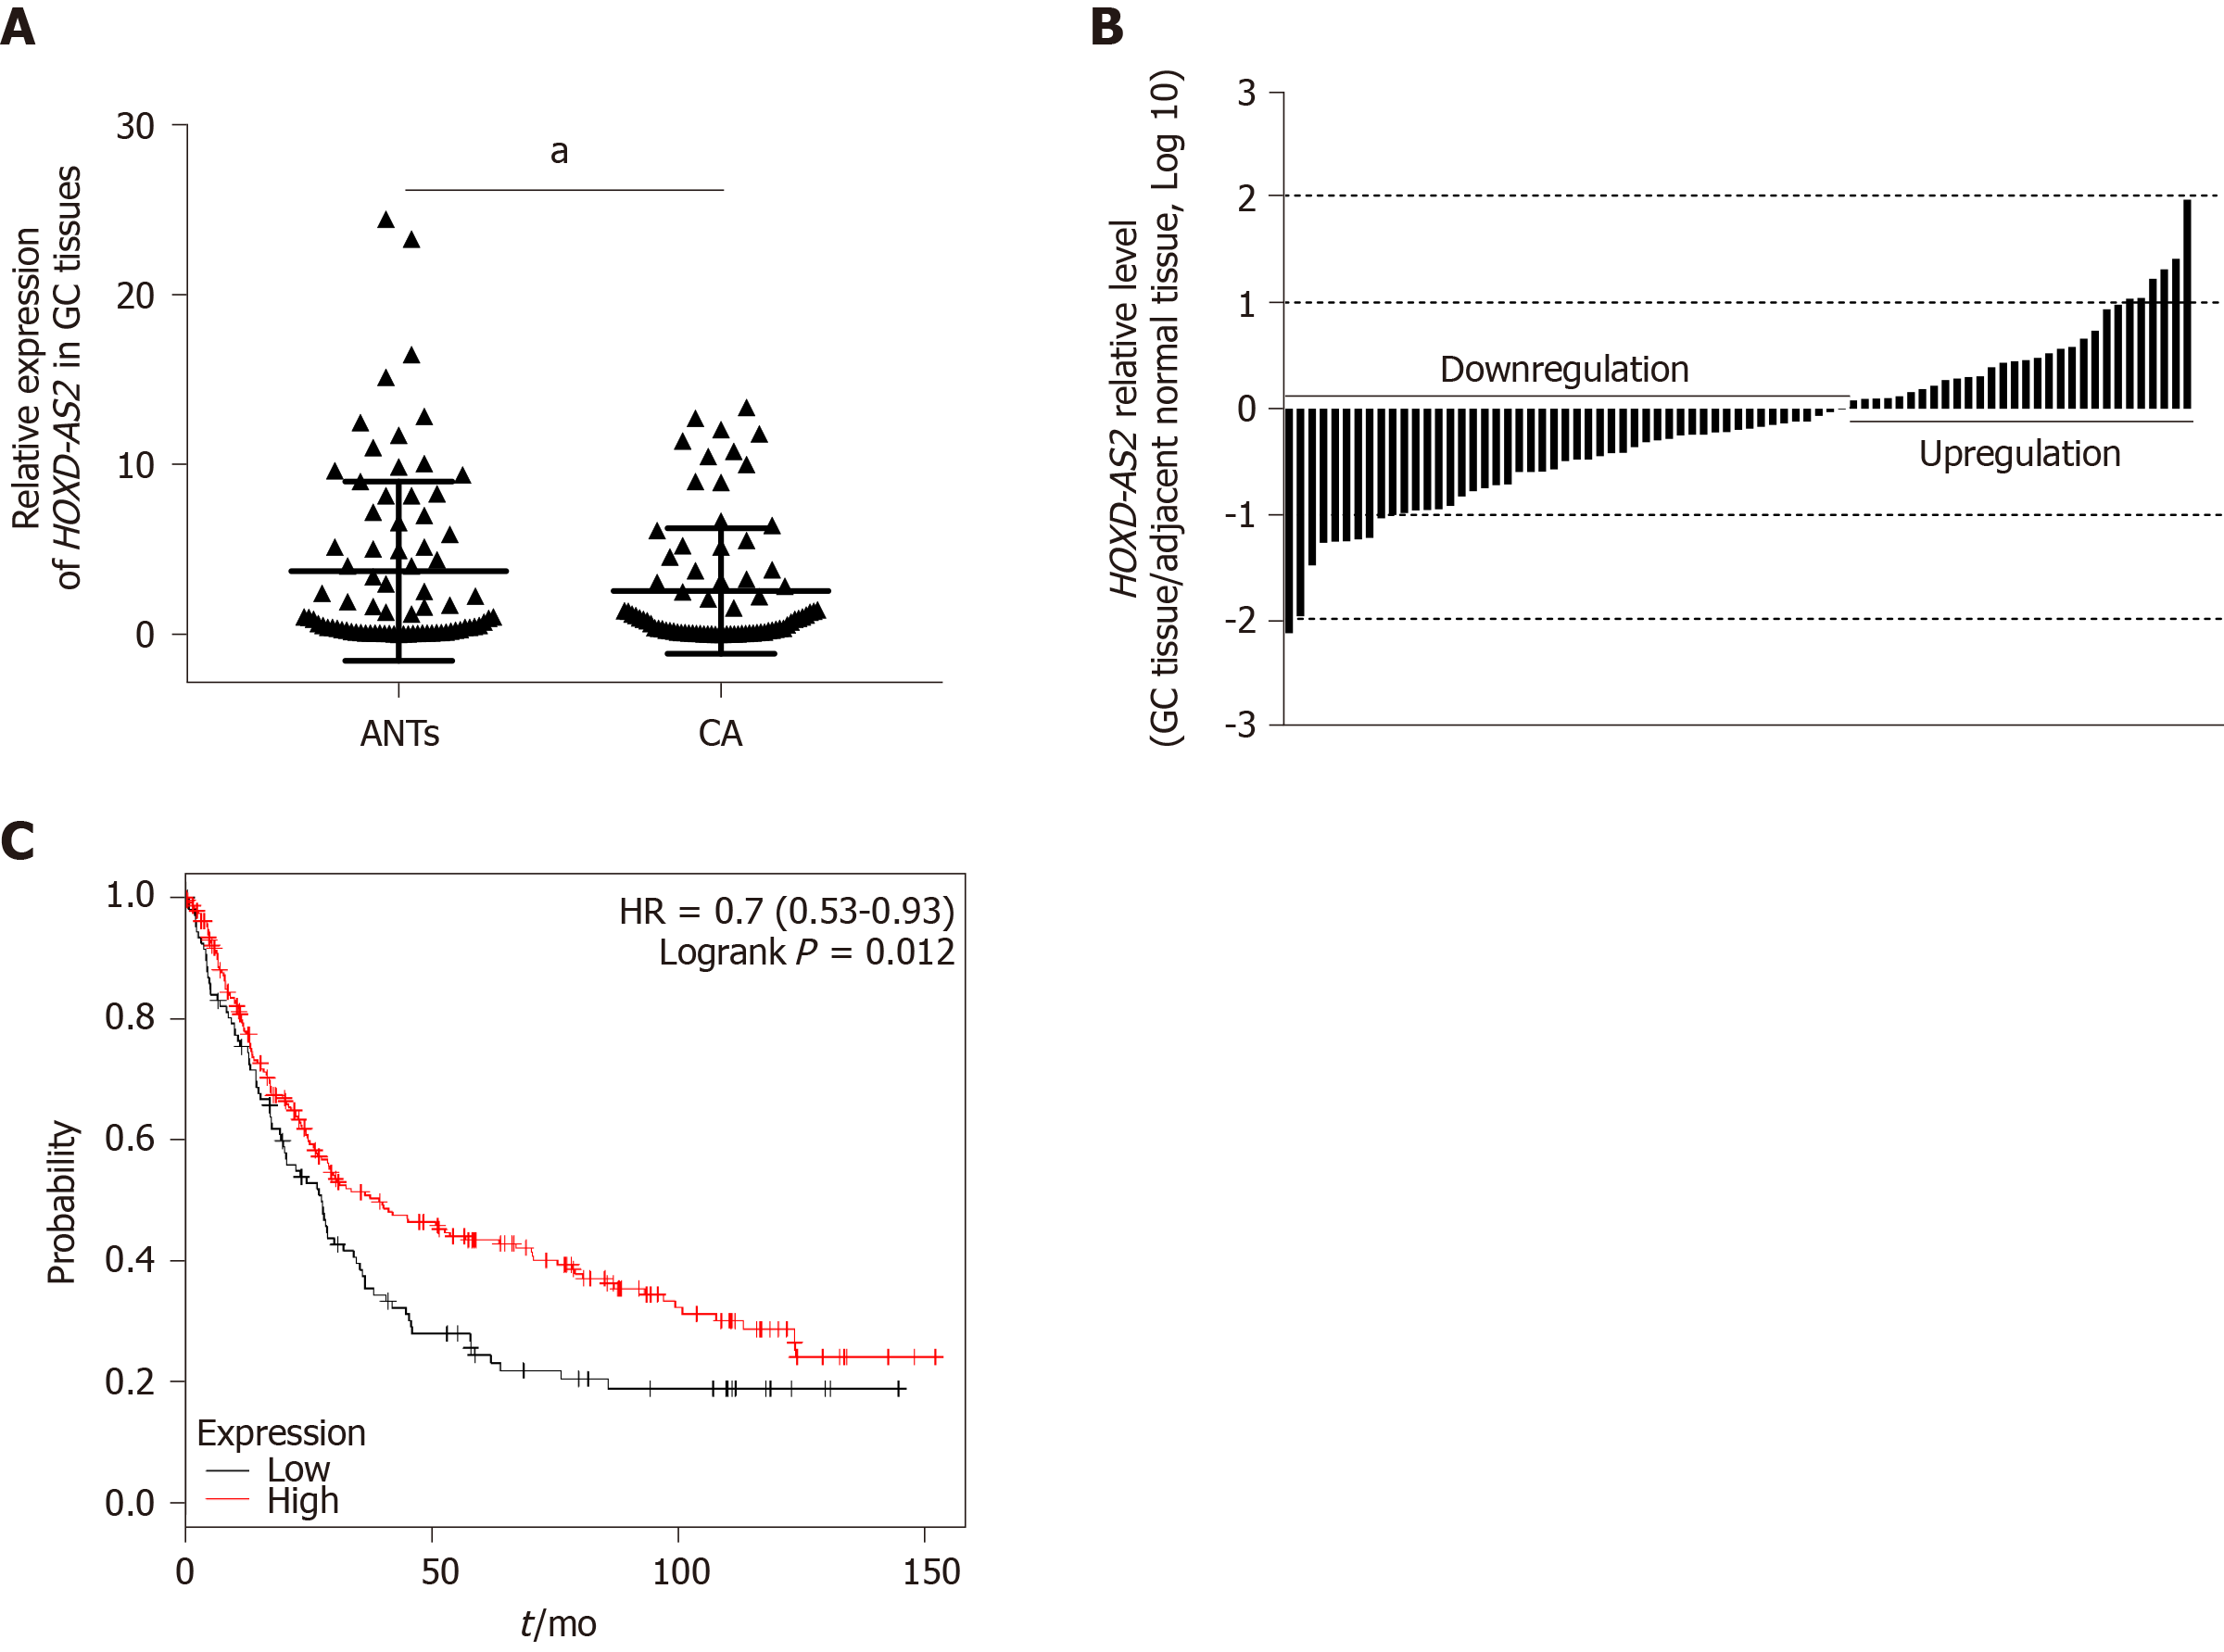
Figure 1 HOXD-AS2 is downregulated in gastric cancer tissues and is associated with a poor prognosis in gastric cancer patients.
A: The relative expression level of HOXD-AS2 in gastric cancer (GC) tissues was significantly lower than that in adjacent non-cancerous tissues (ANTs; P = 0.030, n = 79); B: HOXD-AS2 expression levels were decreased in human GC tissues and ANTs. Bars represent the ratio between the expression levels in GC tissues and ANTs (C/N, log scale) from the 79 patients. GC tissues expressed significantly lower levels of HOXD-AS2 than ANTs in the majority of patients (62.03%); C: Kaplan-Meier survival analysis showed that patients with low HOXD-AS2 expression had a poorer prognosis than those with high expression. Low: The expression level of HOXD-AS2 is lower than that of ANTs. High: The expression level of HOXD-AS2 is higher than that of ANTs. Expression levels were normalized to β-actin levels. The results are shown as the mean ± SD. aP < 0.05, two-tailed Student’s t-test. GC: Gastric cancer; ANTs: Adjacent non-cancerous tissues.
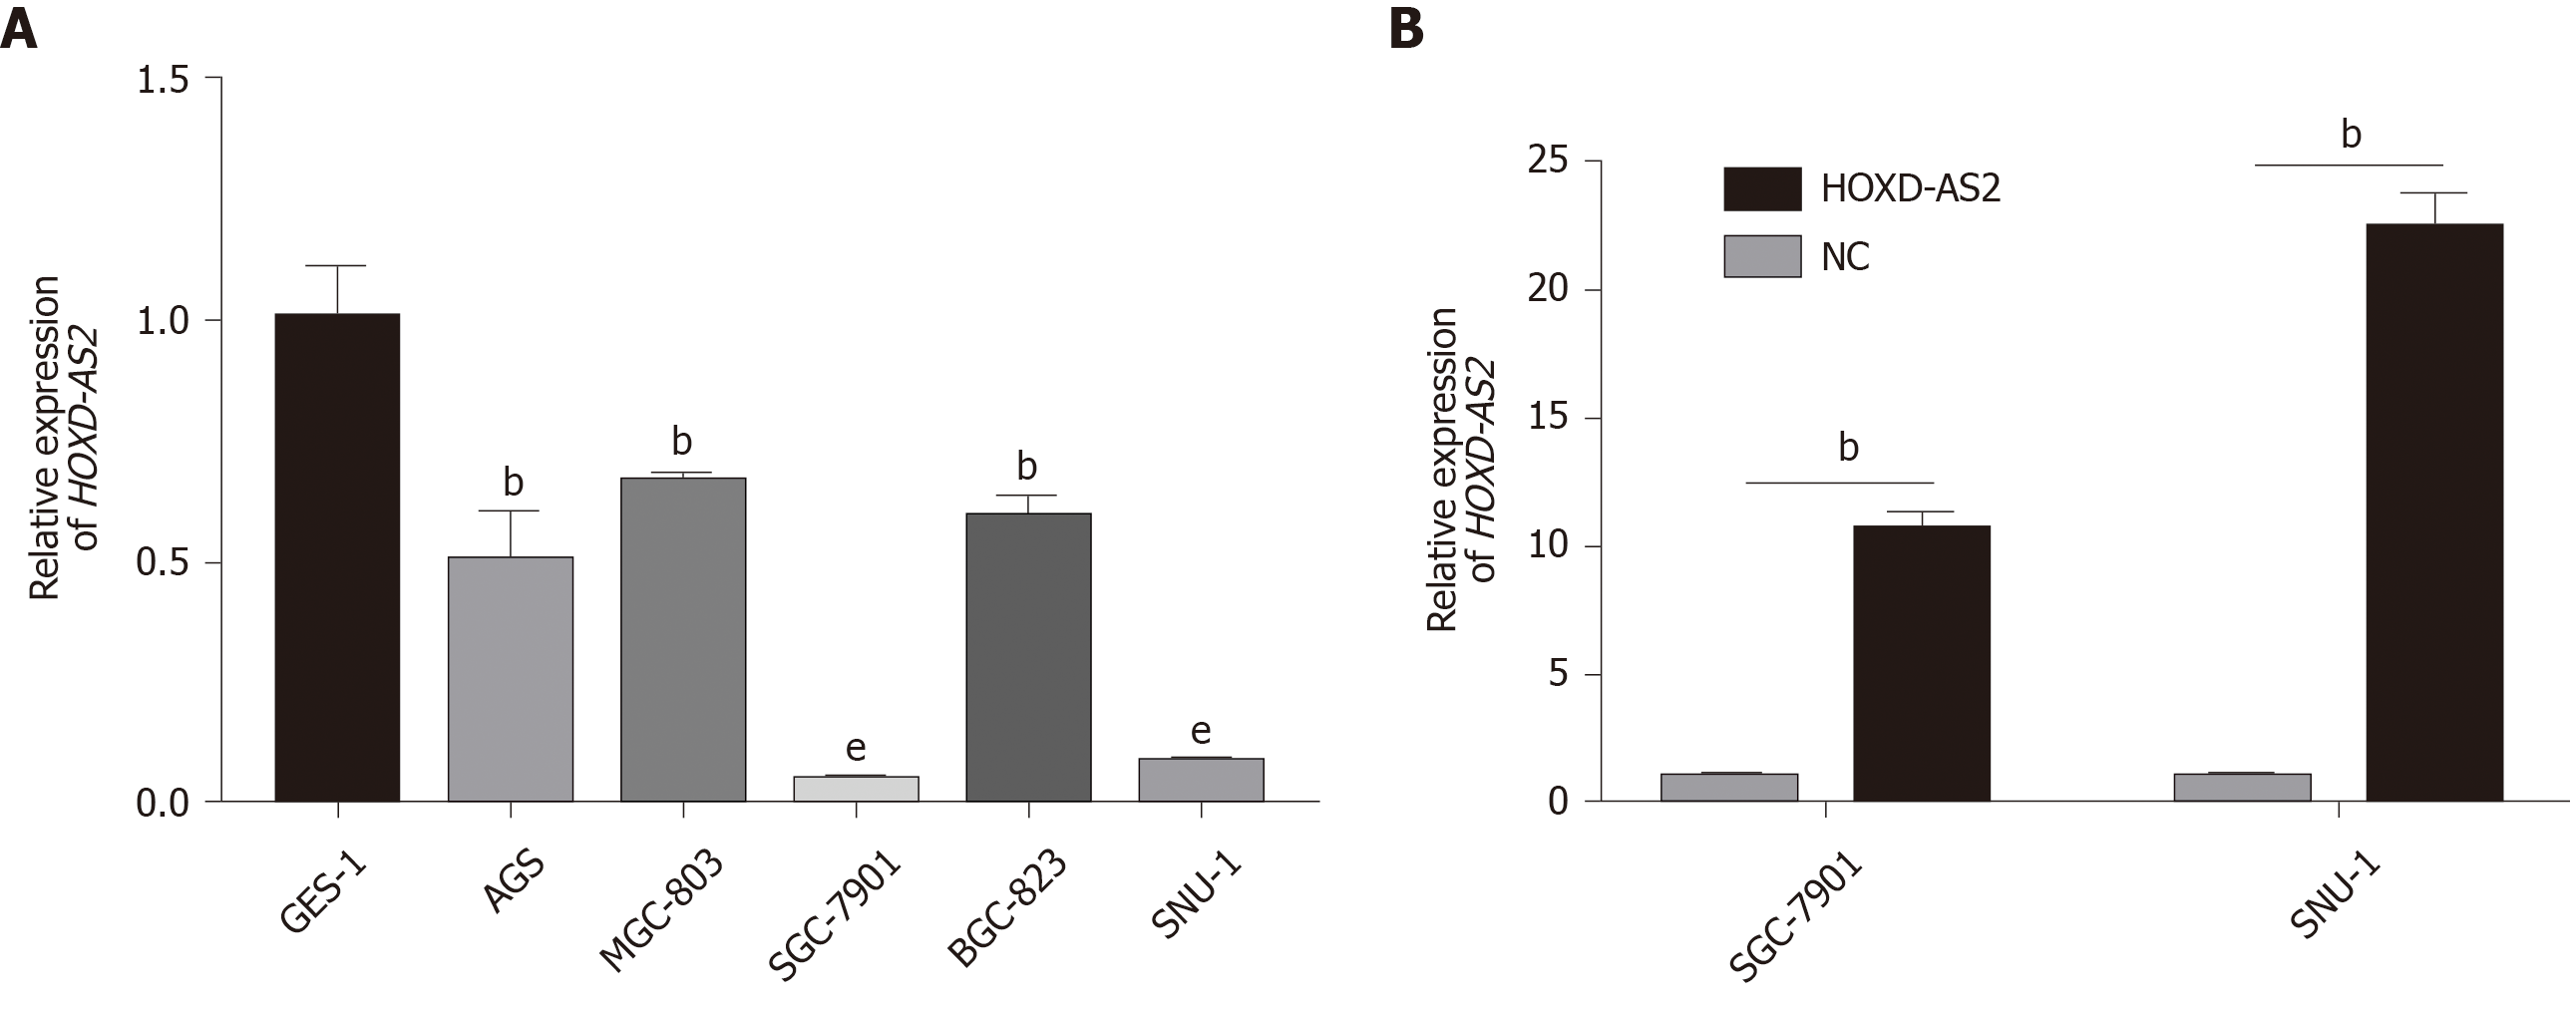
Figure 2 HOXD-AS2 is downregulated in gastric cancer cells.
A: The expression of HOXD-AS2 was downregulated in gastric cancer AGS, MGC-803, SGC-7901, BGC-823, and SNU-1 cells compared with gastric epithelial GES-1 cells; B: The expression of HOXD-AS2 in SGC-7901 and SNU-1 cells after transfections. The results are shown as the mean ± SD. bP < 0.01, eP < 0.001.
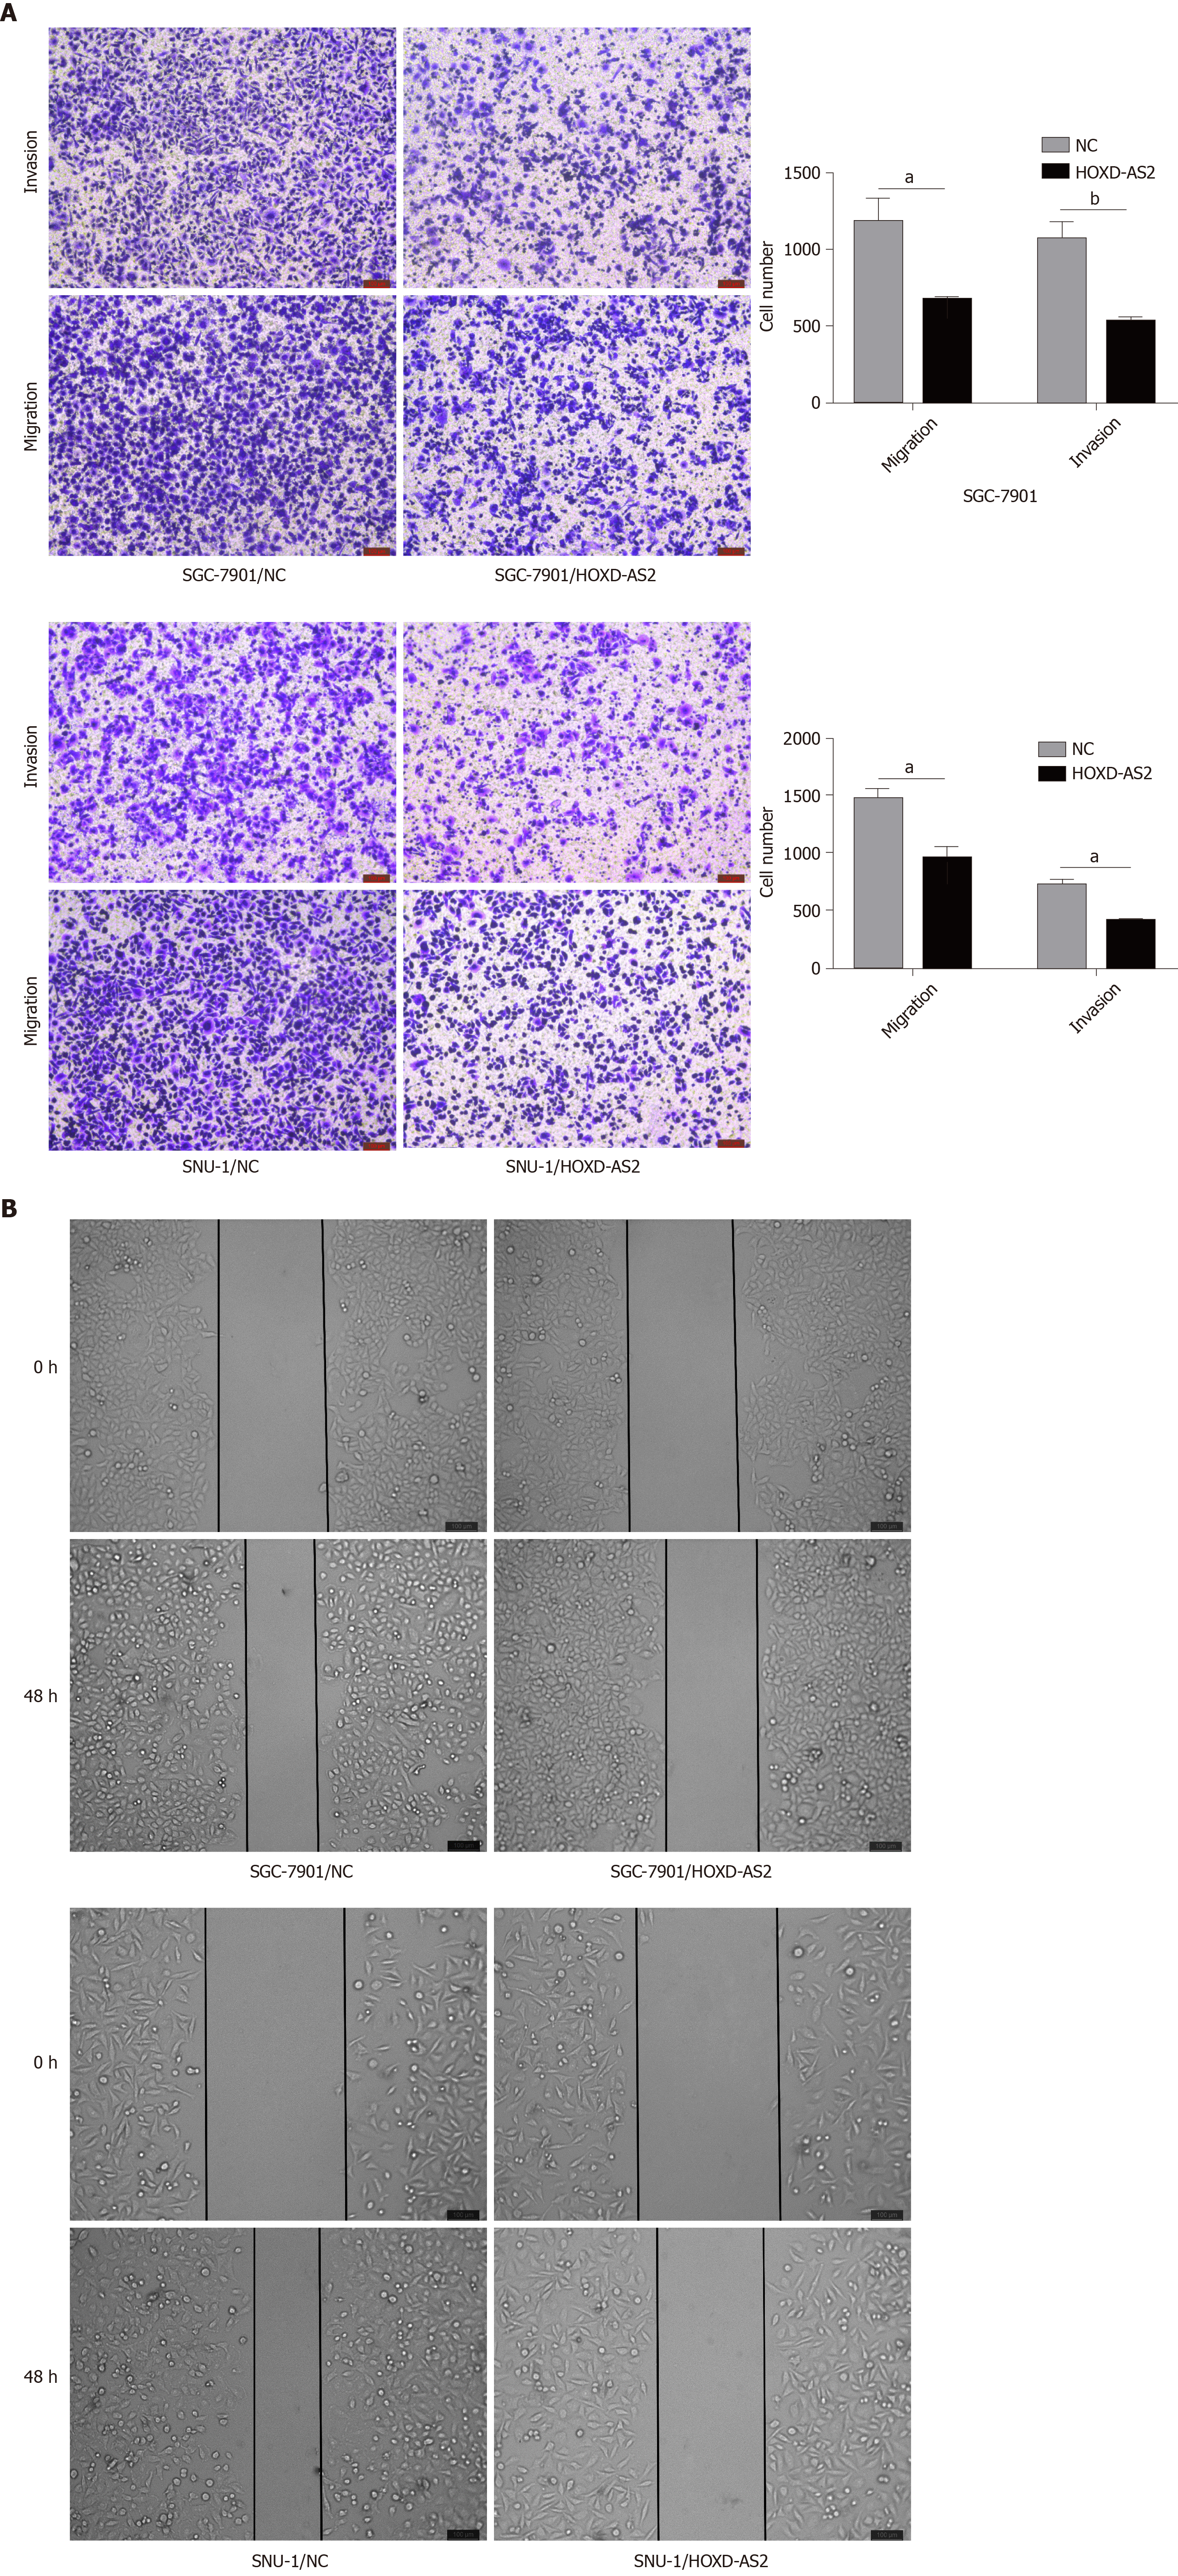
Figure 3 Overexpression of HOXD-AS2 inhibits gastric cancer cell migration and invasion in vitro.
A: Transwell assays were performed to detect the effect of HOXD-AS2 on the migration and invasion of SGC-7901 and SNU-1 cells. The results revealed that overexpression of HOXD-AS2 inhibited the migration and invasion of SGC-7901 and SNU-1 cells; B: Wound healing assay further showed that overexpression of HOXD-AS2 inhibited gastric cancer cell migration and invasion. aP < 0.05, bP < 0.01. Data are shown as the mean ± SD. All the experiments were performed in triplicate.
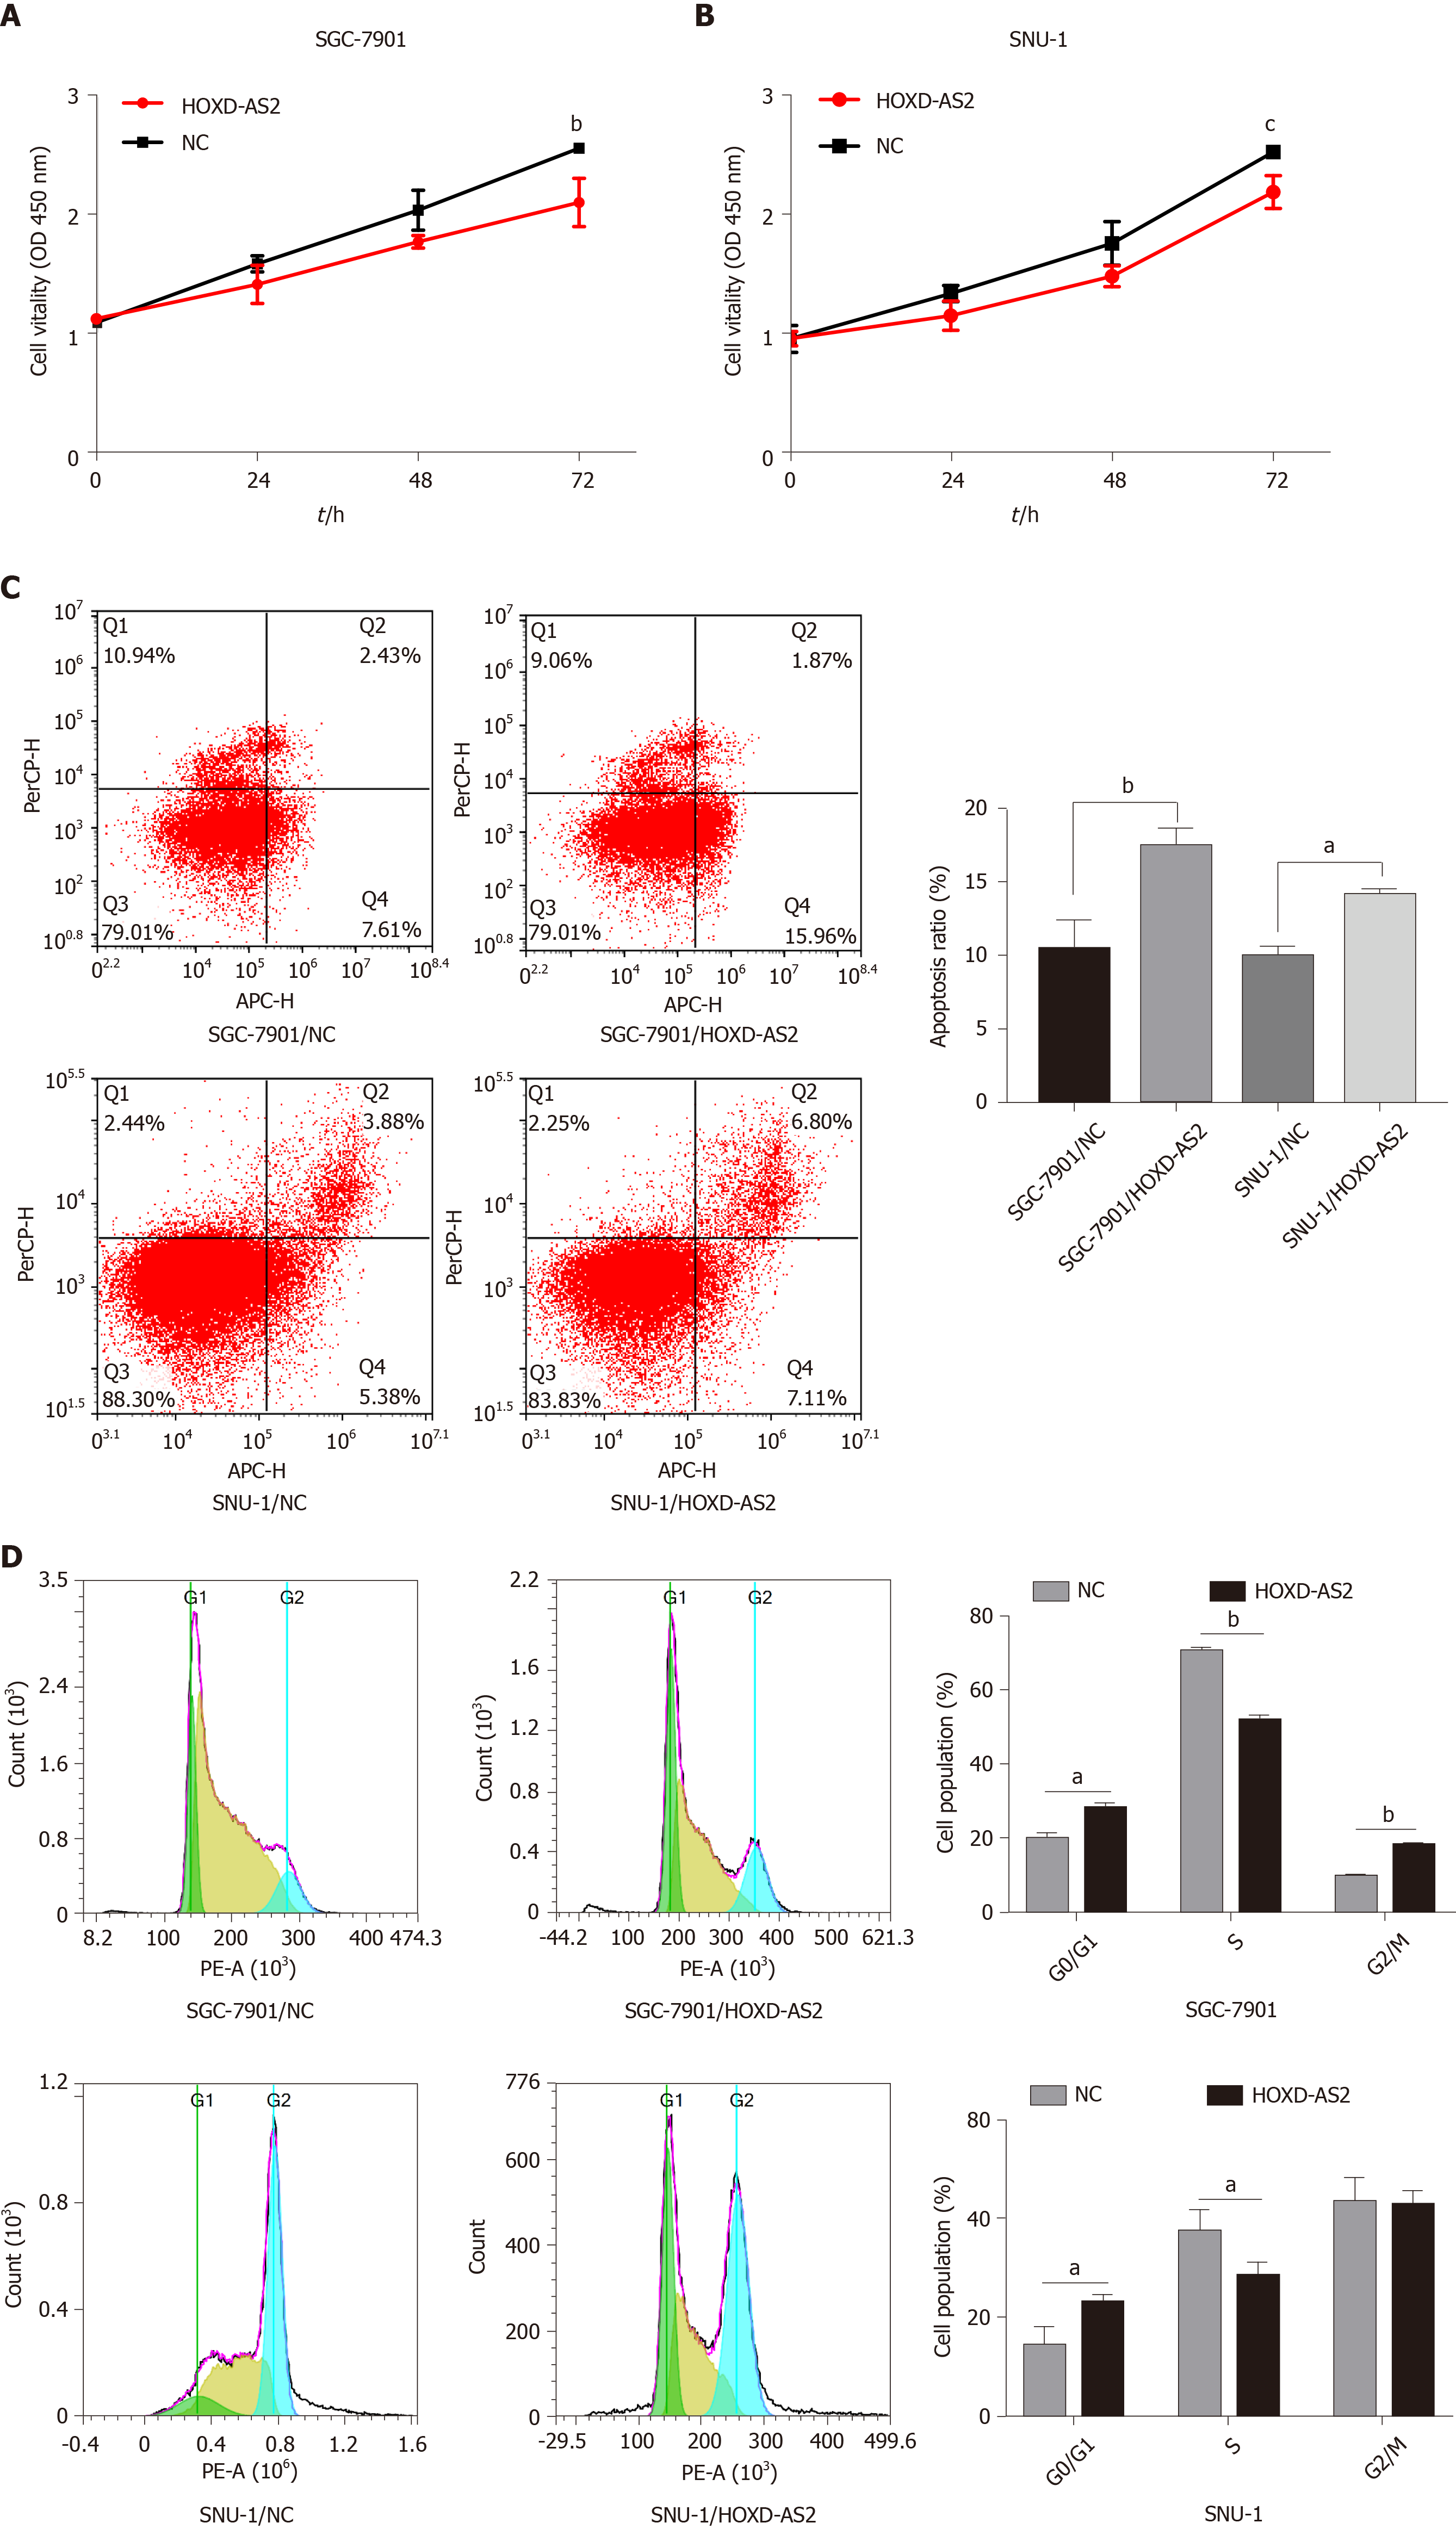
Figure 4 Overexpression of HOXD-AS2 inhibits gastric cancer cell proliferation and cell cycle progression and promotes apoptosis in vitro.
A and B: The effect of HOXD-AS2 on cell proliferation was determined by cell counting kit-8 assay. Cell proliferation was decreased after overexpression of HOXD-AS2 in SGC-7901 (P = 0.0019) and SNU-1 (P < 0.001) cells; C: Flow cytometry was used to detect the percentage of apoptotic cells in the pc-HOXD-AS2 and the control groups. The percentage of apoptotic cells was increased after overexpression of HOXD-AS2 in SGC-7901 (P = 0.007) and SNU-1 (P = 0.021) cells; D: The effect of HOXD-AS2 on cell cycle was measured by flow cytometry after 7-AAD staining in SGC-7901 and SNU-1 cells. aP < 0.05, bP < 0.01, eP < 0.001.
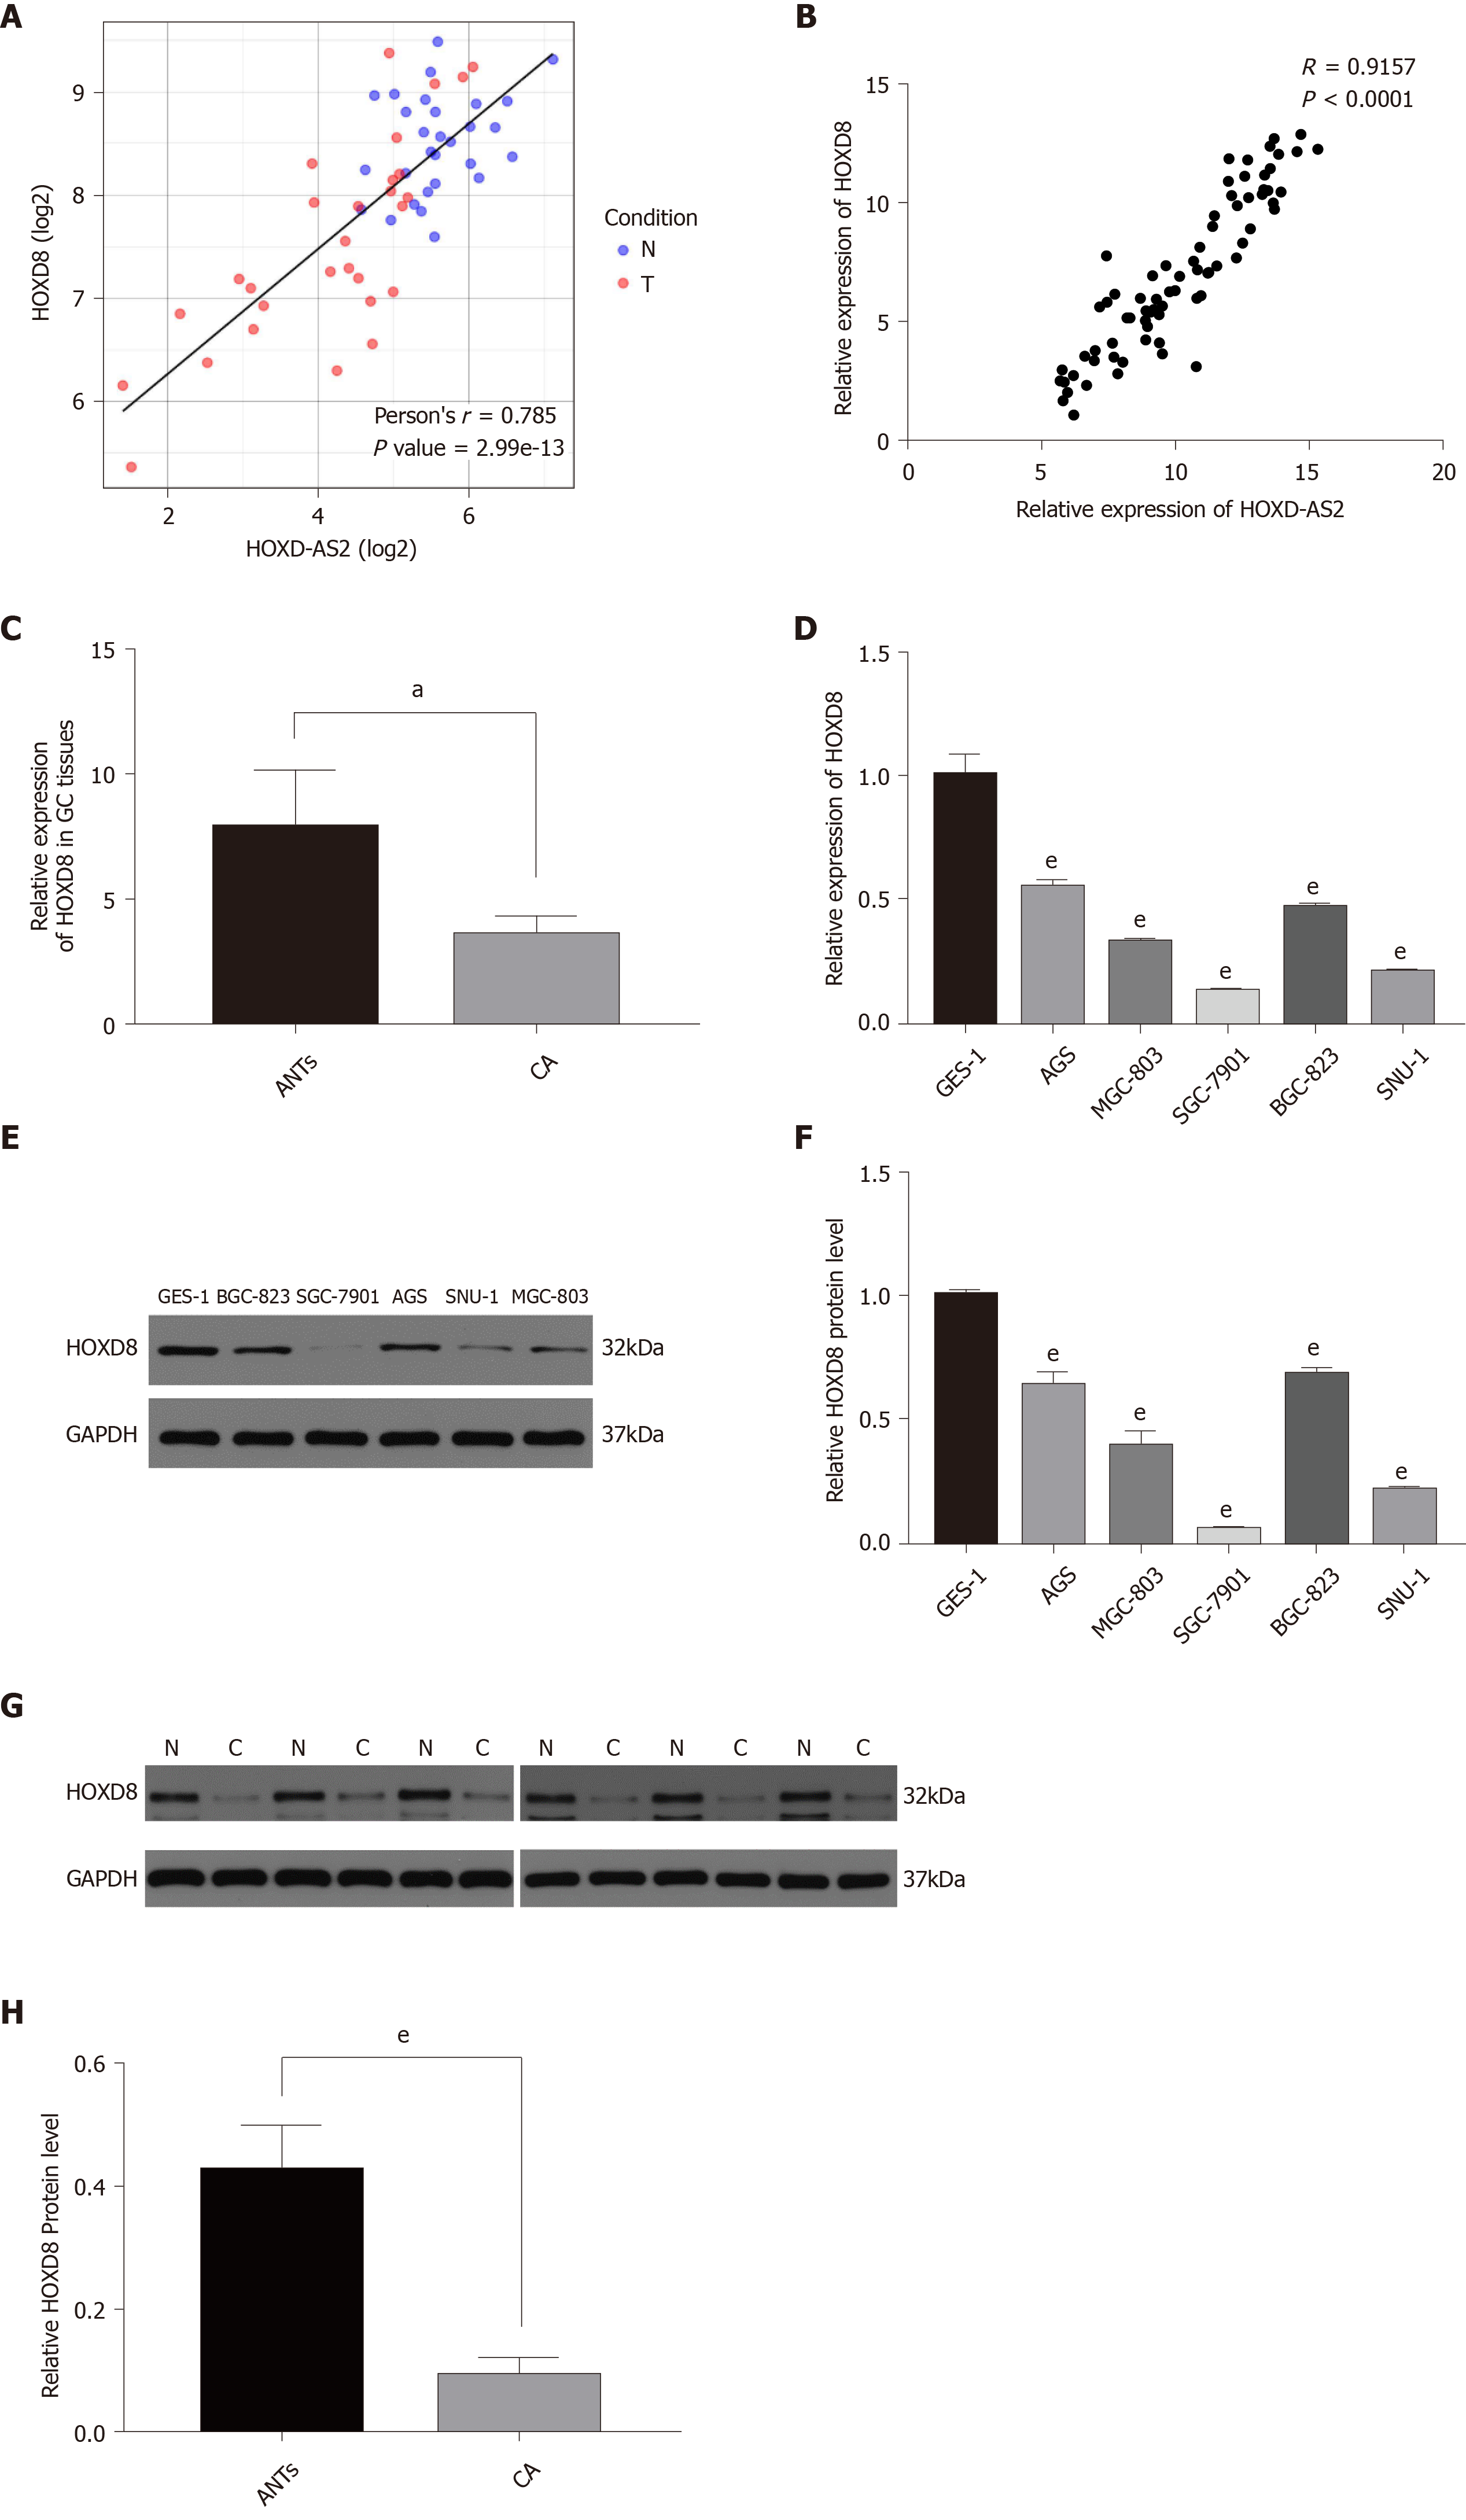
Figure 5 HOXD8 is downregulated in human gastric cancer tissues and positively correlated with HOXD-AS2 expression.
A: CirclncRNAnet database analysis results show that HOXD-AS2 is positively correlated with HOXD8 (r = 0.785, P < 0.05); B: Bivariate correlation analysis of the relationship between HOXD-AS2 and HOXD8 expression levels, and the resulting Spearman correlation coefficient was calculated as 0.9157 with P < 0.0001 (n = 79); C and D: The relative mRNA expression level of HOXD8 was decreased in human gastric cancer (GC) tissues (P = 0.048); E and F: The relative protein expression levels of HOXD8 were decreased in human GC cells (P < 0.001); G and H: The relative protein expression level of HOXD8 was decreased in human GC tissues (P < 0.001). The results are shown as the mean ± SD. aP < 0.05, eP < 0.001. GC: Gastric cancer; ANTs: Adjacent non-cancerous tissues.
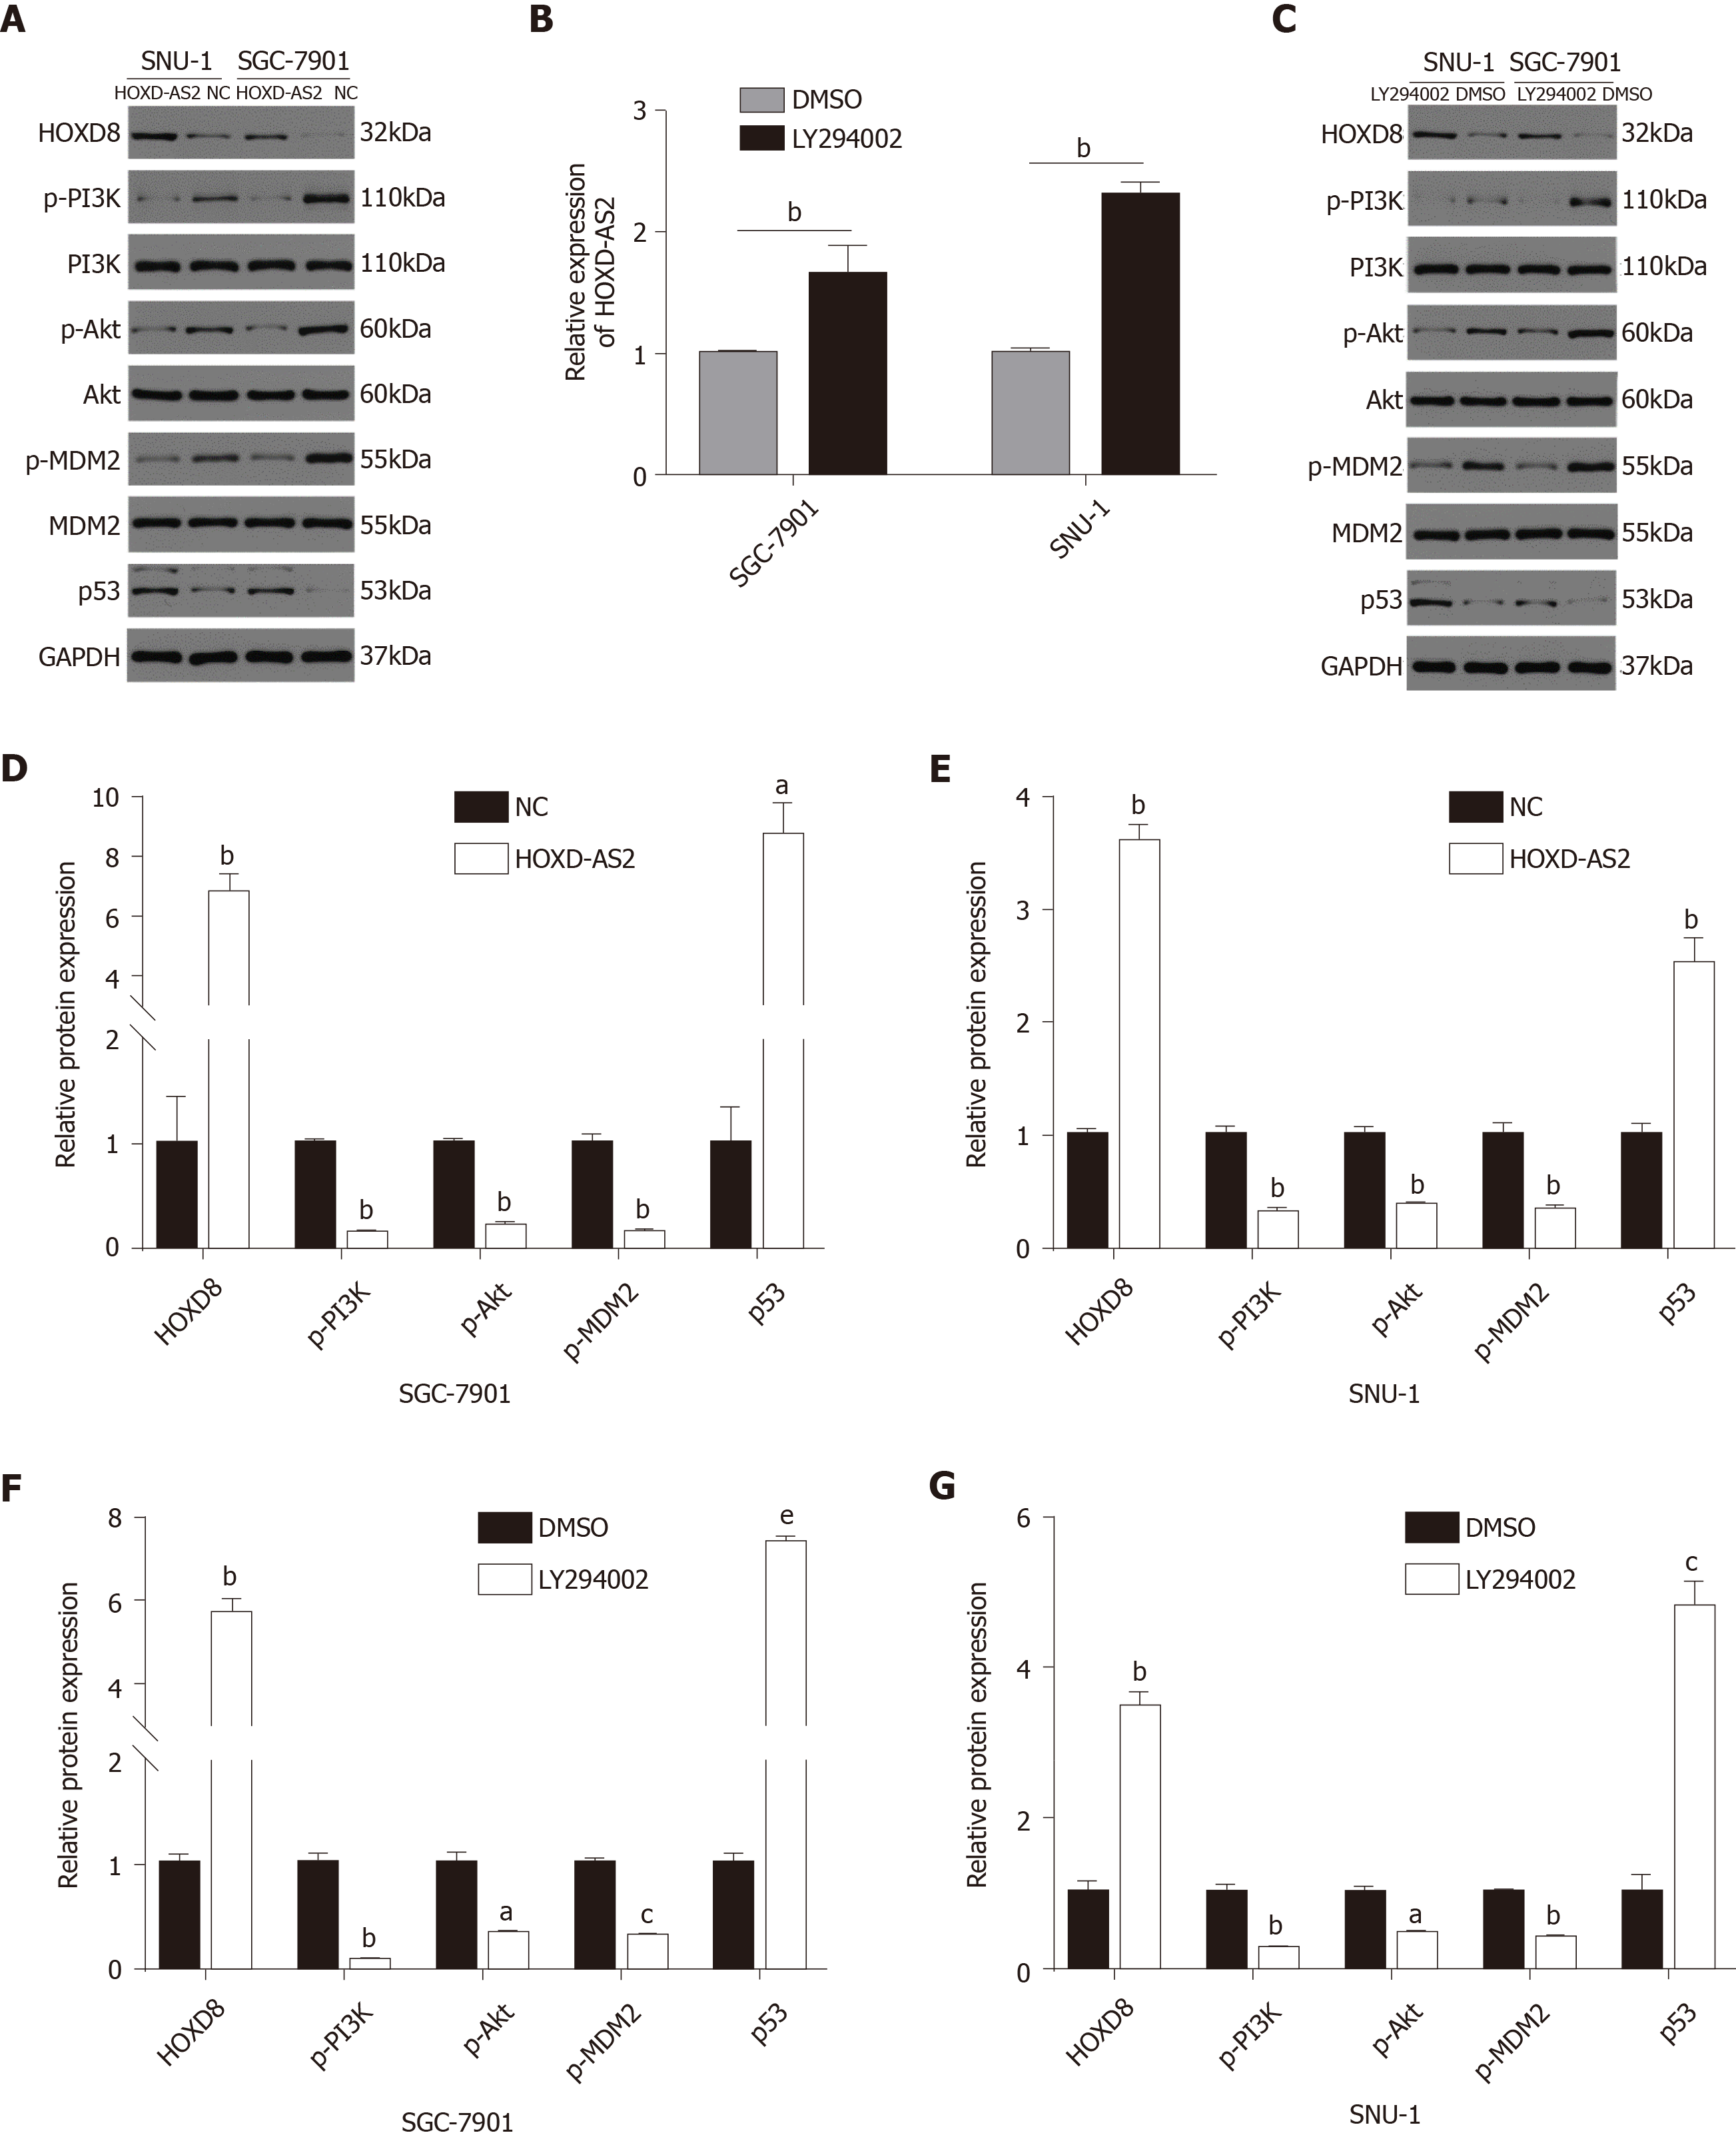
Figure 6 Overexpression of HOXD-AS2 inhibits the PI3K/Akt signaling pathway.
A, D, and E: Overexpression of HOXD-AS2 reduced p-PI3K, p-Akt, and p-MDM2 protein levels, and increased p53 and HOXD8 protein levels; B: HOXD-AS2 mRNA levels were significantly increased following treatment with LY294002 in SGC-7901 (P = 0.009) and SNU-1 (P = 0.001) cells for 48 h. Expression levels were normalized to GAPDH levels. The results are shown as the mean ± SD; C, F, and G: HOXD8 and p53 protein levels were significantly increased but p-PI3K, p-Akt, and p-MDM2 protein levels were significantly reduced following treatment with LY294002 in SGC-790 and SNU-1 cells for 48 h. aP < 0.05, bP < 0.01, eP < 0.001.
- Citation: Yao L, Ye PC, Tan W, Luo YJ, Xiang WP, Liu ZL, Fu ZM, Lu F, Tang LH, Xiao JW. Decreased expression of the long non-coding RNA HOXD-AS2 promotes gastric cancer progression by targeting HOXD8 and activating PI3K/Akt signaling pathway. World J Gastrointest Oncol 2020; 12(11): 1237-1254
- URL: https://www.wjgnet.com/1948-5204/full/v12/i11/1237.htm
- DOI: https://dx.doi.org/10.4251/wjgo.v12.i11.1237


