Copyright
©The Author(s) 2019.
World J Gastrointest Oncol. Apr 15, 2019; 11(4): 310-321
Published online Apr 15, 2019. doi: 10.4251/wjgo.v11.i4.310
Published online Apr 15, 2019. doi: 10.4251/wjgo.v11.i4.310
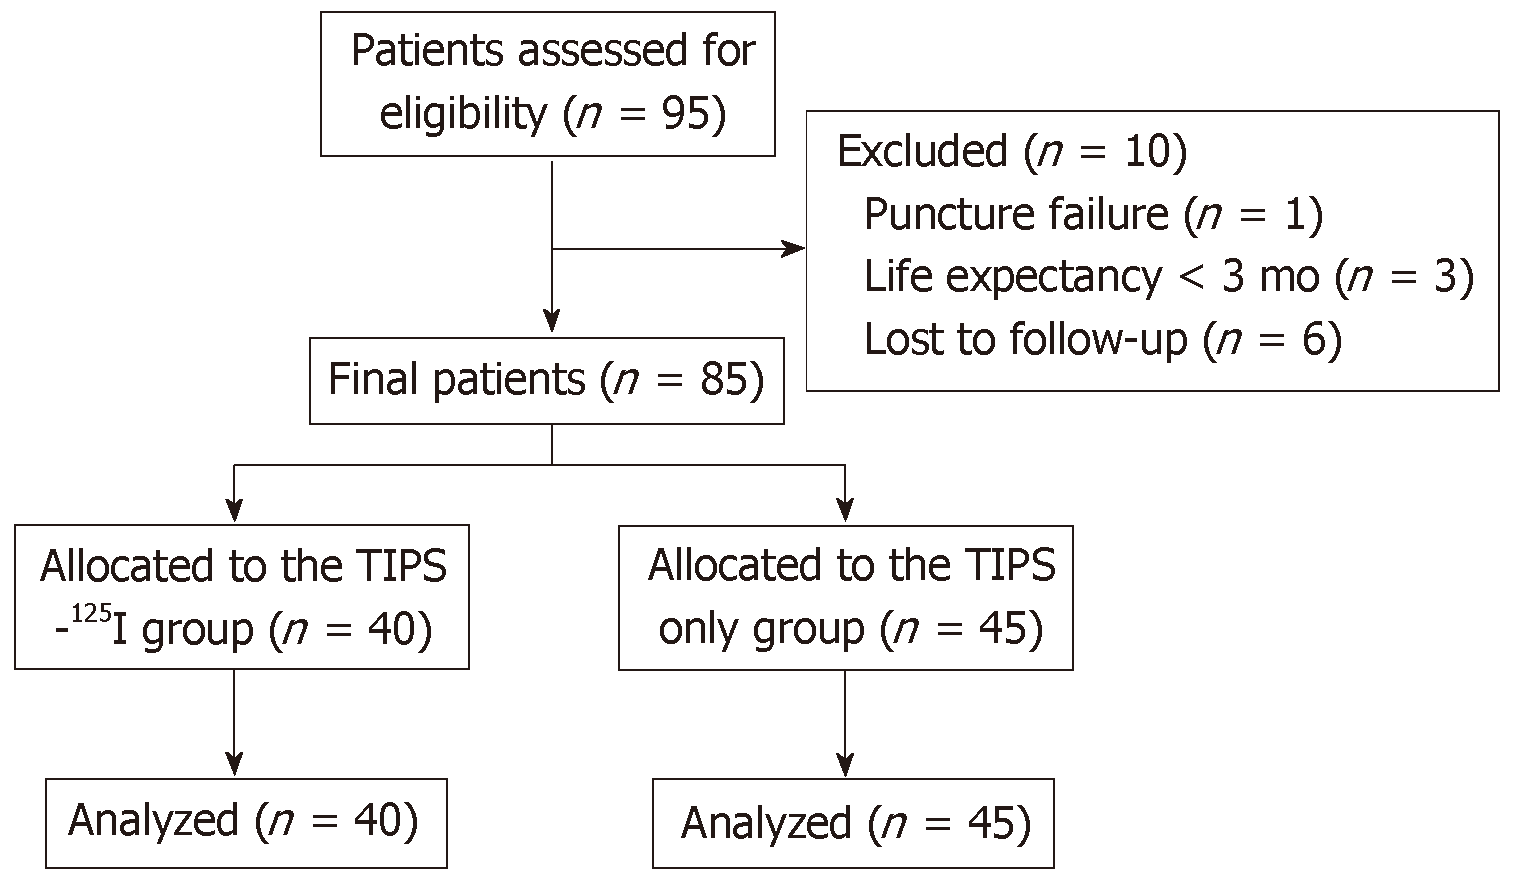
Figure 1 Study design and flow chart.
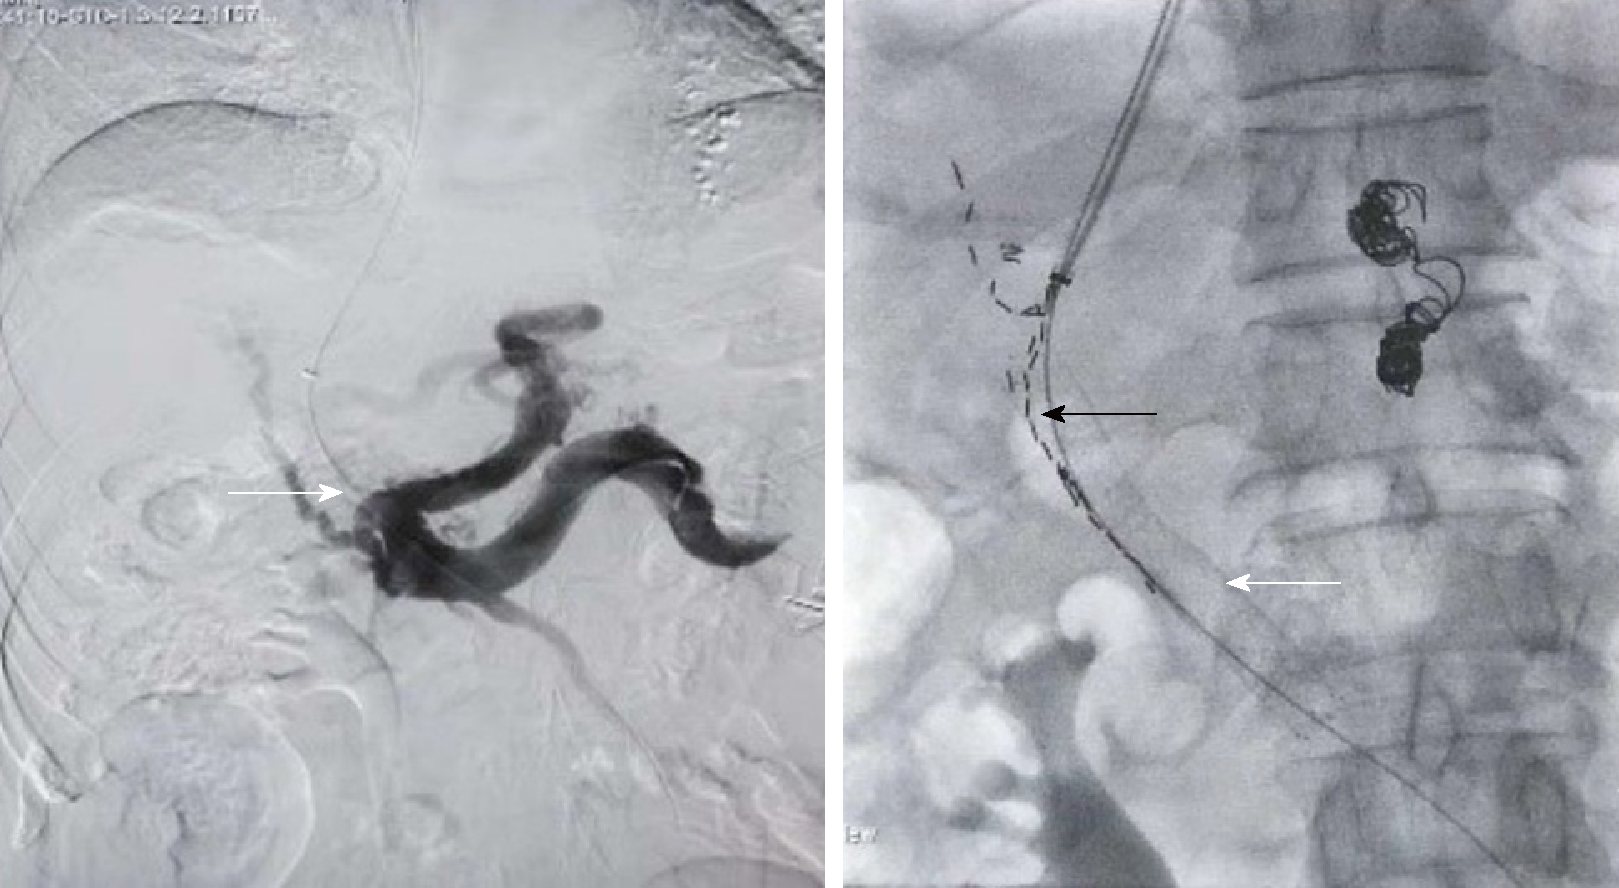
Figure 2 The two pictures in the process of the operation.
This patient was with primary liver cancer and main portal vein tumor thrombus. The left picture showed the portal vein was blocked completely (the white arrow) by the tumor thrombus before the transjugular intrahepatic portosystemic shunt. The right picture showed the stent which was placed in the portal vein (the white arrow) and the 125I which was placed between the stent and the tumor thrombus (the black arrow).
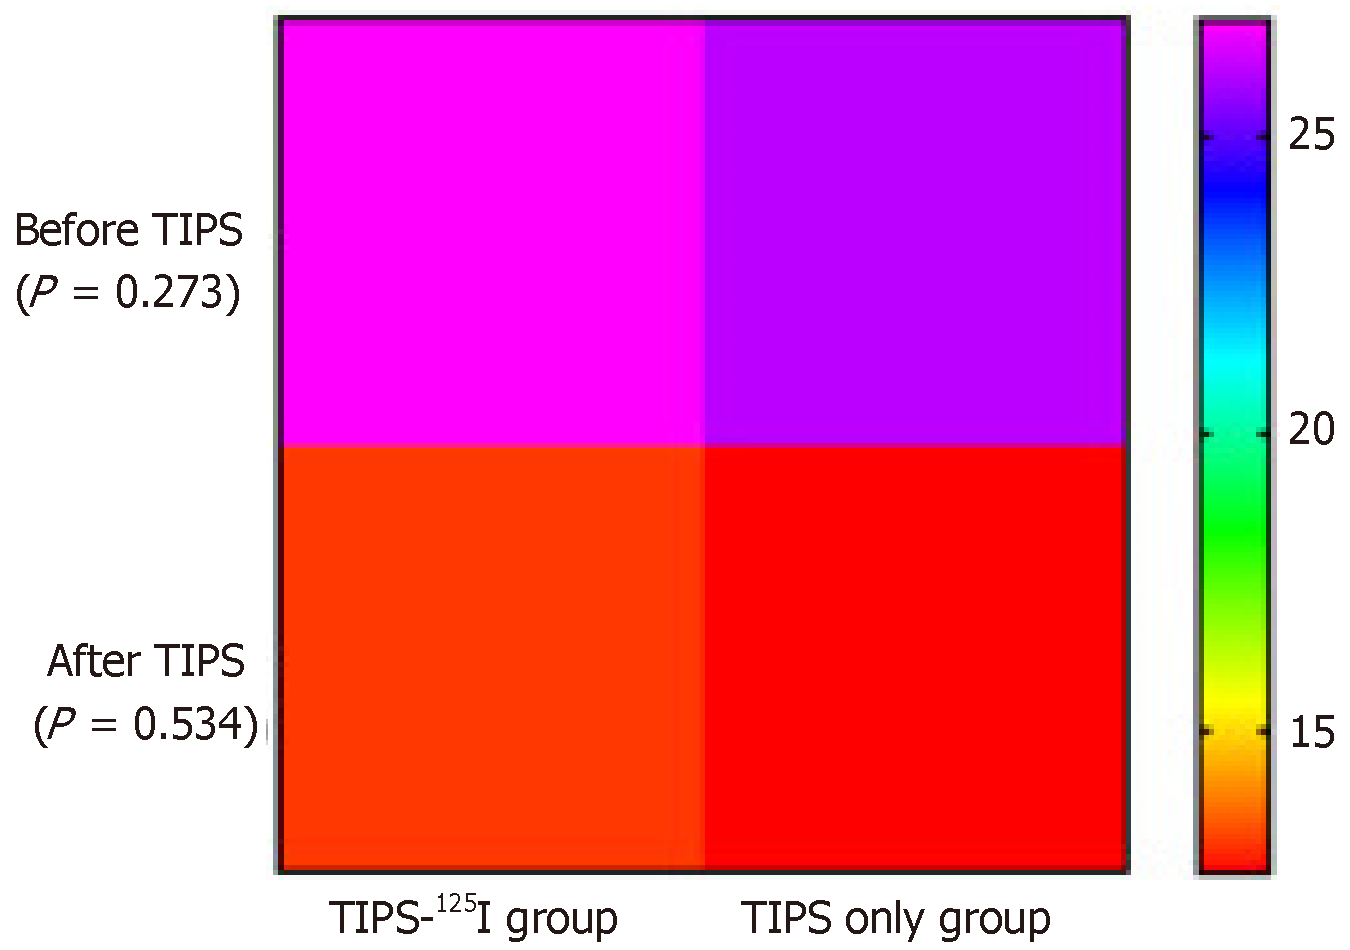
Figure 3 Heat map.
Comparison of portosystemic pressure gradient (PPG) measurements before and after operation between the transjugular intrahepatic portosystemic shunt (TIPS)-125I group and TIPS only group. Student’s t test was used to compare PPG, PPG at each time point were non-difference between groups. TIPS: Transjugular intrahepatic portosystemic shunt.
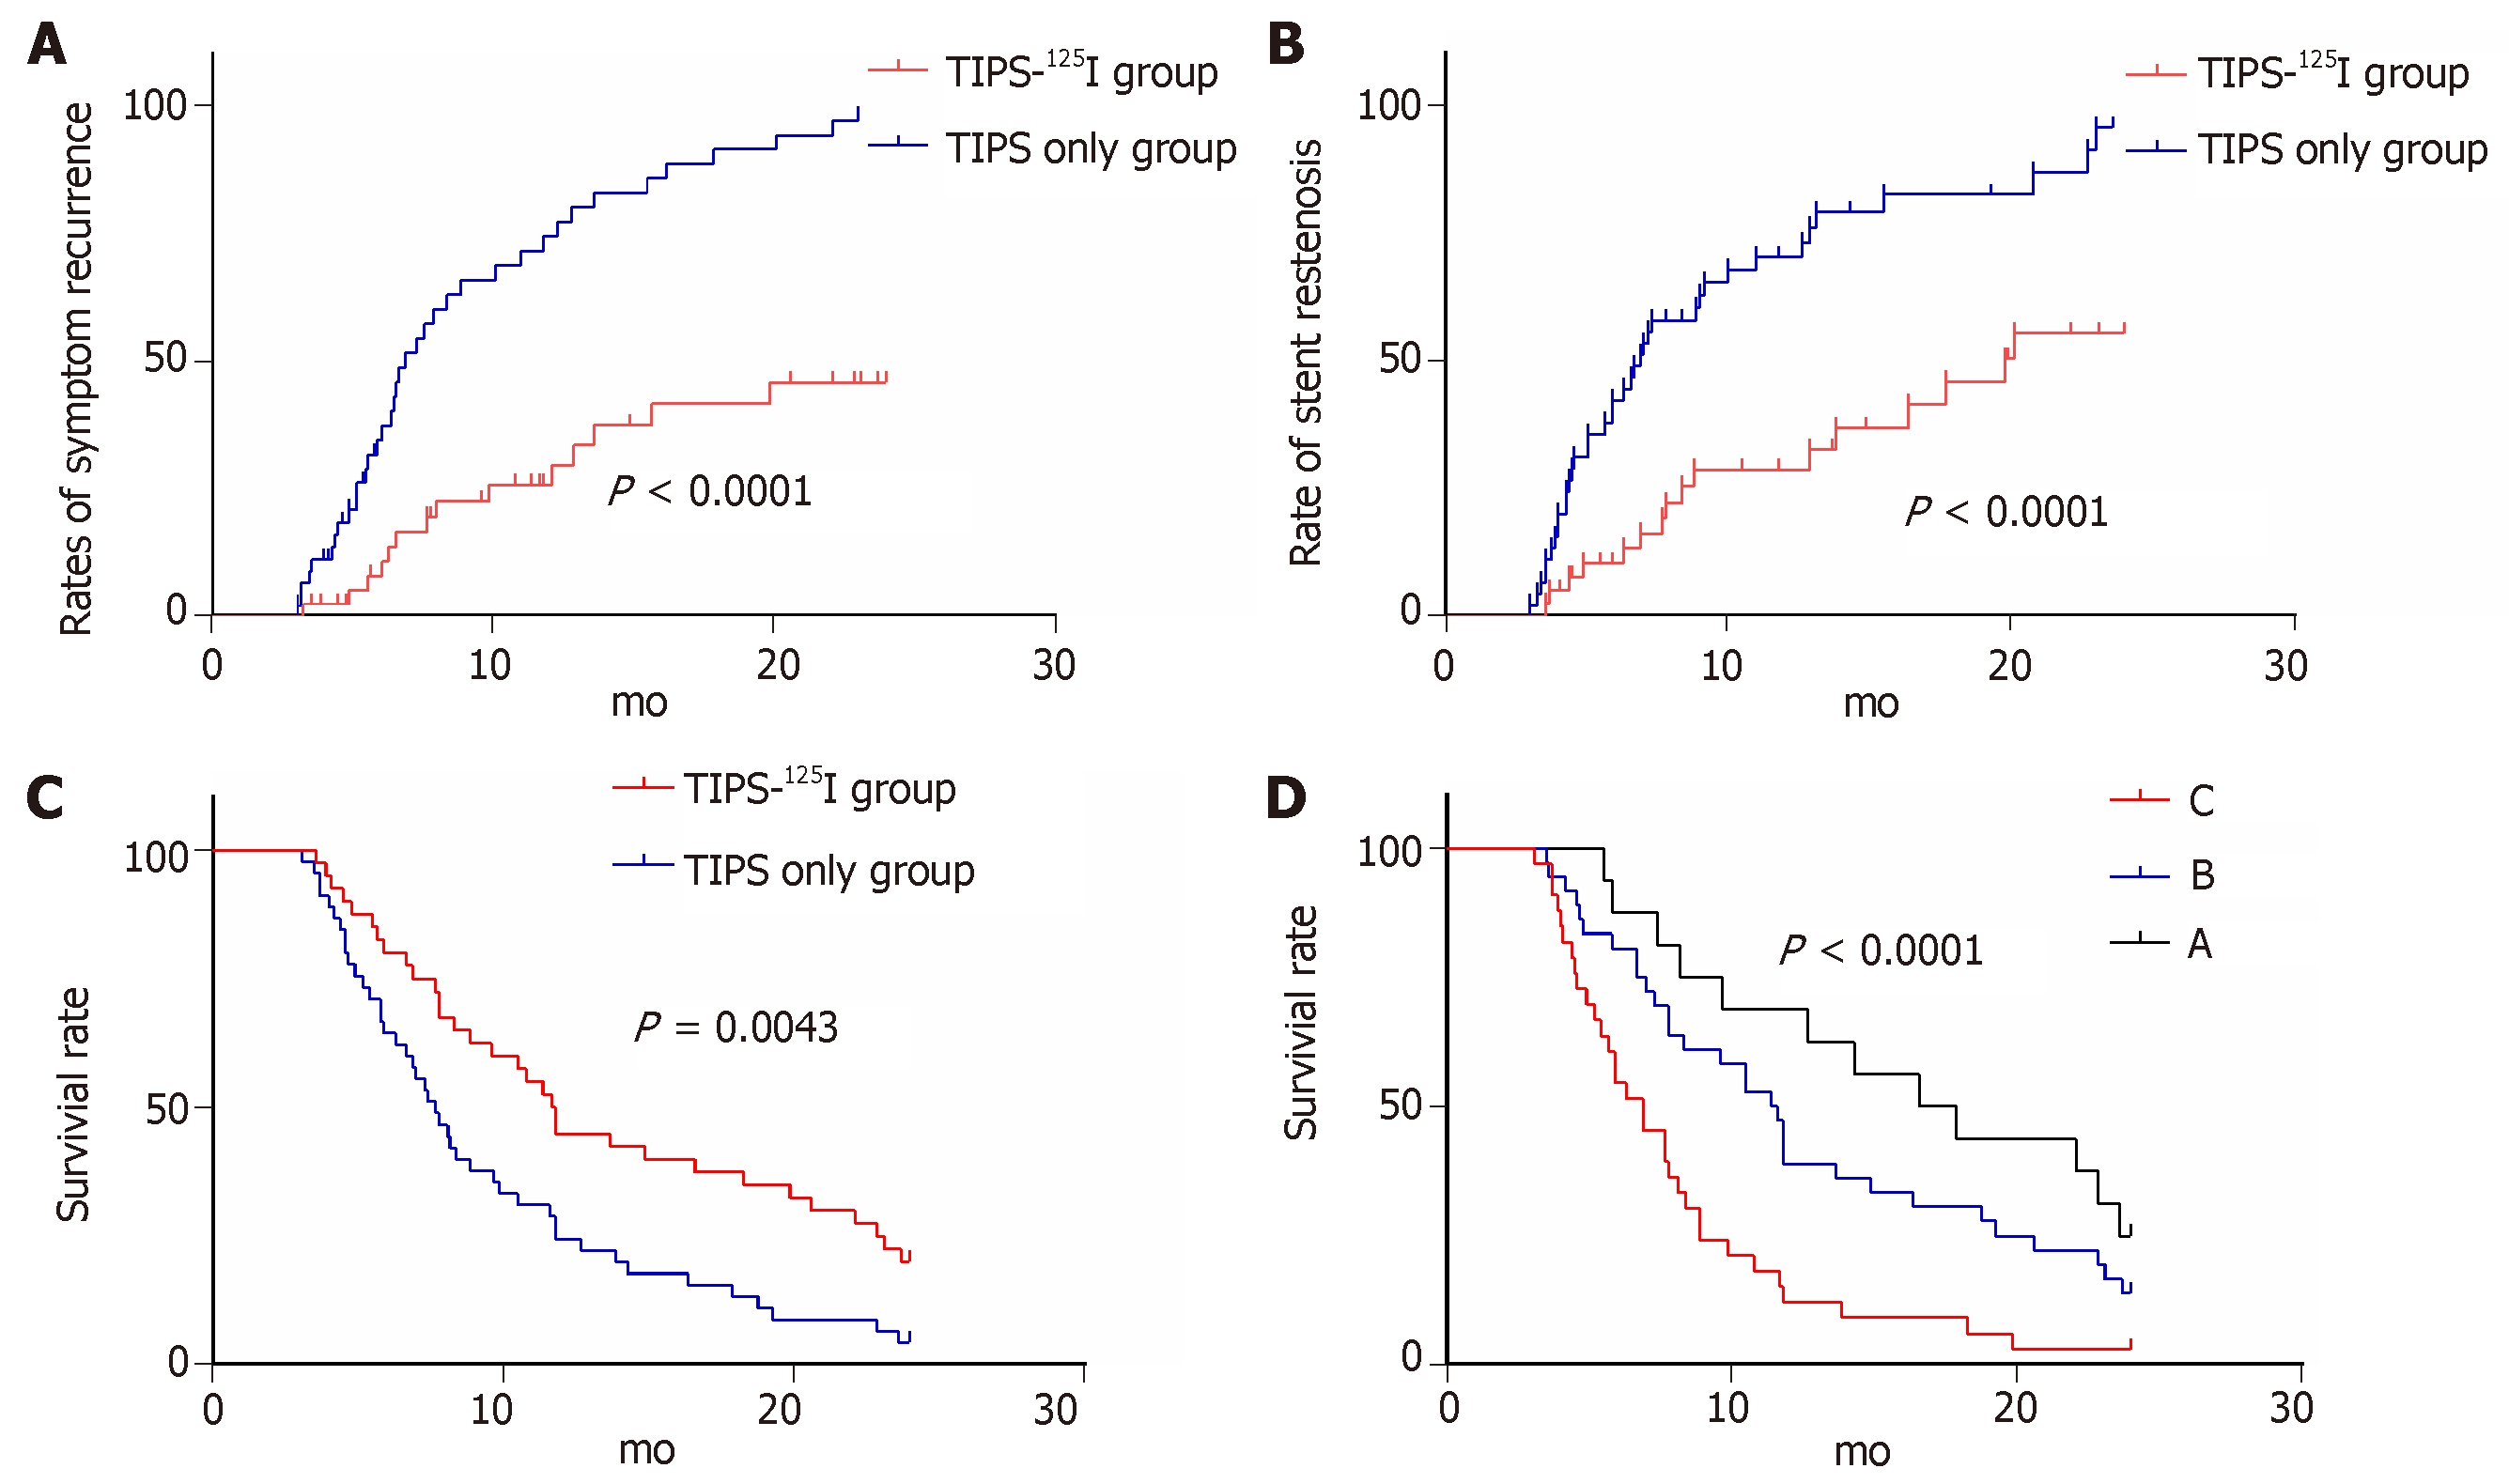
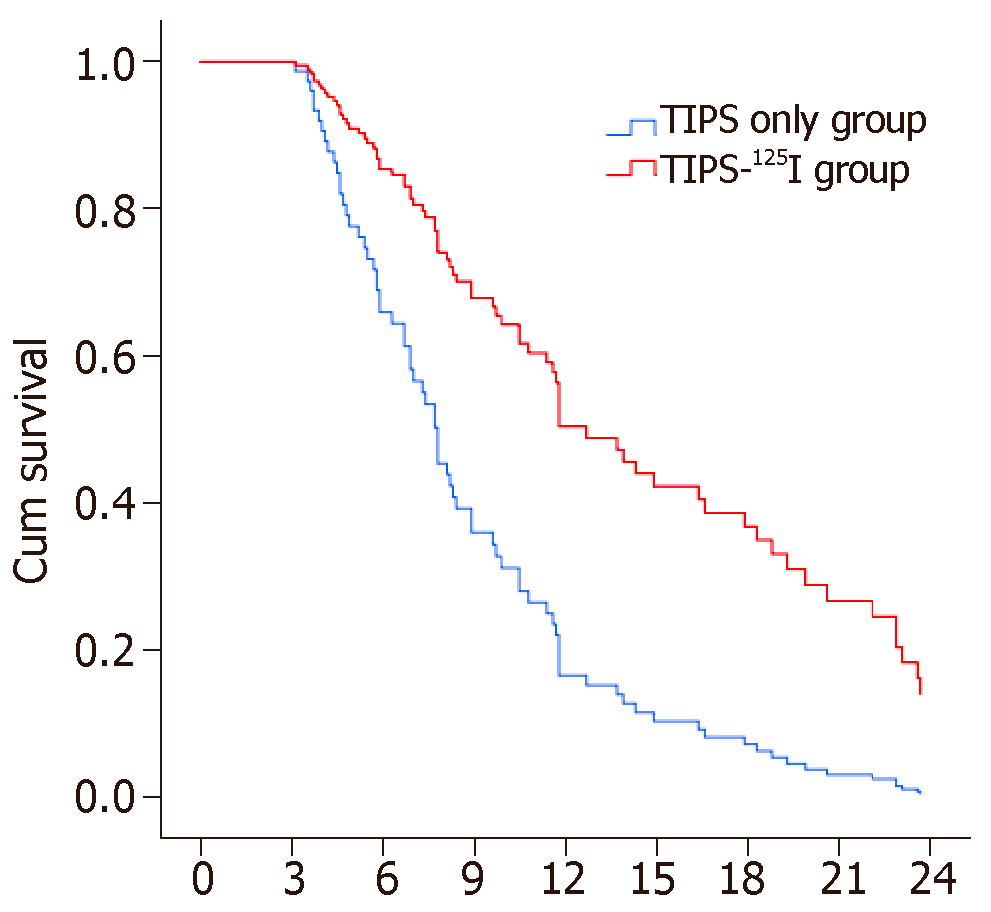
Figure 4 Kaplan-Meier curves of post-operation symptom recurrence, stent stenosis and survival.
A: Rate of symptom recurrence; B: Rate of stent stenosis; C: Survival rate on treatment; D: Survival rate on Child-Pugh classification. TIPS: Transjugular intrahepatic portosystemic shunt.
Figure 5 COX plots of overall survival in epatocellular carcinoma patients with main portal vein tumor thrombosis.
TIPS: Transjugular intrahepatic portosystemic shunt.
- Citation: Zhang Y, Wu YF, Yue ZD, Zhao HW, Wang L, Fan ZH, He FL, Wang T, Liu FQ. Iodine-125 implantation with transjugular intrahepatic portosystemic shunt for main portal vein tumor thrombus. World J Gastrointest Oncol 2019; 11(4): 310-321
- URL: https://www.wjgnet.com/1948-5204/full/v11/i4/310.htm
- DOI: https://dx.doi.org/10.4251/wjgo.v11.i4.310


