Copyright
©The Author(s) 2019.
World J Gastrointest Oncol. Mar 15, 2019; 11(3): 195-207
Published online Mar 15, 2019. doi: 10.4251/wjgo.v11.i3.195
Published online Mar 15, 2019. doi: 10.4251/wjgo.v11.i3.195
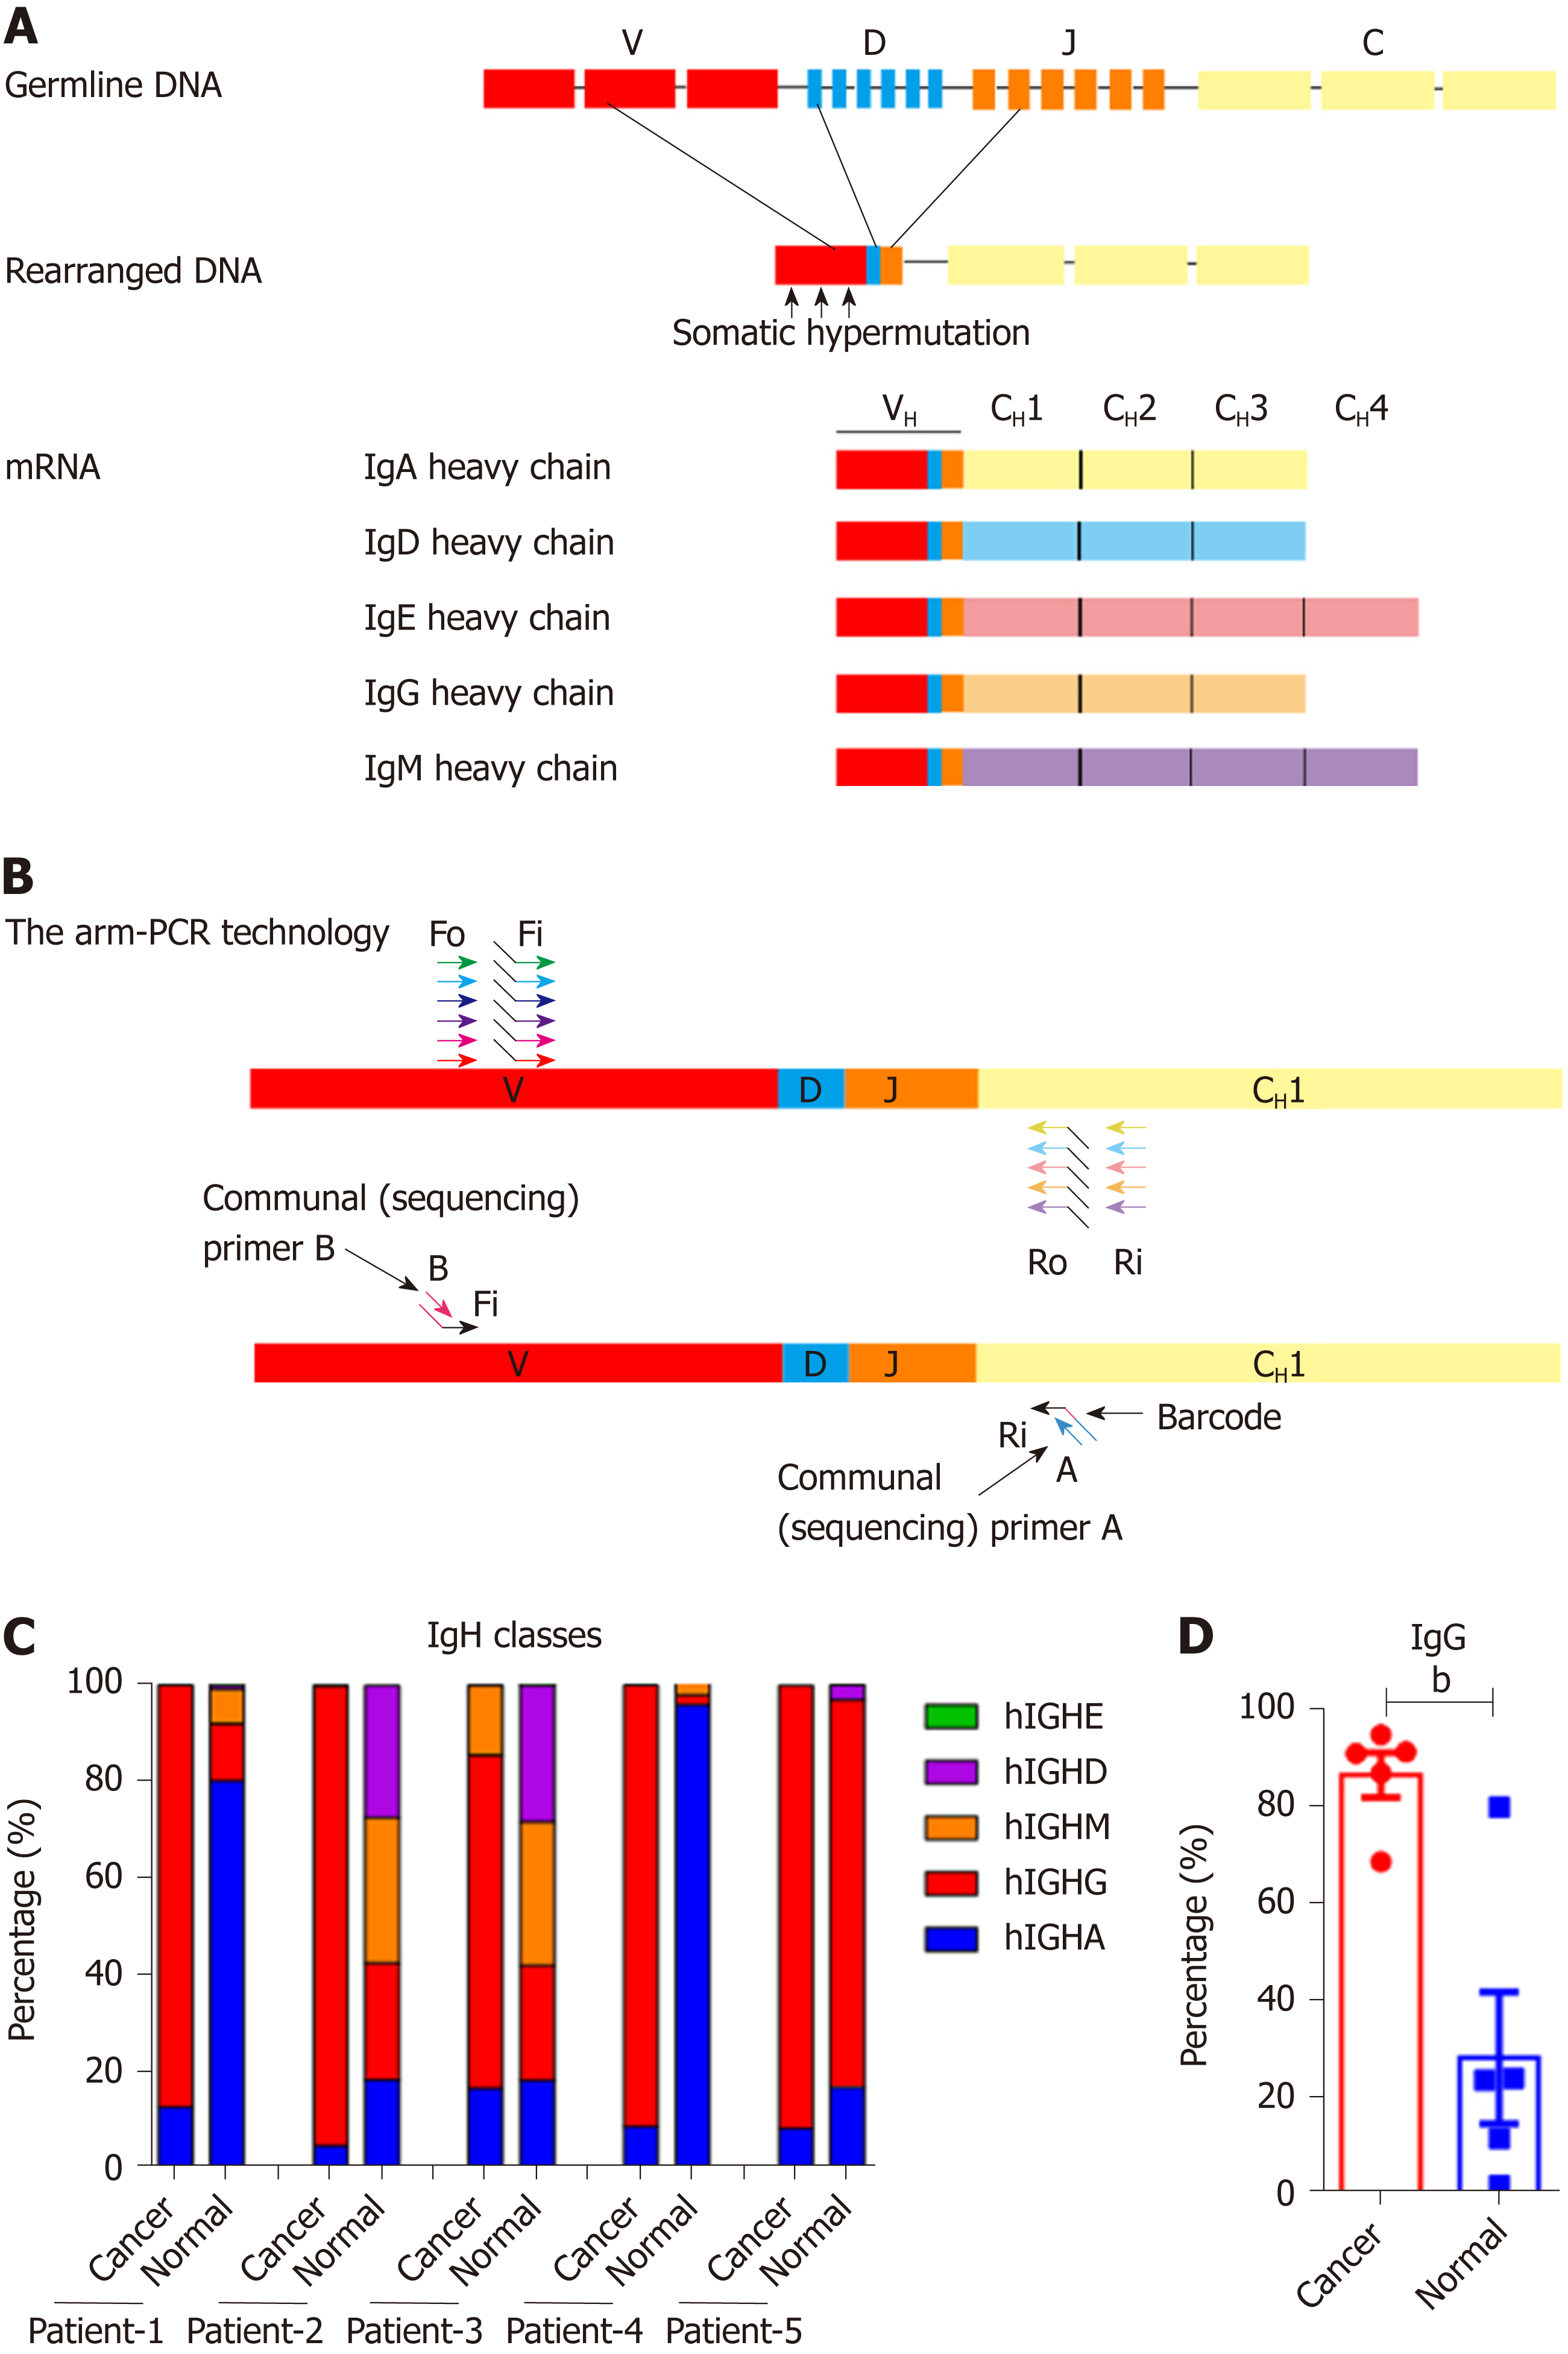
Figure 1 Proportions of Ig classes in colon cancer cells and normal epithelial cells.
A: The process of immunoglobulin heavy chain (IgH) gene rearrangement and the structure of rearranged IgH; B: Design of the primers for the arm-polymerase chain reaction (PCR) technology used to amplify the immune repertoire. During the first round of PCR, multiple forward primers Fo (forward-out) and Fi (forward-in) were used to target V genes. The reverse primers Ro (reverse-out) and Ri (reverse-in) were targeted to the 5 classes of IgH. The Fi and Ri primers included sequencing adaptors. The second round PCR was carried out with communal primers B and A. The barcodes were in between primer A and the C gene specific primers; C: Proportions of the five IgH classes in cancer and normal cells; D: The proportion of IgG in the 5 patients. Small horizontal lines indicate the mean ± SD. Statistical significance was determined by a two-tailed unpaired Student’s t-test. bP < 0.01.
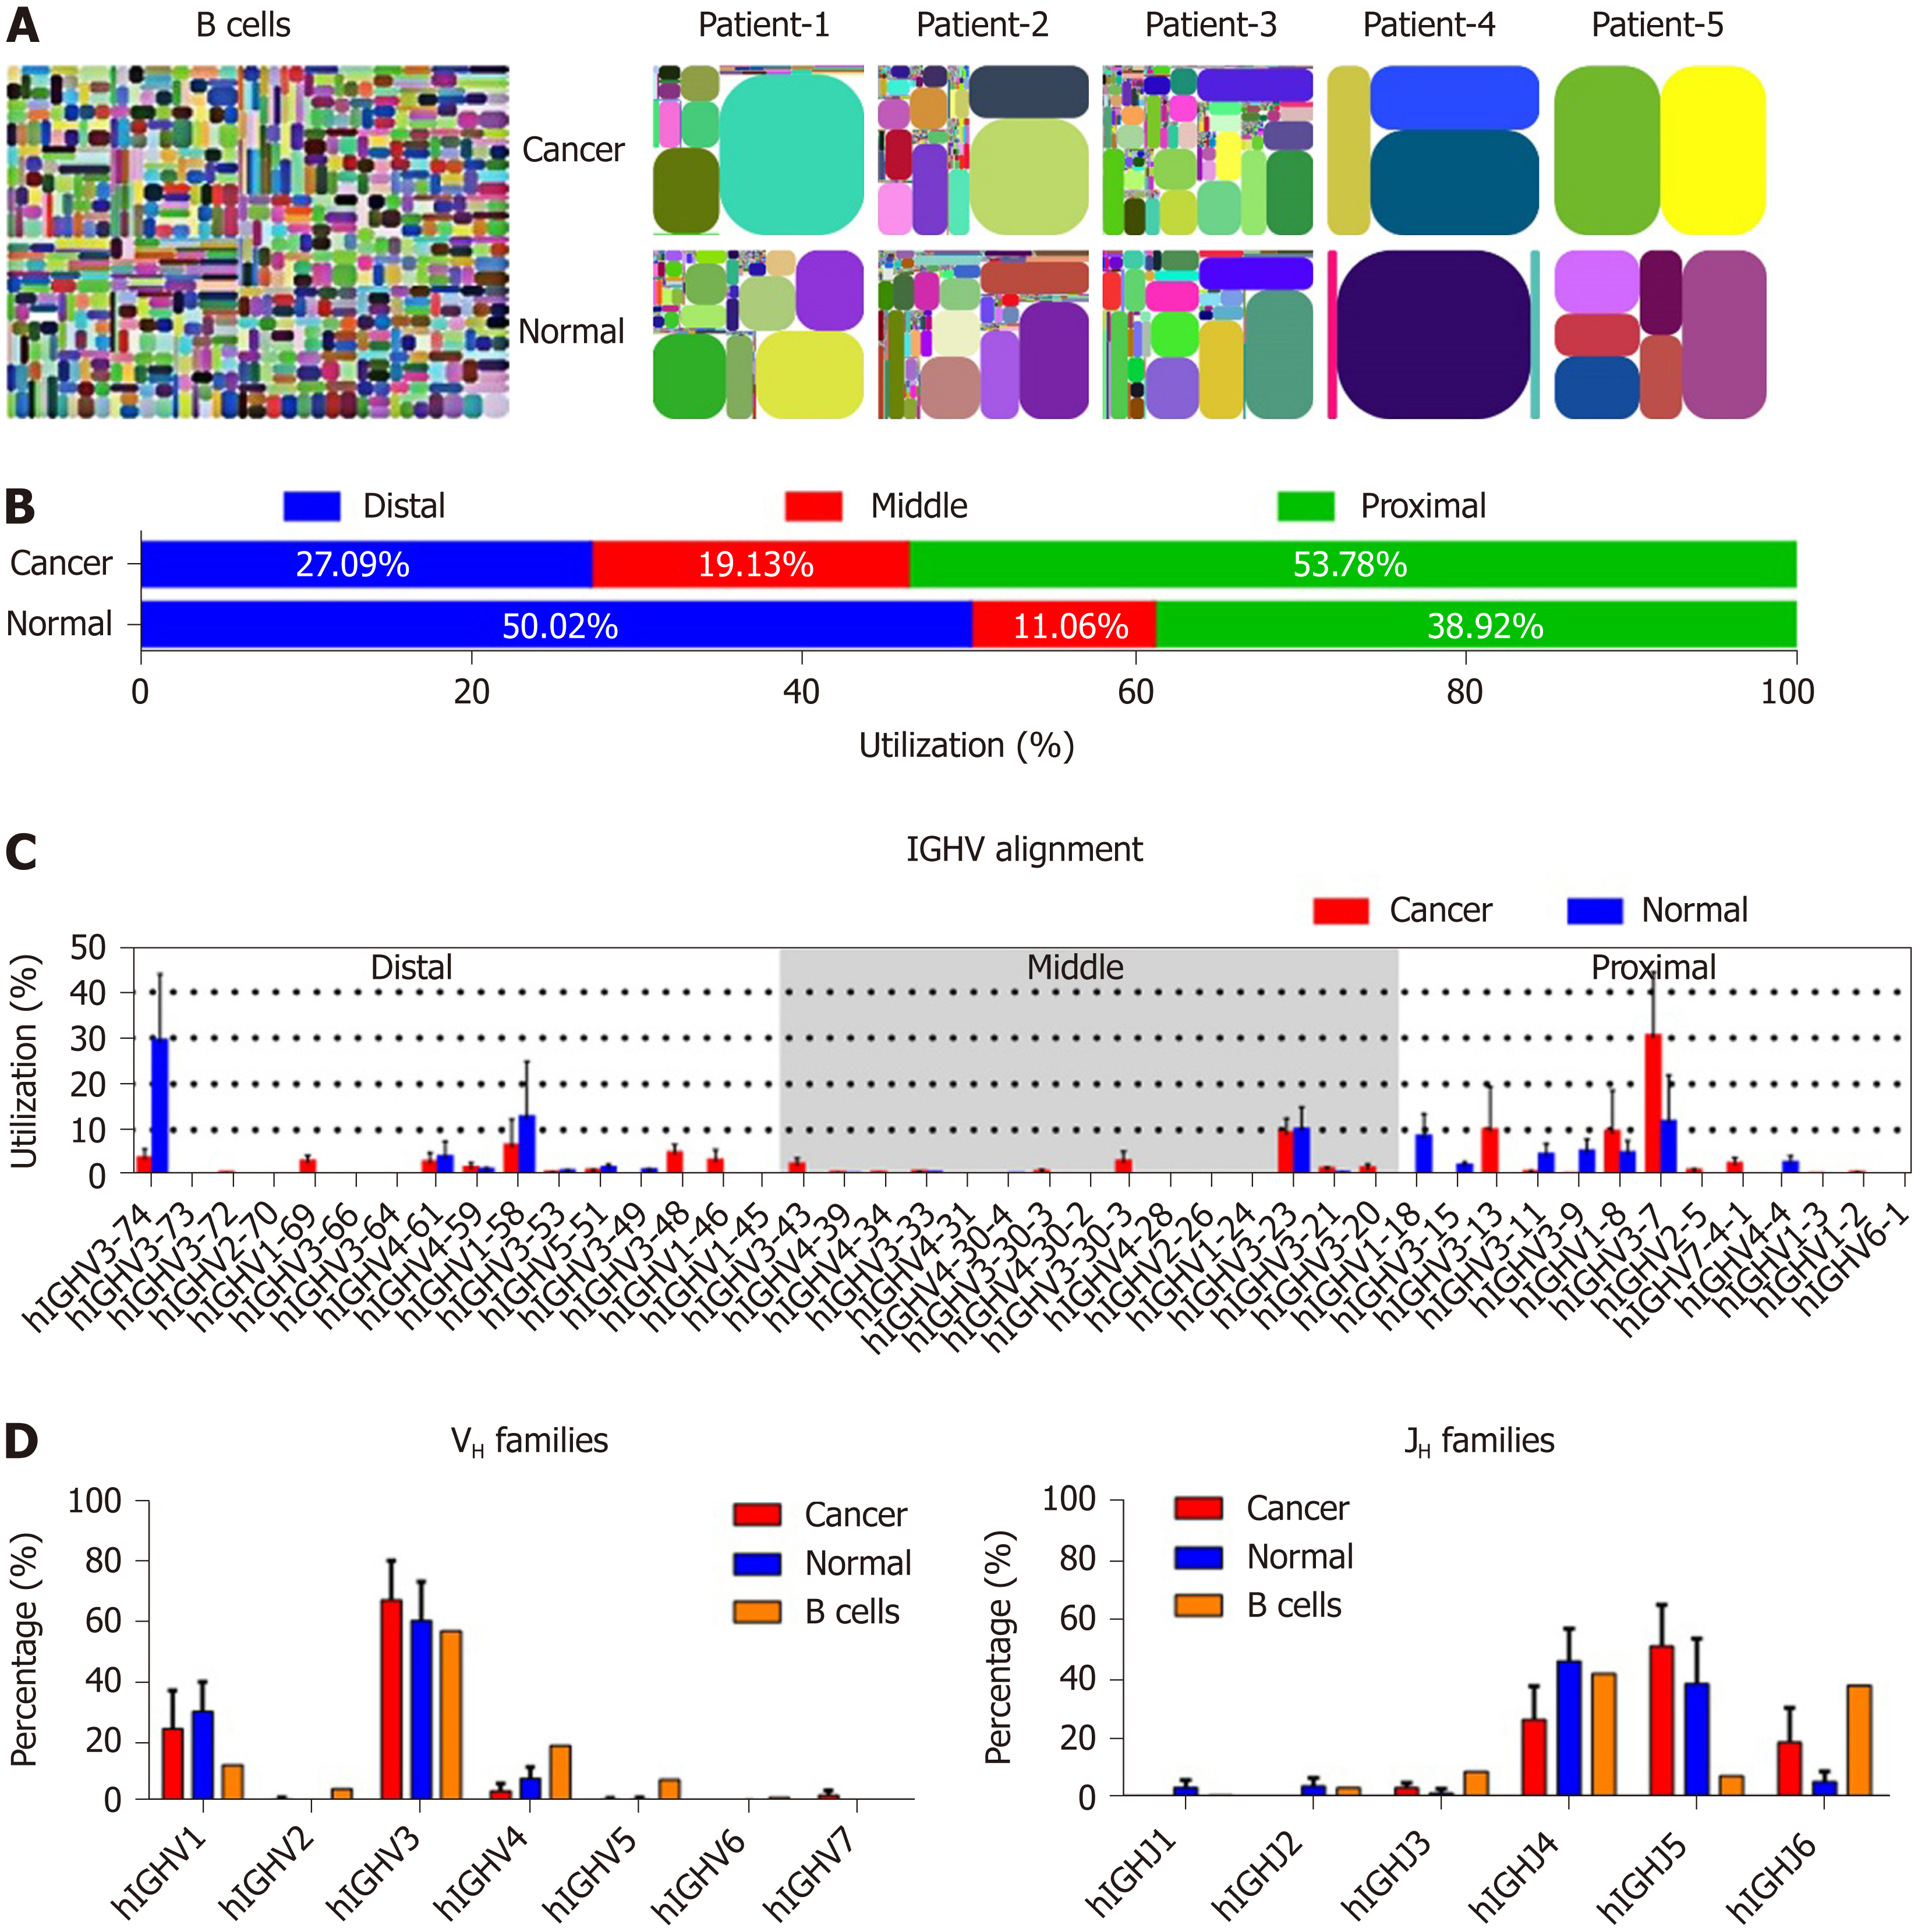
Figure 2 The restricted VDJ patterns and distribution of immunoglobulin heavy chain in cancer and normal cells.
A: V-J-CDR3 map of immunoglobulin heavy chain (IgH) expressed in normal B cells[26], colon cancer cells and normal epithelial cells. Each rectangle represents a unique V-J-CDR3 nucleotide sequence and the size denotes its relative frequency. Colors for each rectangle are chosen randomly and, thus, do not match between plots; B: The distribution of VHs expressed in cancer and normal epithelial cells; C: The utilizations of VHs in cancer and normal epithelial cells. The order of VHs on the X-axis corresponds to its position on a chromosome; D: Utilizations of 7 VH and 6 JH families in cancer and normal cells from patients with colon cancer (red and blue columns), and B cells from peripheral blood of a healthy donor[28] (orange columns). Small horizontal lines indicate the mean ± SEM. All data comparing cancer with normal cells were determined by the two-tailed unpaired Student’s t-test and none of the differences were significant (P > 0.05). The percentage of VH and JH families in B cells (D) was derived from the data from other sources[28]; thus, statistical analysis was not performed.
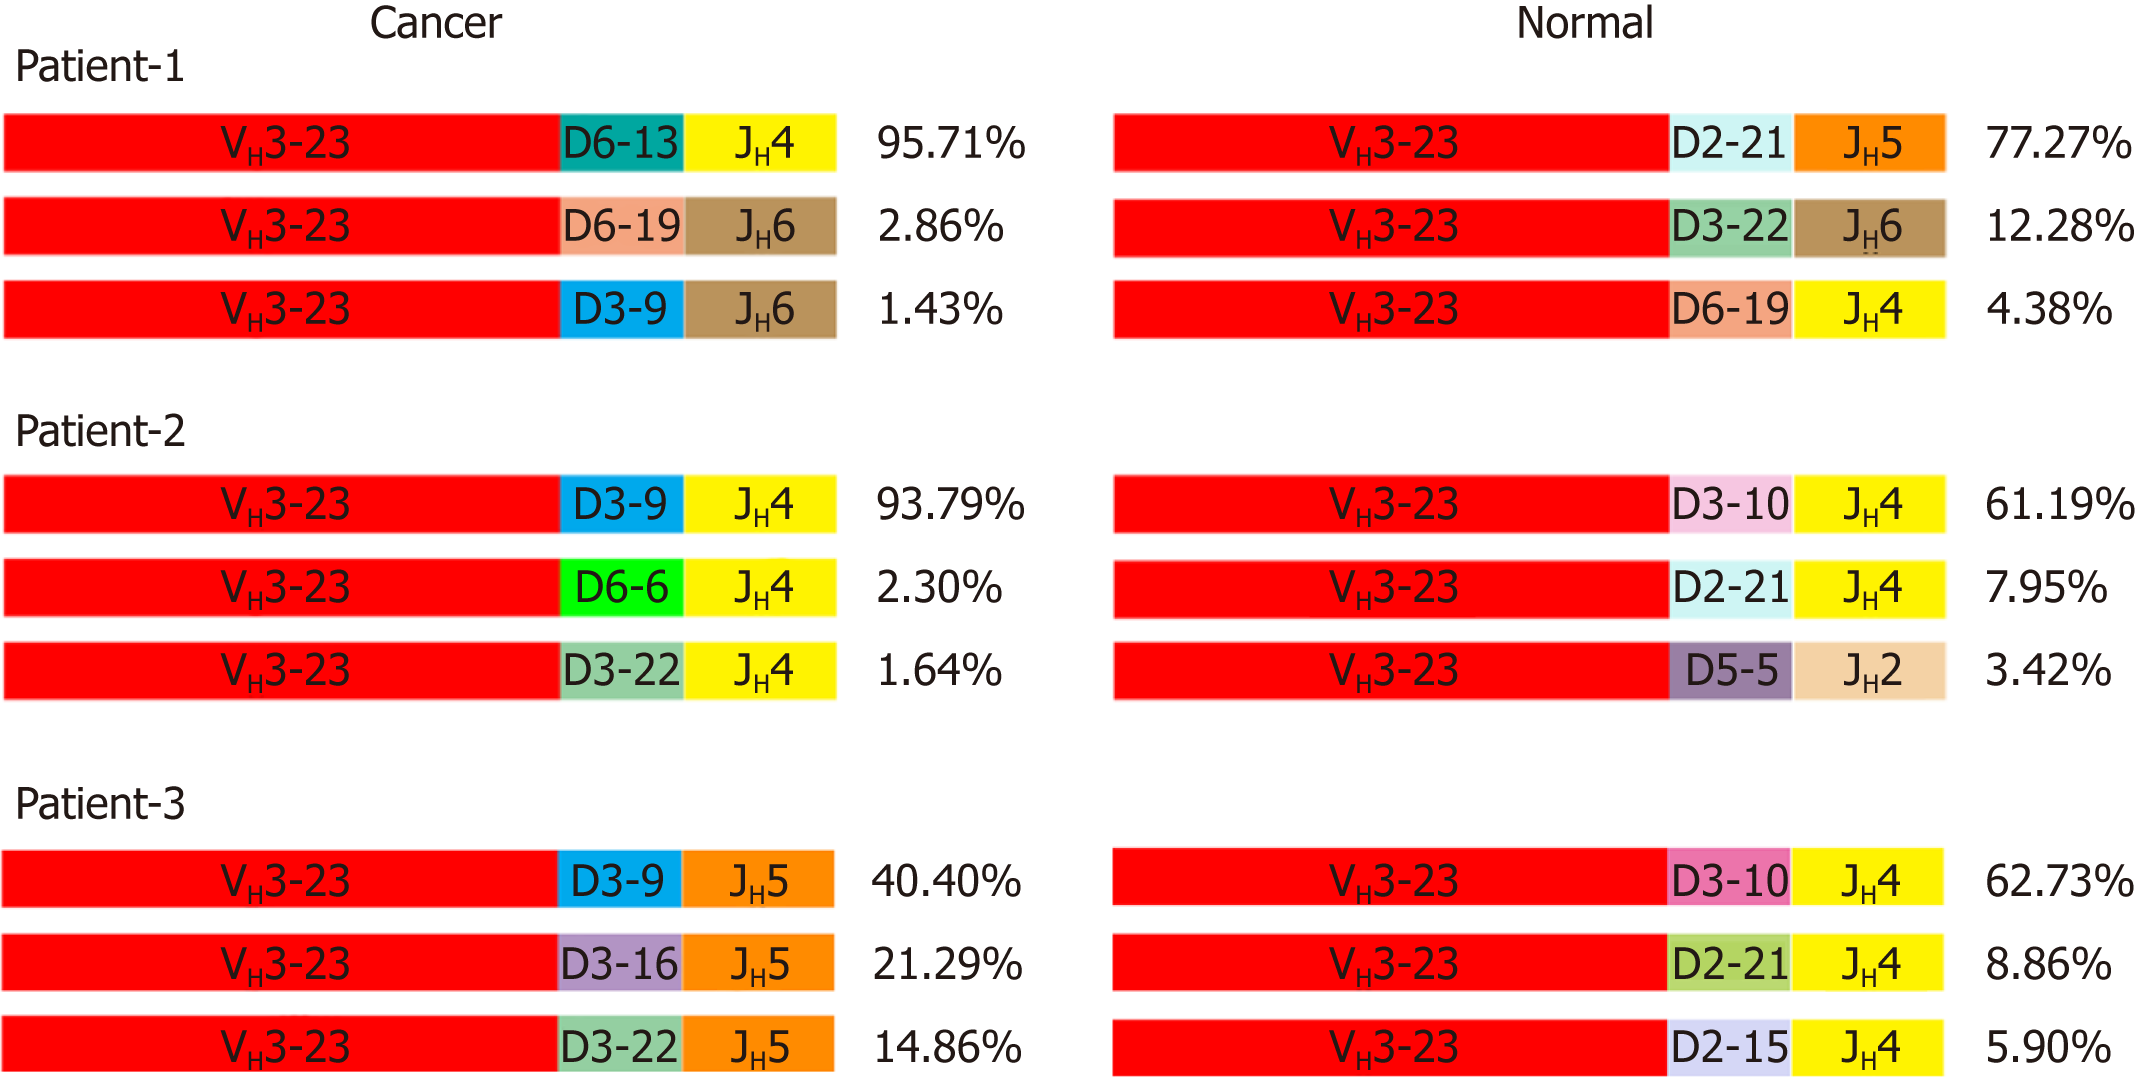
Figure 3 Different VH3-23/D/JH usages in cancer and normal cells.
The top three VH3-23/D/JH and their percentage to total VH3-23 rearrangements in cancer cells and normal epithelial cells of the first 3 patients. The same color represents the same V, D or J segment.
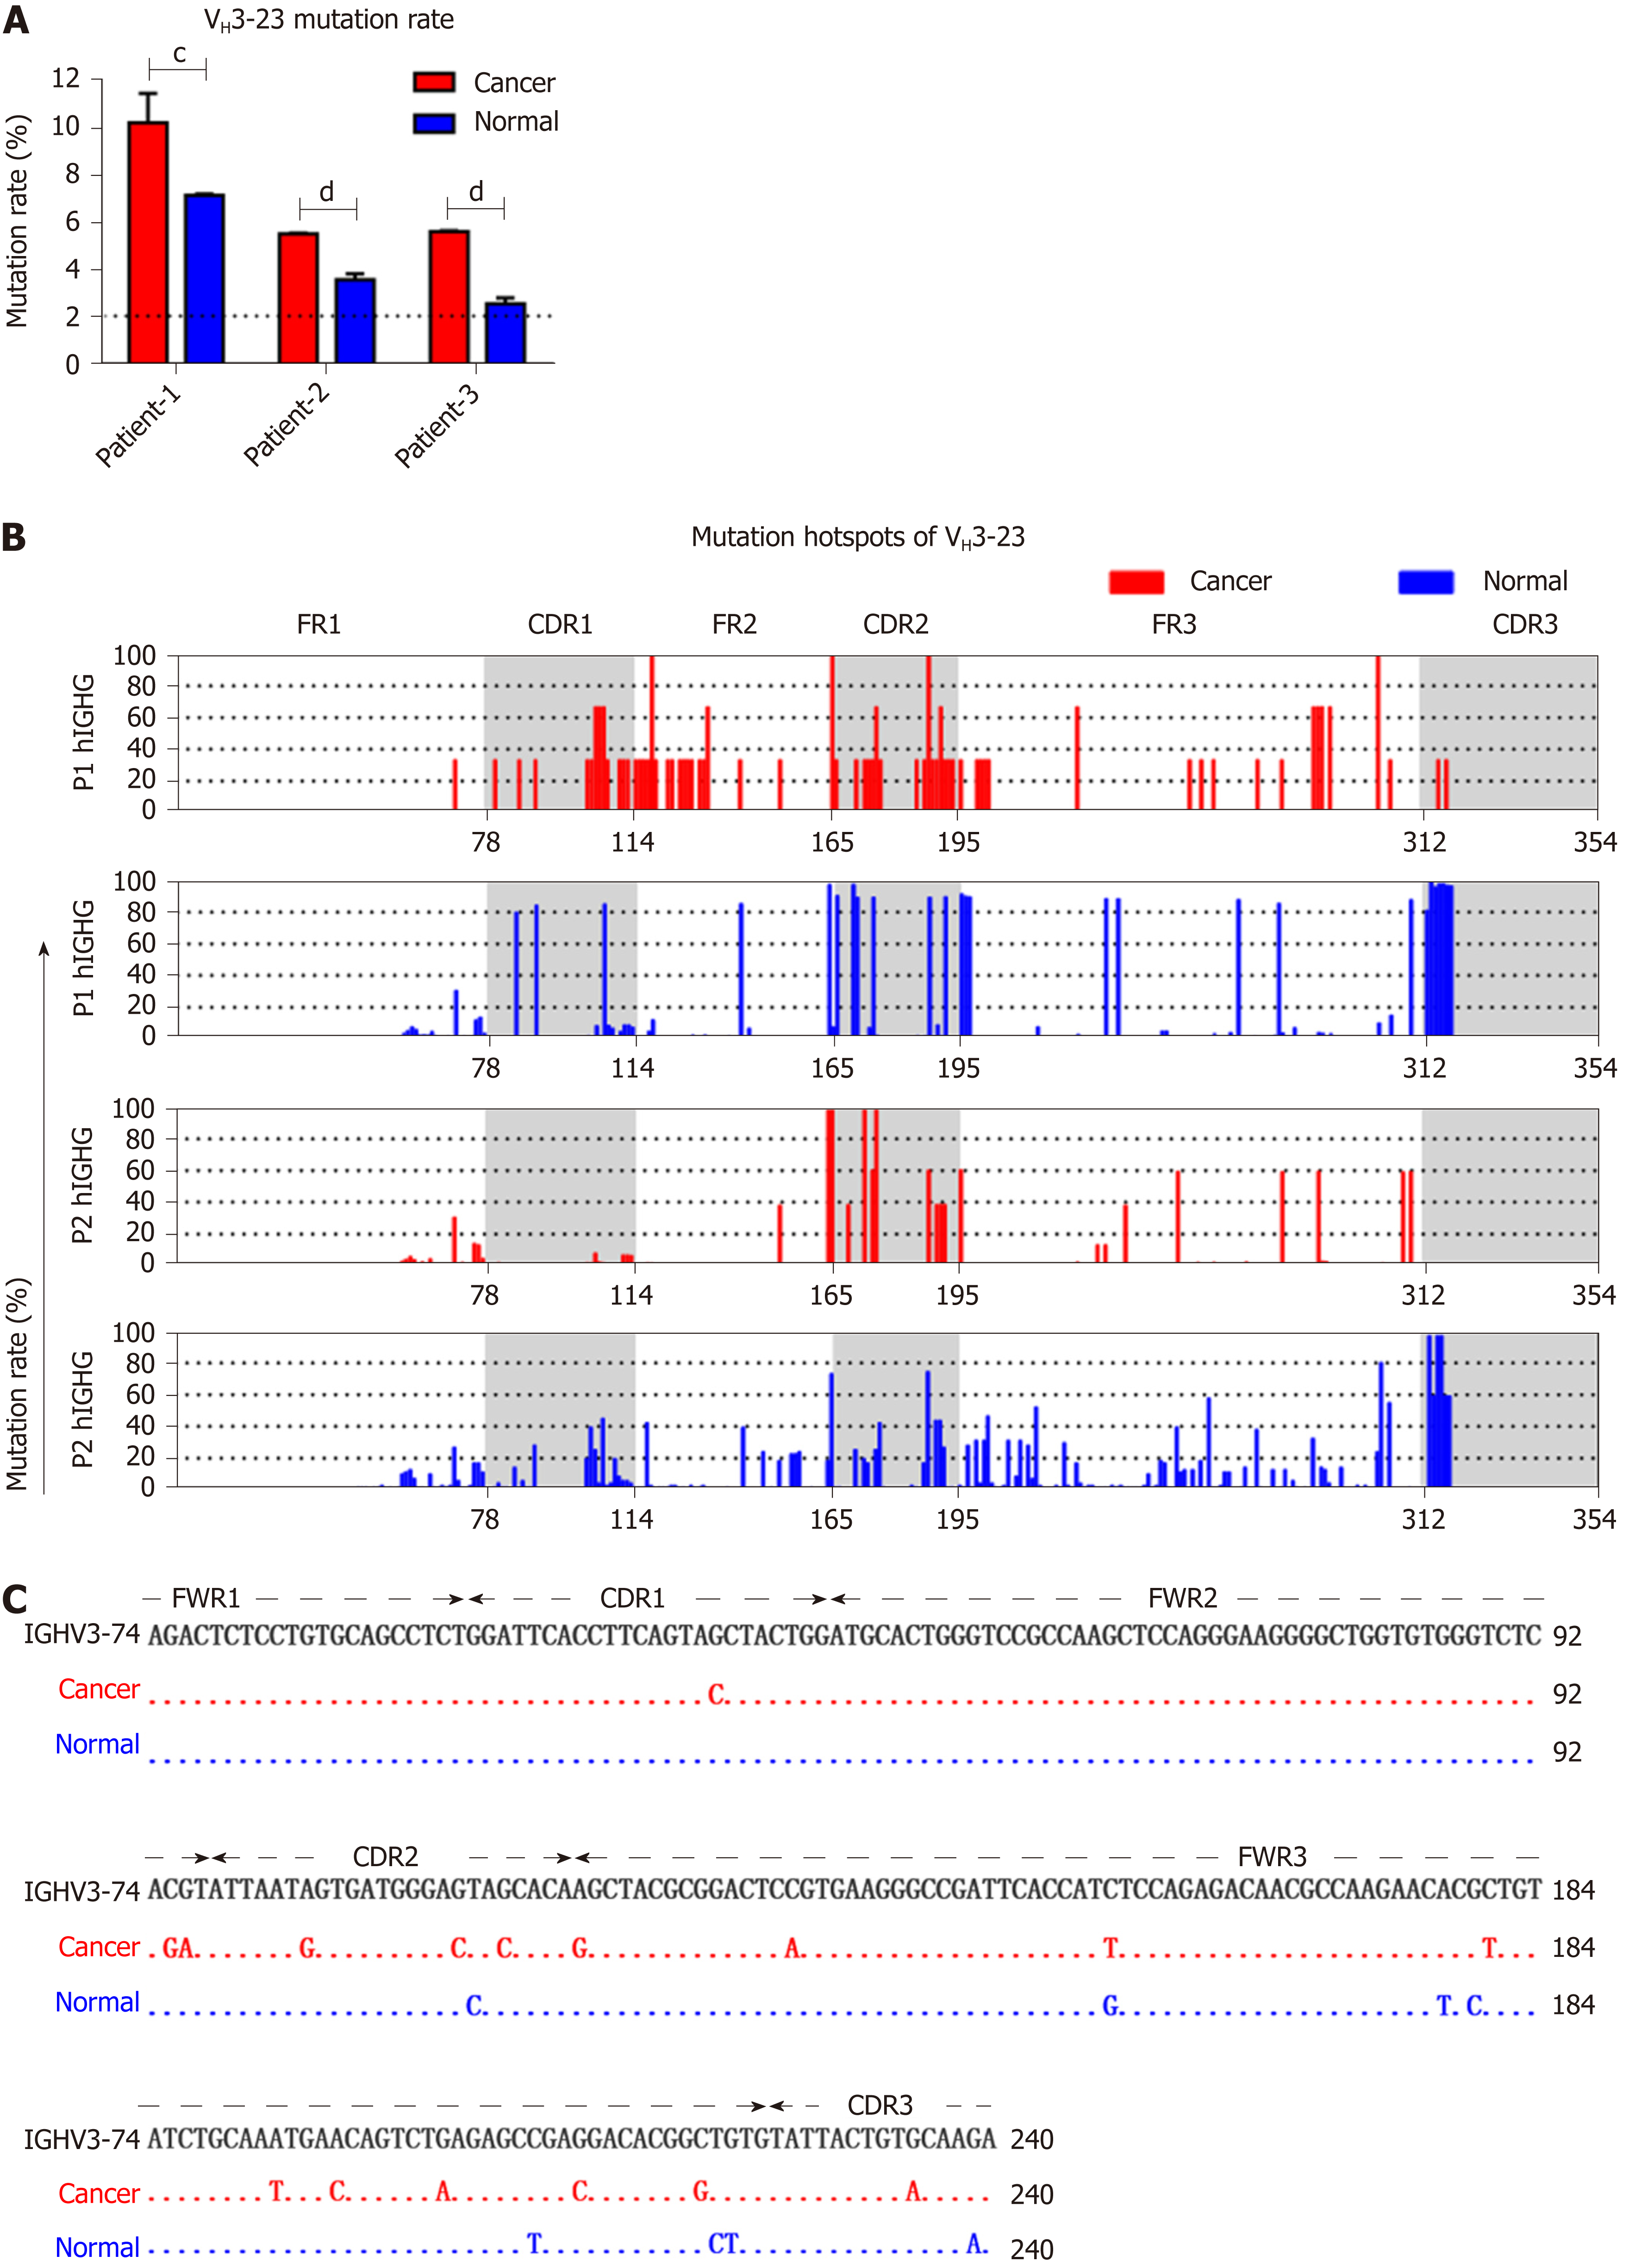
Figure 4 Somatic hypermutation in colon cancer and normal epithelial cells.
A: Mutation rates of VH3-23 in cancer and normal cells. Dotted lines represent the cut-off value 2%; B: Mutant positions and corresponding frequencies of VH3-23 in different patients. P1: Patient-1. P2: Patient-2. The X-axis represents the 1st to 354th nucleotides using IMGT-numbering; C: Representative mutant positions of VH3-74/D6-19/JH4 in cancer and normal cells of patient-3 compared to the germline sequence of VH3-74. Small horizontal lines indicate the mean ± SEM. All data comparing cancer with normal cells were determined by the two-tailed unpaired Student’s t-test. cP < 0.001. dP < 0.0001.
- Citation: Geng ZH, Ye CX, Huang Y, Jiang HP, Ye YJ, Wang S, Zhou Y, Shen ZL, Qiu XY. Human colorectal cancer cells frequently express IgG and display unique Ig repertoire. World J Gastrointest Oncol 2019; 11(3): 195-207
- URL: https://www.wjgnet.com/1948-5204/full/v11/i3/195.htm
- DOI: https://dx.doi.org/10.4251/wjgo.v11.i3.195


