Copyright
©The Author(s) 2019.
World J Gastrointest Oncol. Oct 15, 2019; 11(10): 857-865
Published online Oct 15, 2019. doi: 10.4251/wjgo.v11.i10.857
Published online Oct 15, 2019. doi: 10.4251/wjgo.v11.i10.857
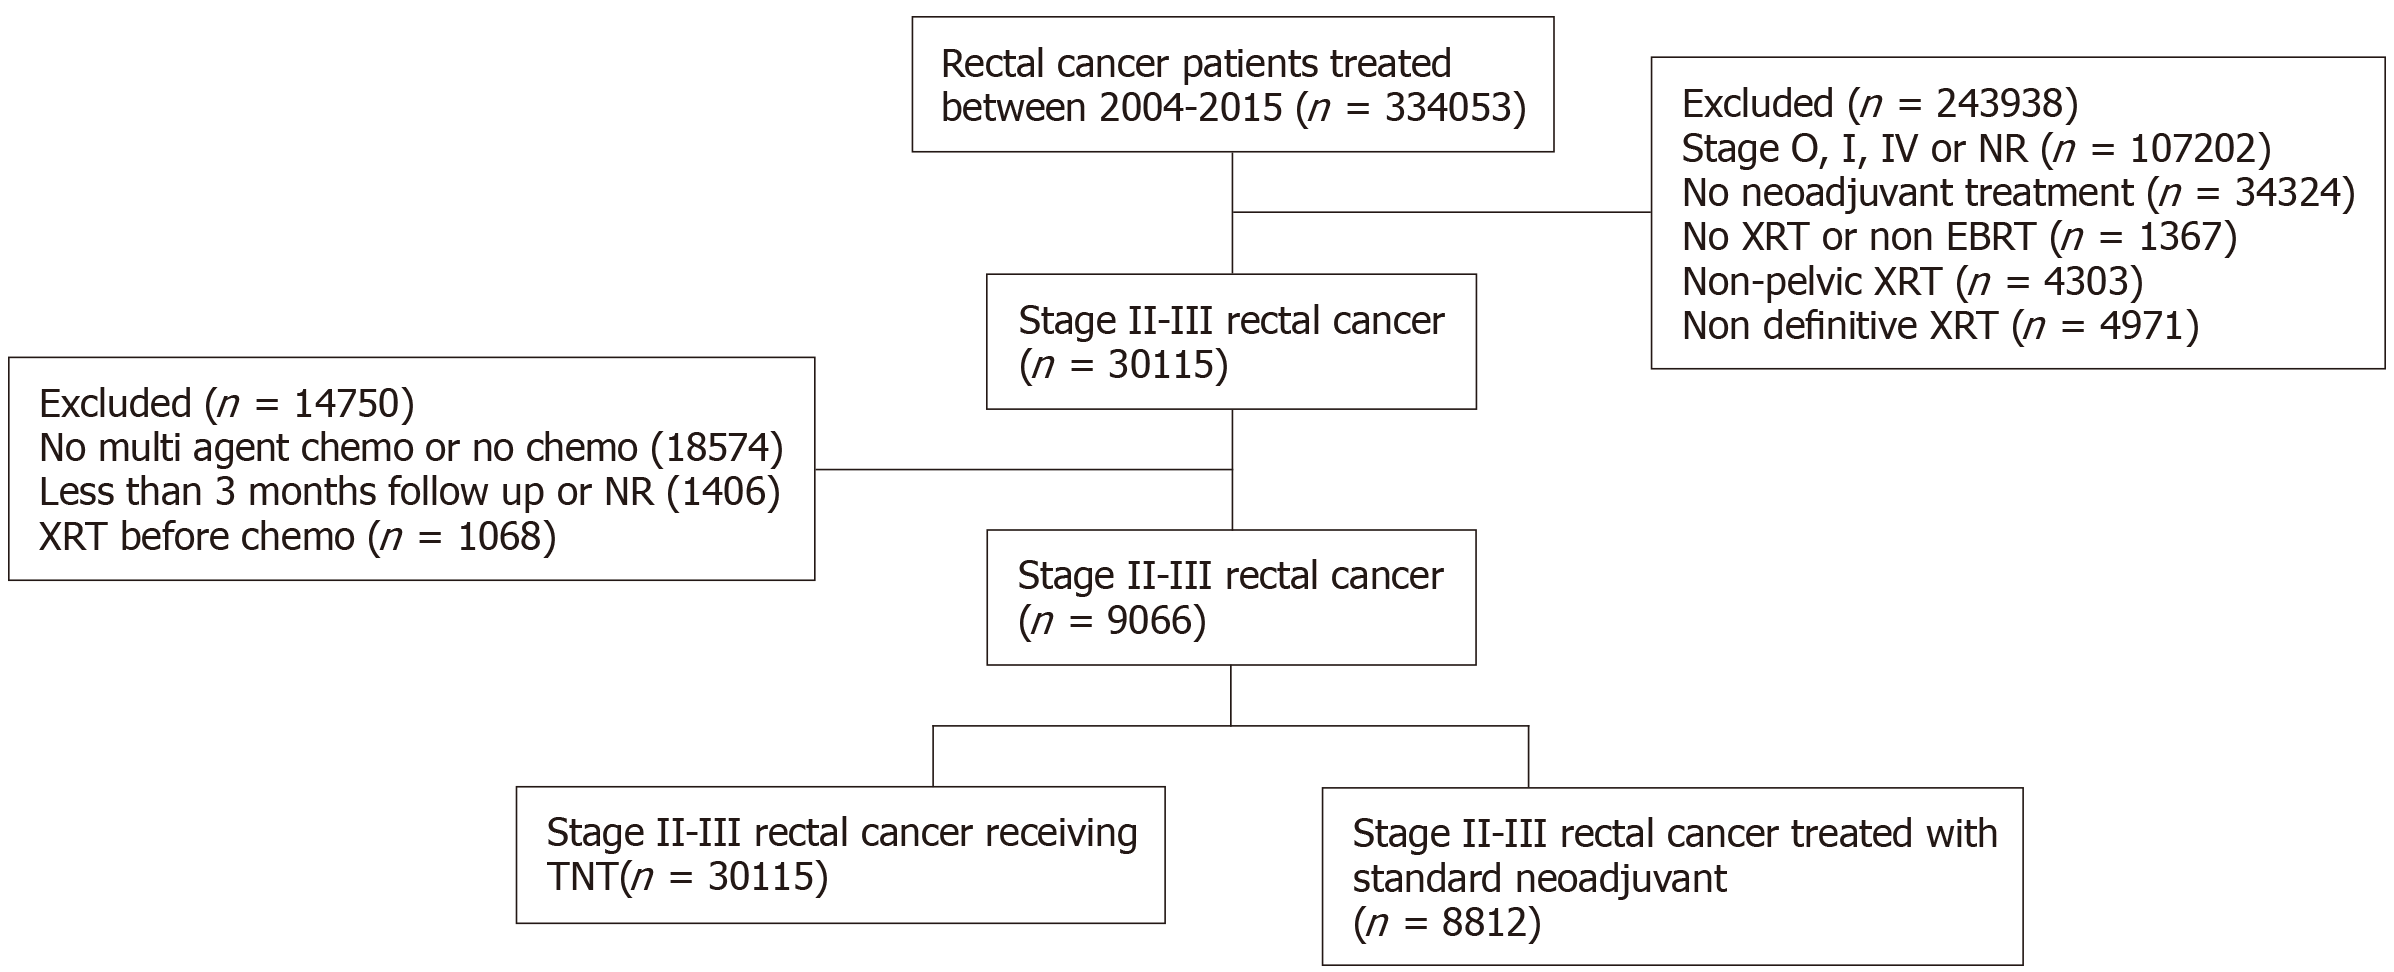
Figure 1 Flow chart for filtering data.
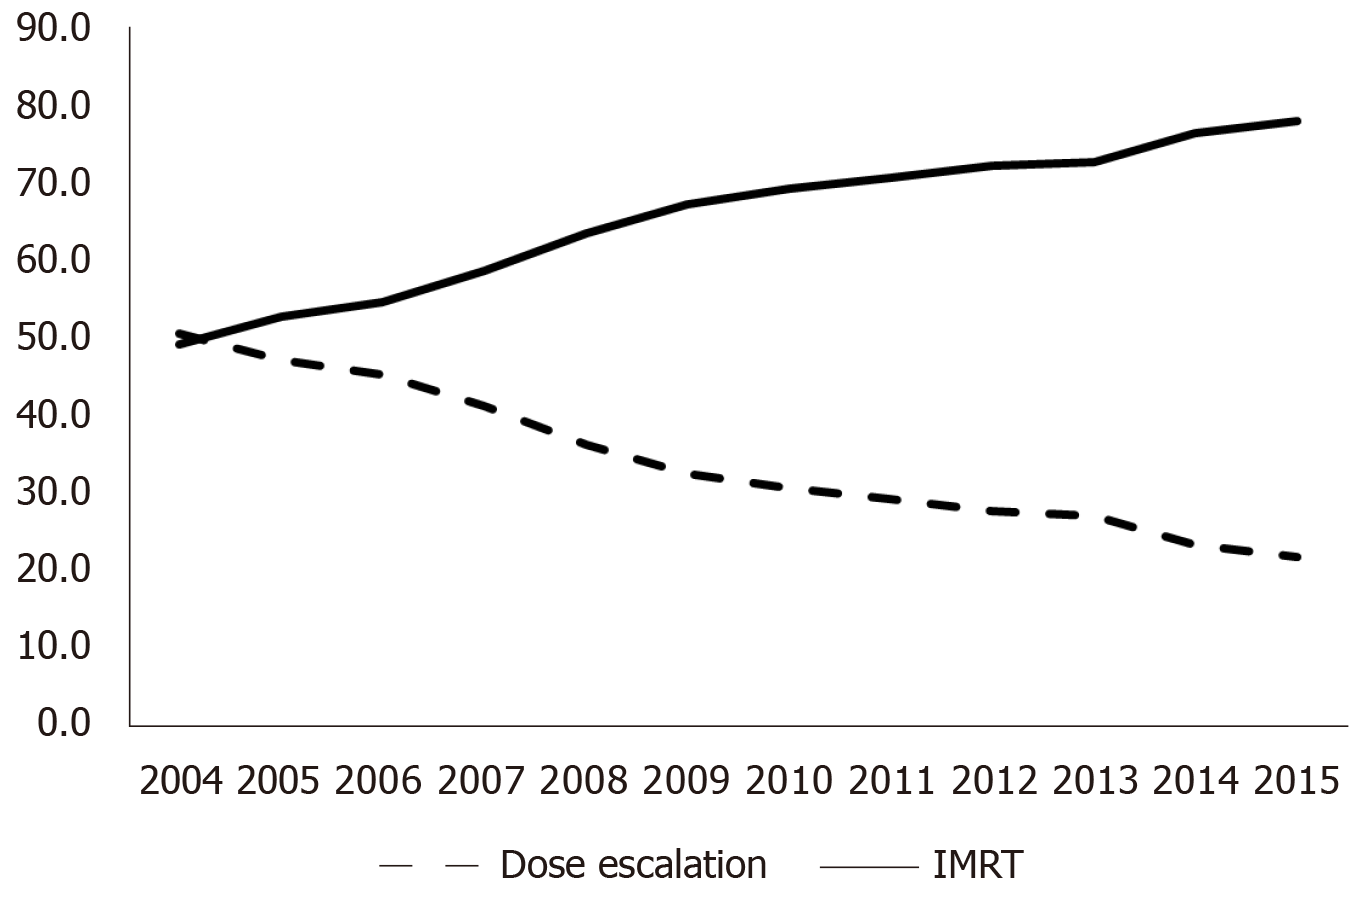
Figure 2 Line graph comparing use of total neoadjuvant therapy and neoadjuvant radiation from 2004 to 2014.
- Citation: Babar L, Bakalov V, Abel S, Ashraf O, Finley GG, Raj MS, Lundeen K, Monga DK, Kirichenko AV, Wegner RE. Retrospective review of total neoadjuvant therapy. World J Gastrointest Oncol 2019; 11(10): 857-865
- URL: https://www.wjgnet.com/1948-5204/full/v11/i10/857.htm
- DOI: https://dx.doi.org/10.4251/wjgo.v11.i10.857


