Copyright
©The Author(s) 2018.
World J Gastrointest Oncol. Dec 15, 2018; 10(12): 496-504
Published online Dec 15, 2018. doi: 10.4251/wjgo.v10.i12.496
Published online Dec 15, 2018. doi: 10.4251/wjgo.v10.i12.496
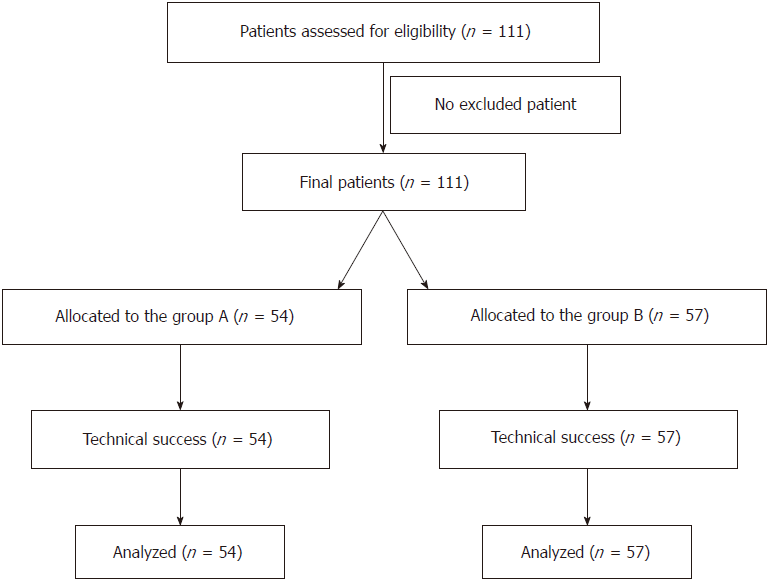
Figure 1 Study design and flow chart.
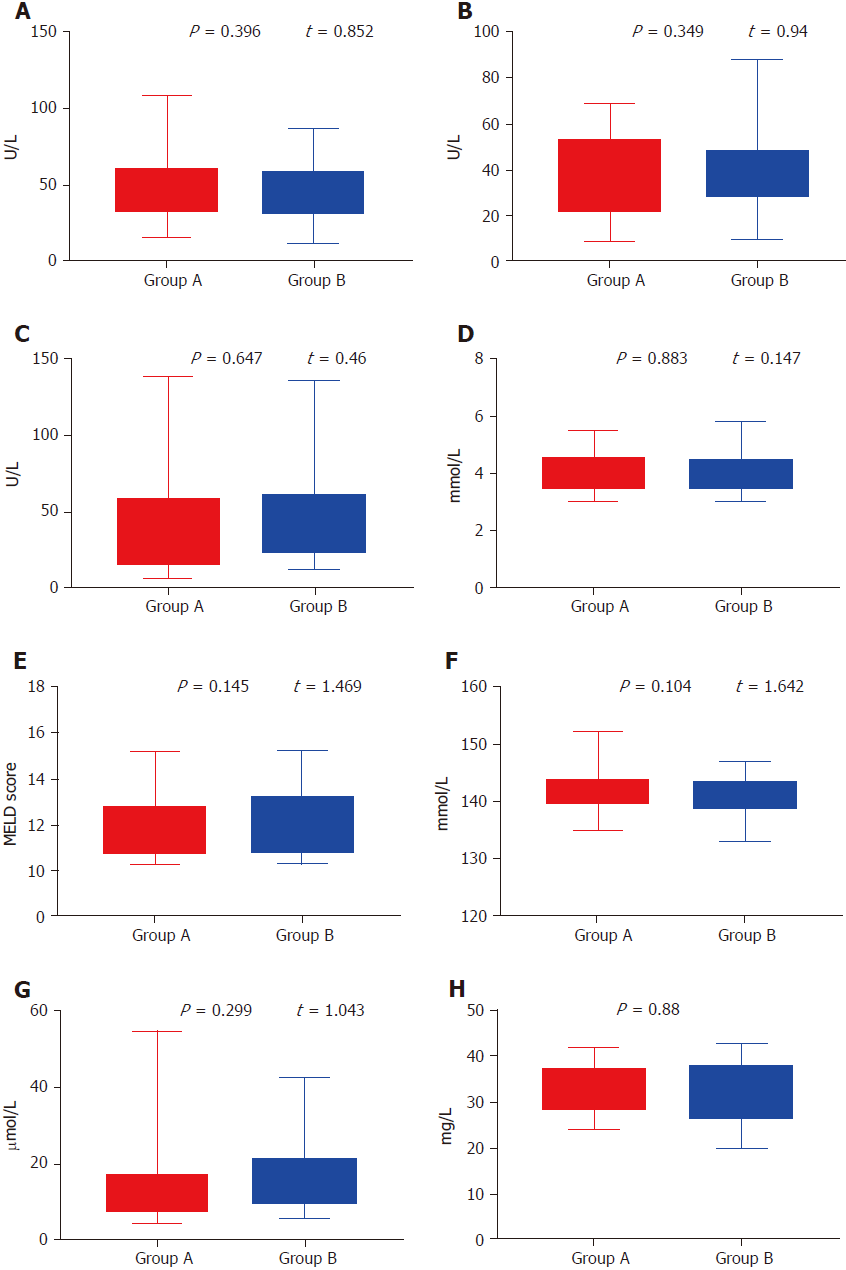
Figure 2 Boxplots of liver function.
A: Alanine aminotransferase; B: Aspartate aminotransferase; C: Glutamyl transpeptidase; D: K+; E: Model for end-stage liver disease score; F: Na+; G: Direct bilirubin; H: Albumin (H) in Group A (red bars) and Group B (blue bars) were compared with Student’s t test. MELD: Model for end-stage liver disease score.
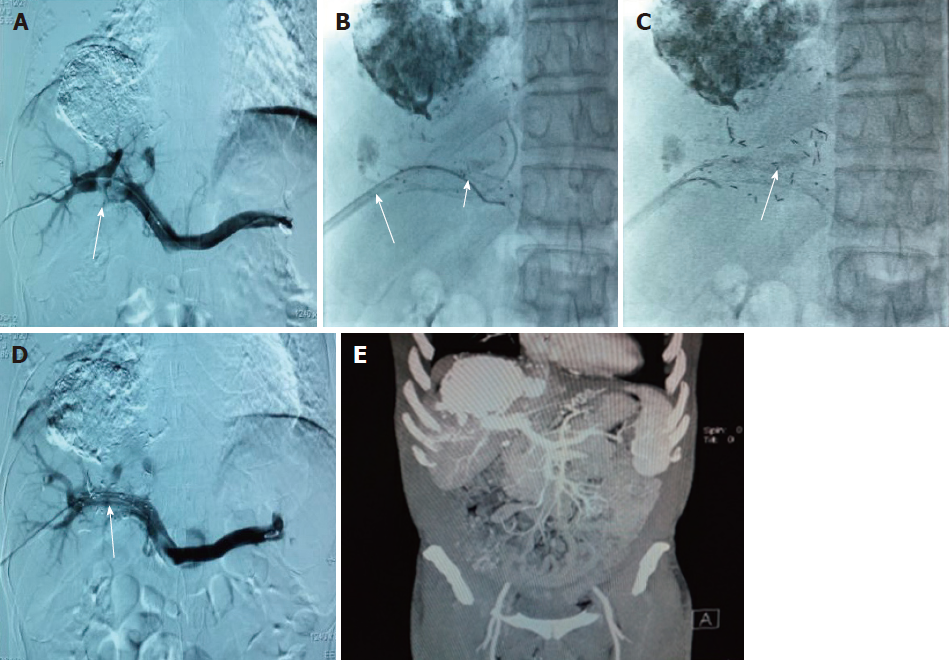
Figure 3 Pictures taken during operation of a 55-year-old male patient with hepatitis B cirrhosis and primary liver cancer with main portal vein tumor thrombus.
The patient was treated with percutaneous liver puncture and 125I implantation combined with portal vein stent implantation. A: Percutaneous transhepatic portal venography showing proximal and left branch of portal vein tumor thrombus (long white arrow); B: X-ray showing vein stent (short white arrow), catheter between the stent and tumor thrombus (long white arrow); C: X-ray showing 125I between the stent and tumor thrombus (long white arrow); D: Postoperative portal vein angiography showing patency of stent blood flow (long white arrow); E: 18 mo after the operation, enhanced computed tomography showed that blood flow in the splenic vein, superior mesenteric vein, portal vein and stent was good.
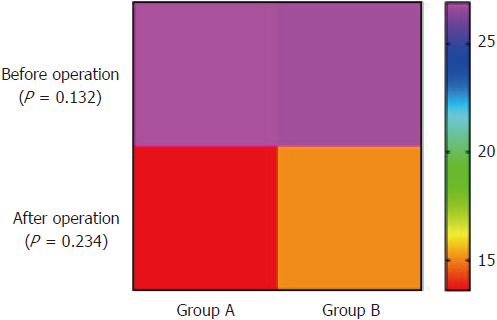
Figure 4 Heat map of comparison of portosystemic pressure gradient measurements before and after operation between Groups A and B.
Student’s t test was used to compare portosystemic pressure gradient at each time point, and no difference was found between the two groups.
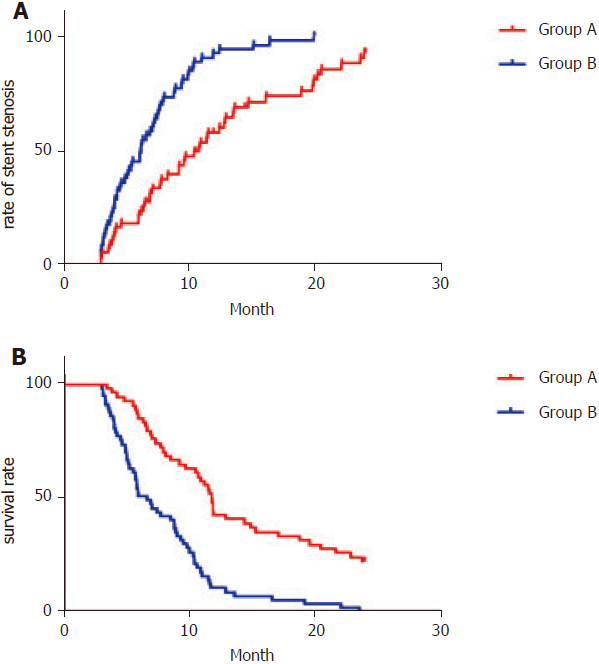
Figure 5 Kaplan–Meier curves of postoperative stent restenosis (A) and survival (B).
- Citation: Wu YF, Wang T, Yue ZD, Zhao HW, Wang L, Fan ZH, He FL, Liu FQ. Stents combined with iodine-125 implantation to treat main portal vein tumor thrombus. World J Gastrointest Oncol 2018; 10(12): 496-504
- URL: https://www.wjgnet.com/1948-5204/full/v10/i12/496.htm
- DOI: https://dx.doi.org/10.4251/wjgo.v10.i12.496


