Copyright
©The Author(s) 2018.
World J Gastrointest Oncol. Nov 15, 2018; 10(11): 449-464
Published online Nov 15, 2018. doi: 10.4251/wjgo.v10.i11.449
Published online Nov 15, 2018. doi: 10.4251/wjgo.v10.i11.449
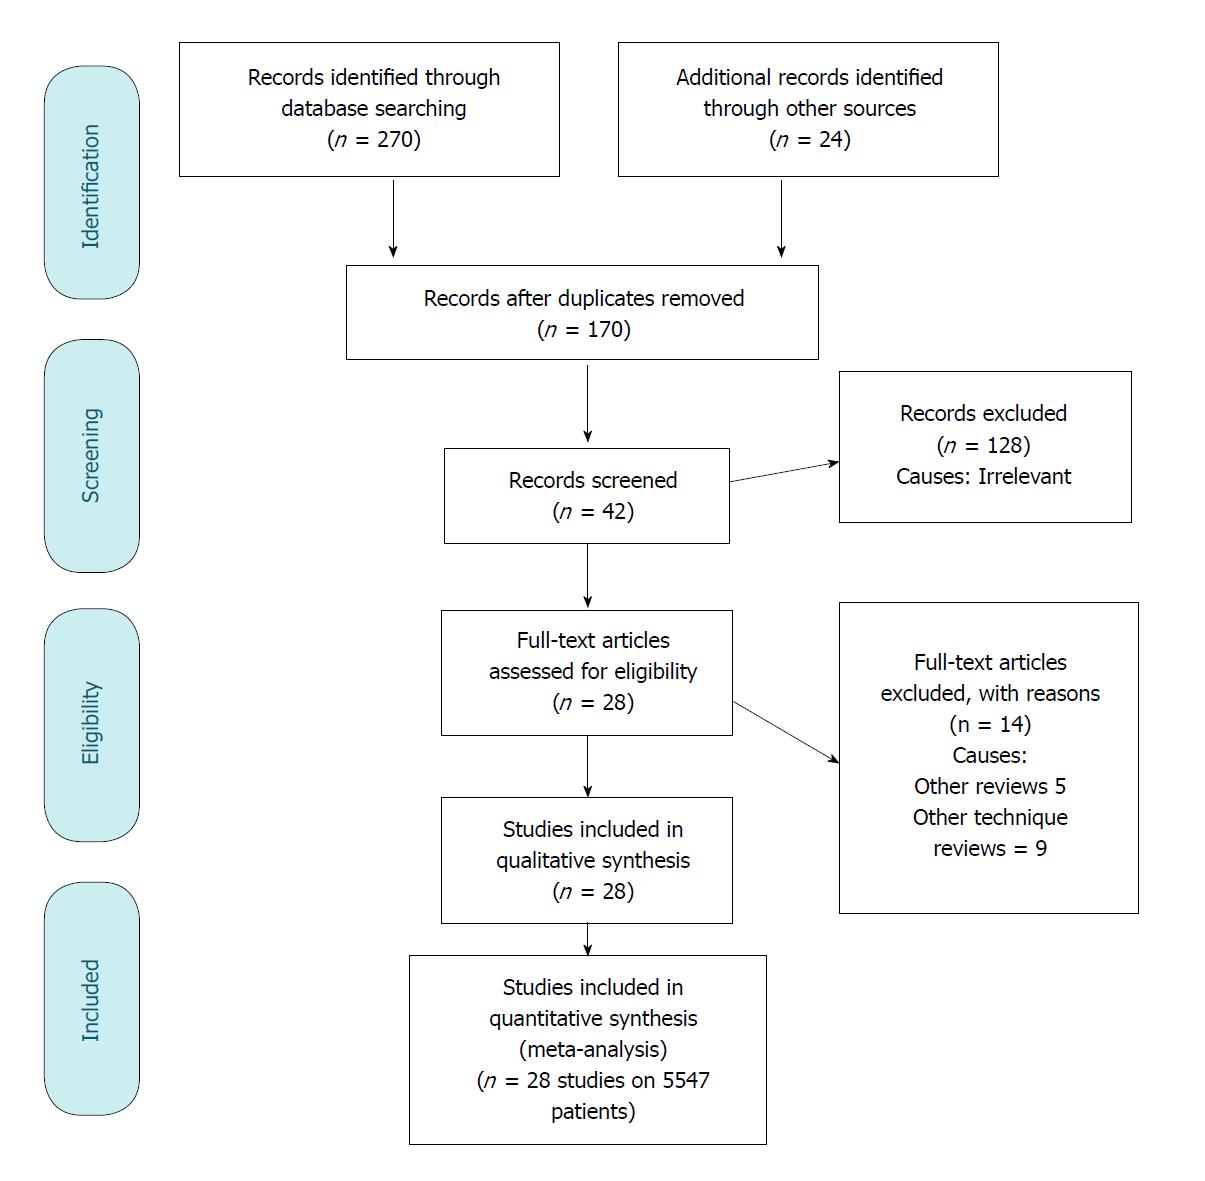
Figure 1 PRISMA flow diagram.
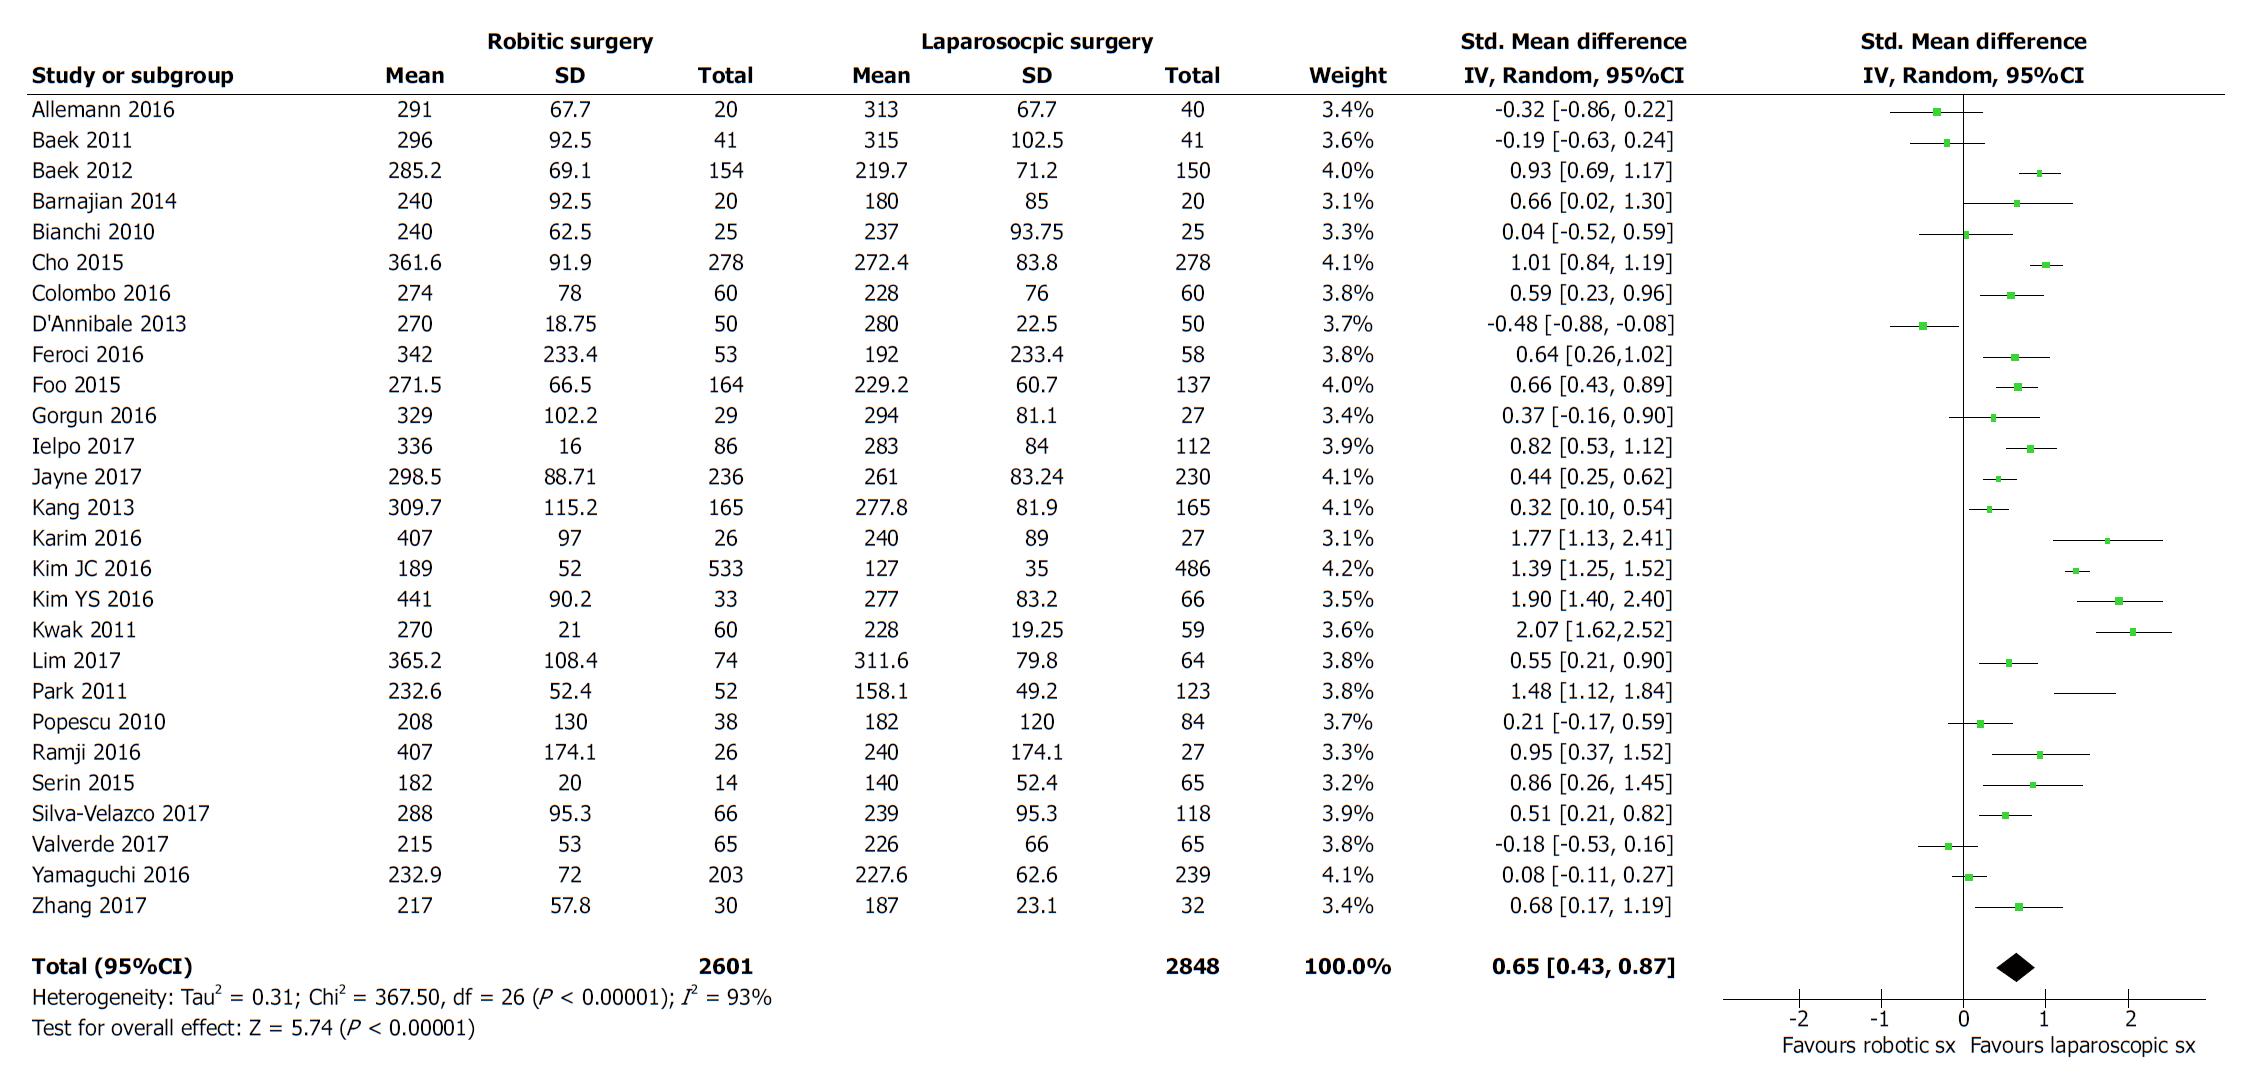
Figure 2 Forest plot for duration of operation following rectal resection by robotic surgery vs conventional laparoscopic surgery.
Standardized mean difference is shown with 95%CIs.
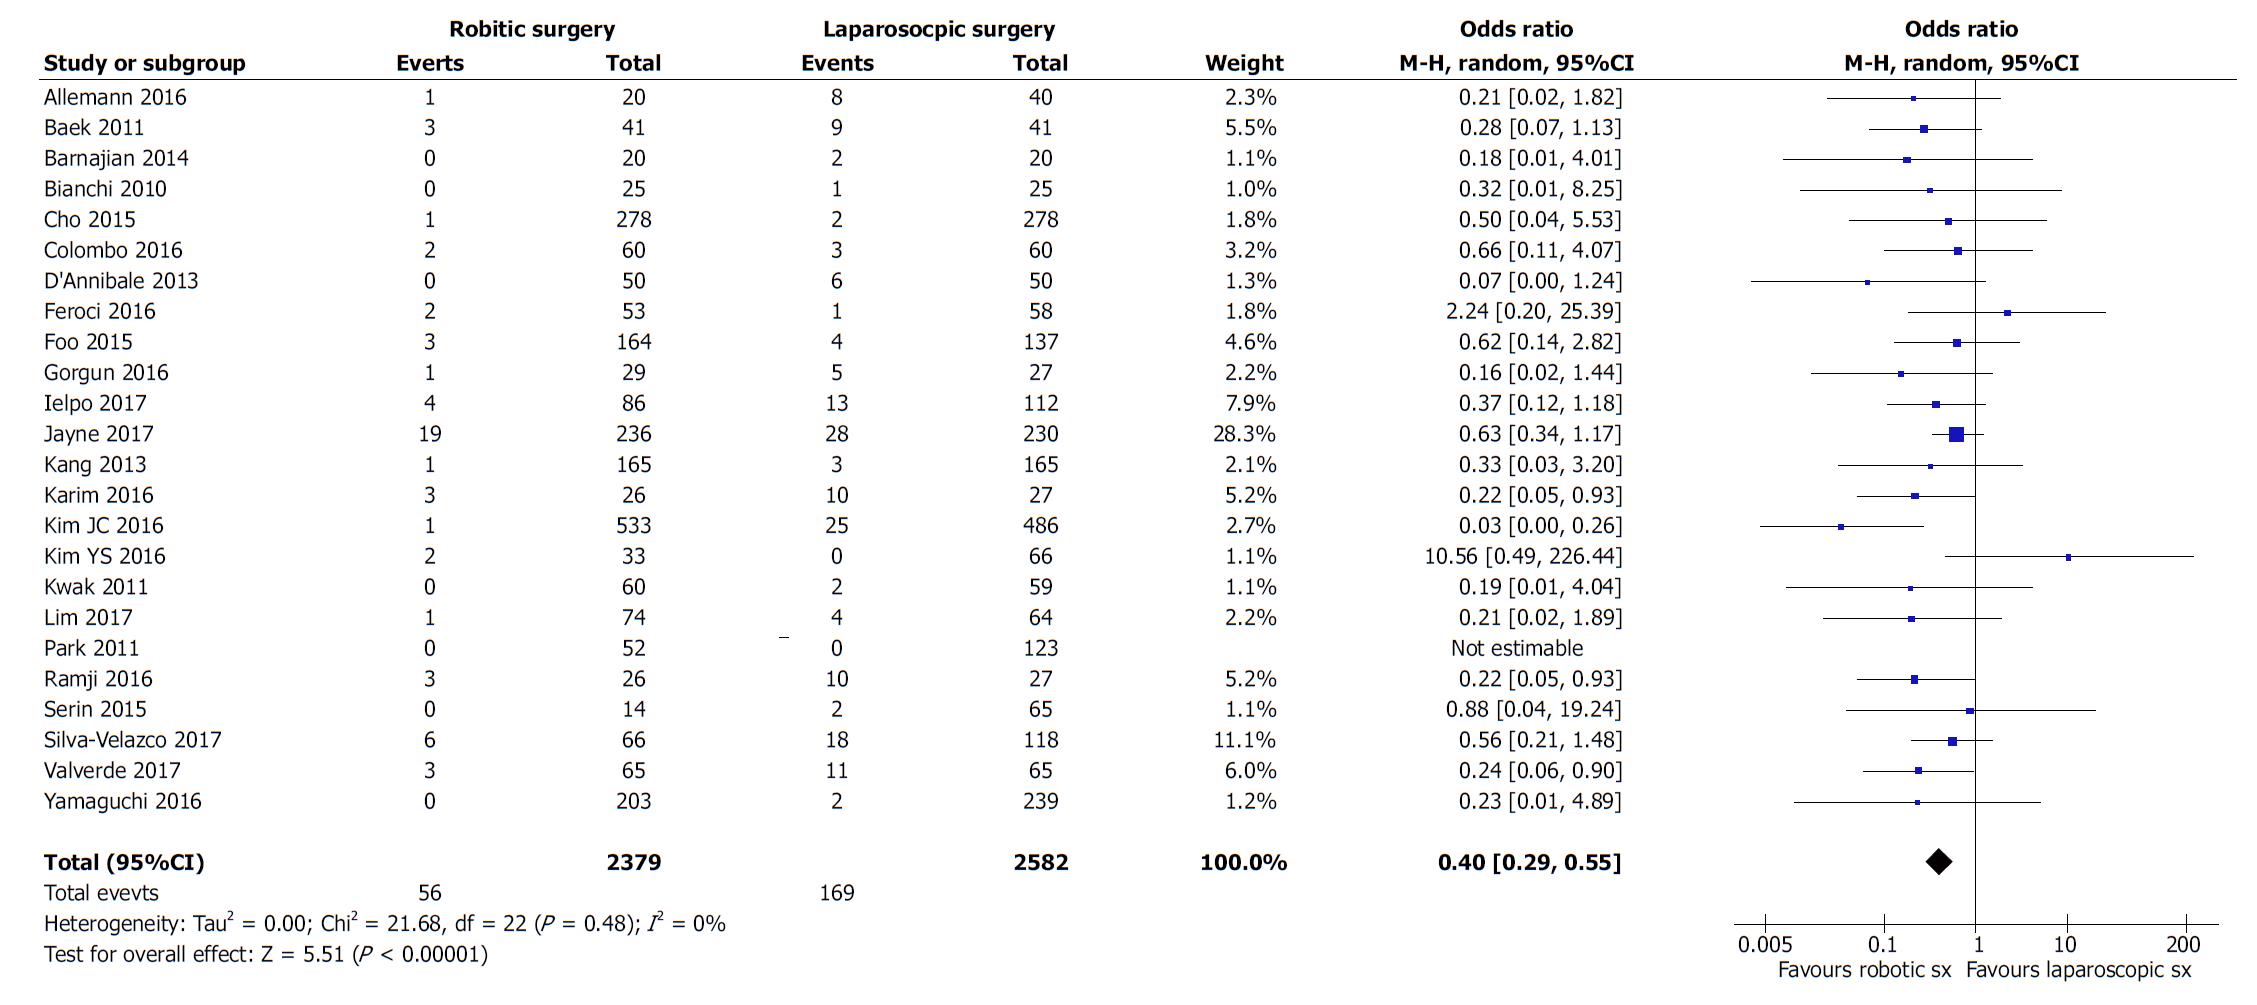
Figure 3 Forest plot for conversion following rectal resection by robotic surgery vs conventional laparoscopic surgery.
Odds ratio is shown with 95%CIs.
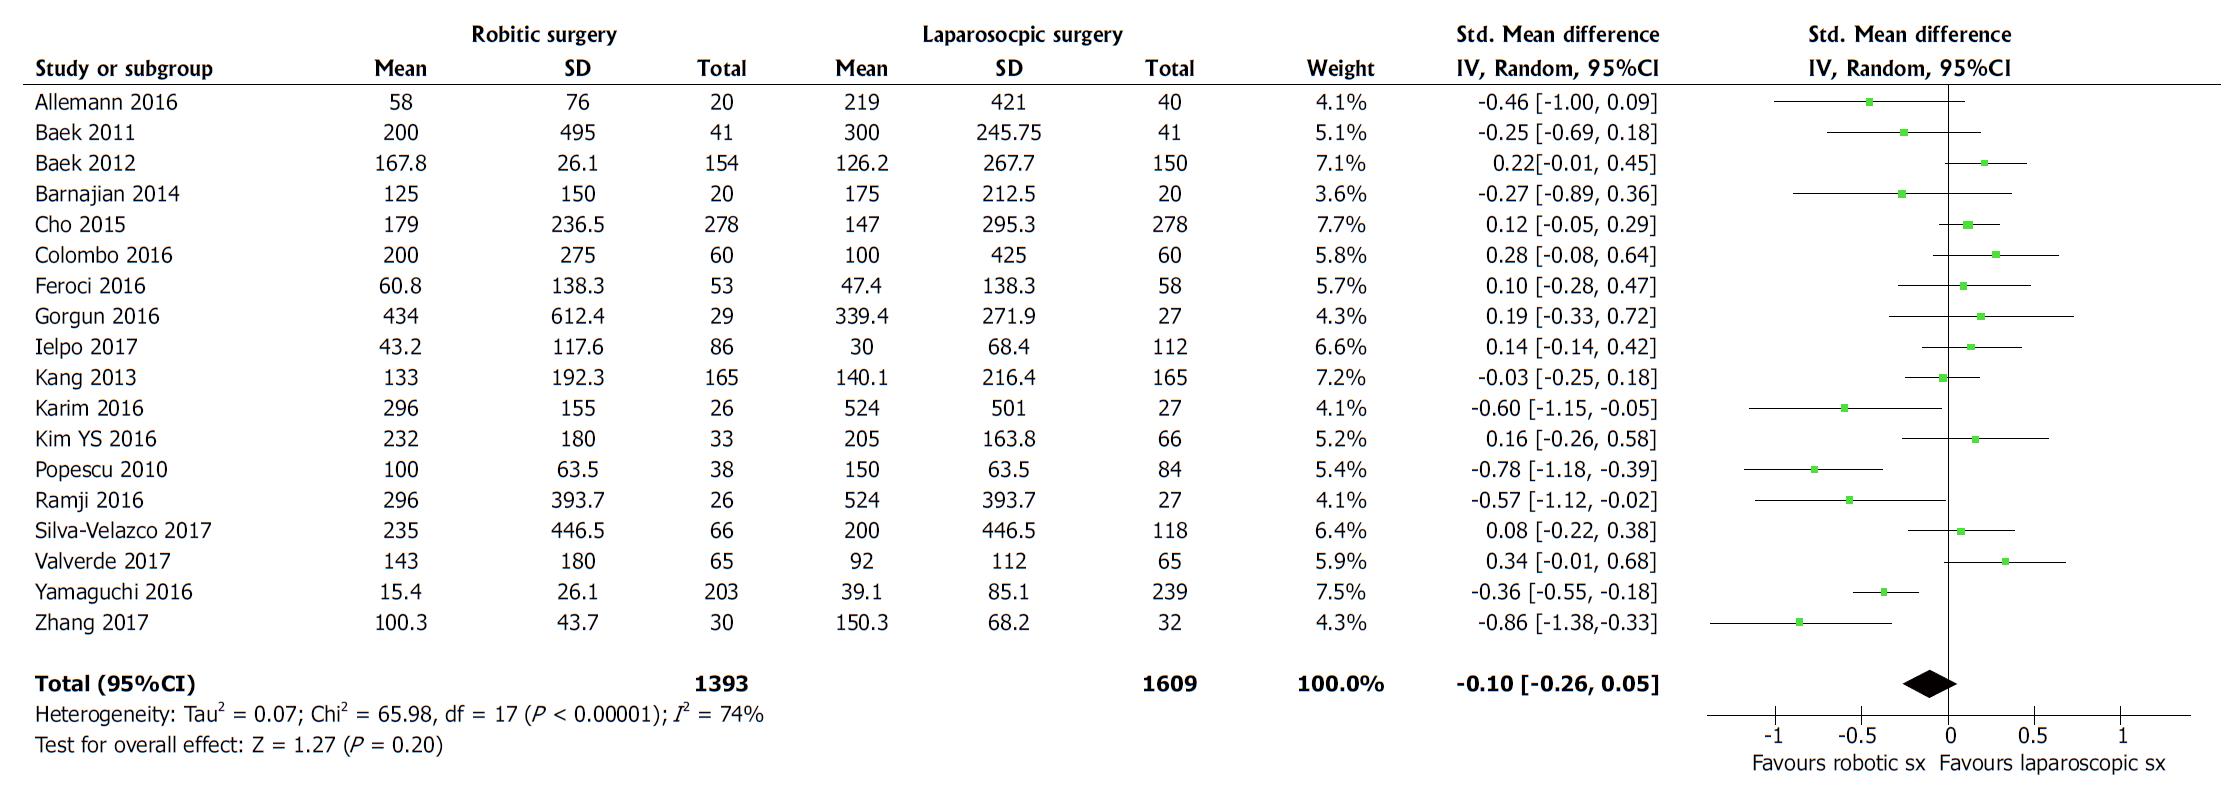
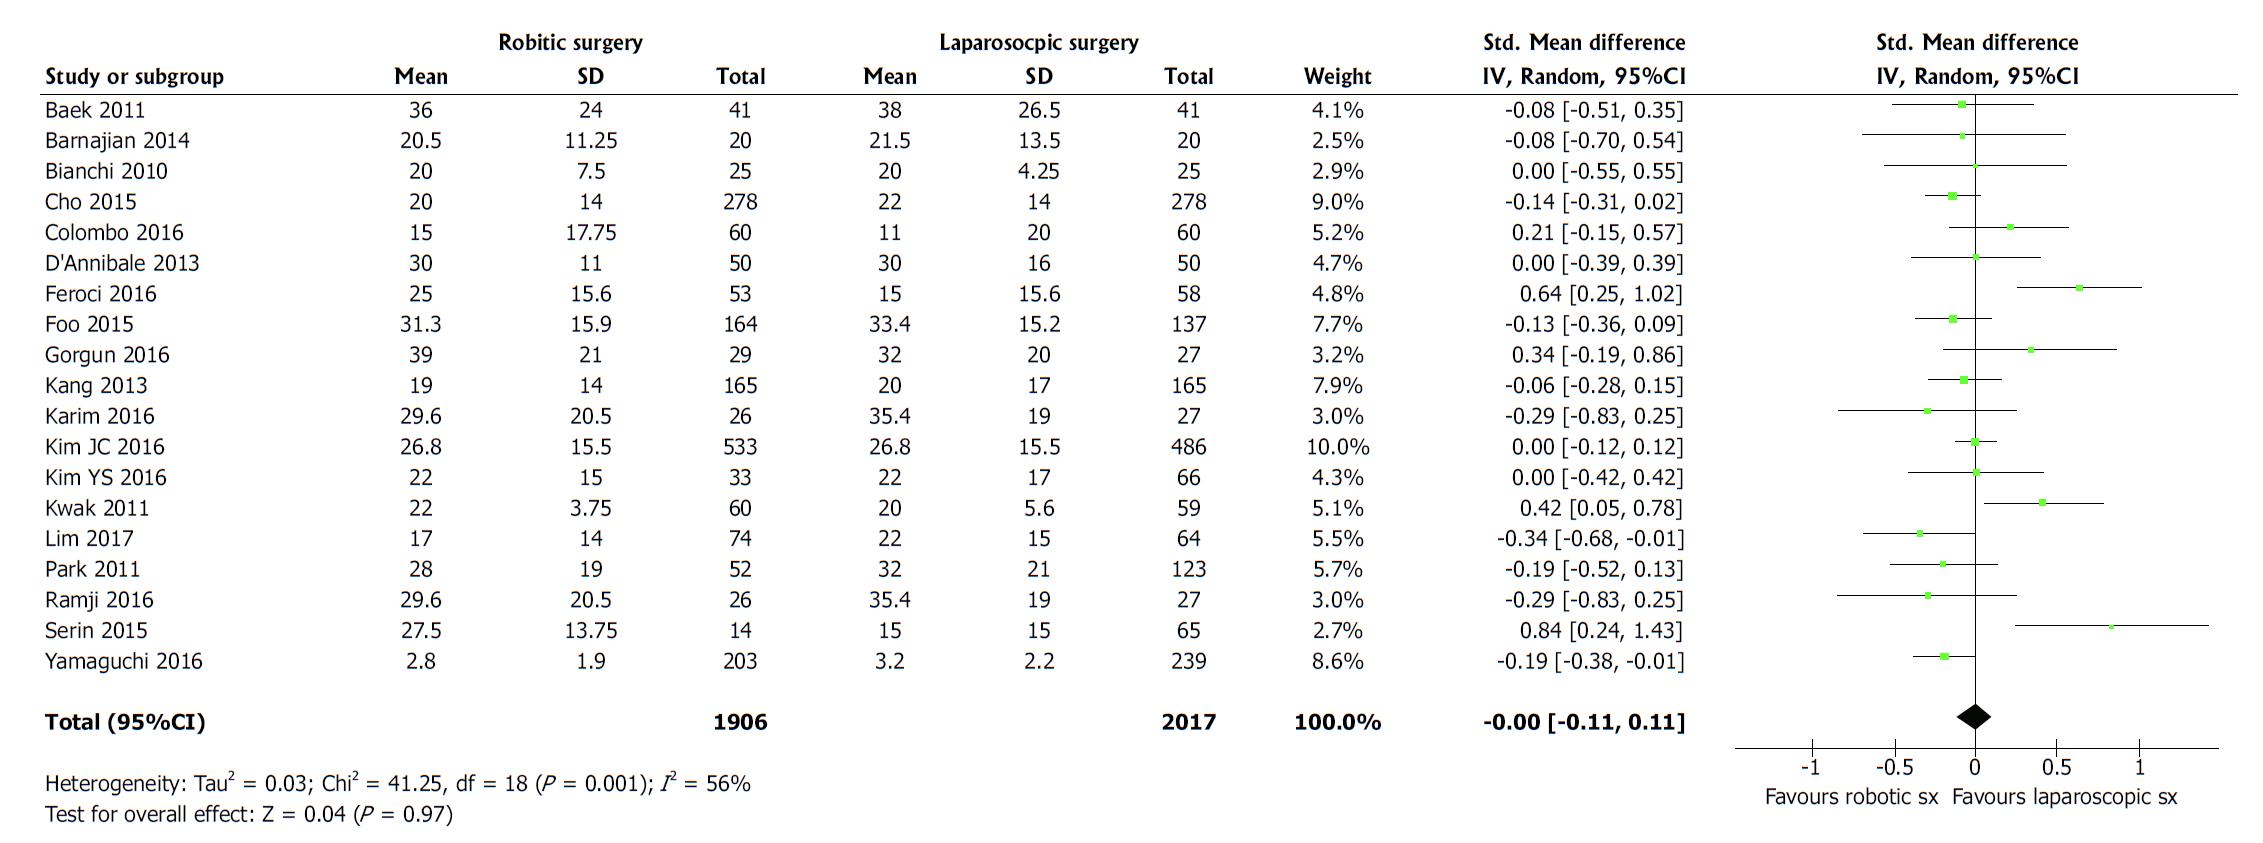
Figure 4 Forest plot for blood loss following rectal resection by robotic surgery vs conventional laparoscopic surgery.
Standardized mean difference is shown with 95%CIs.
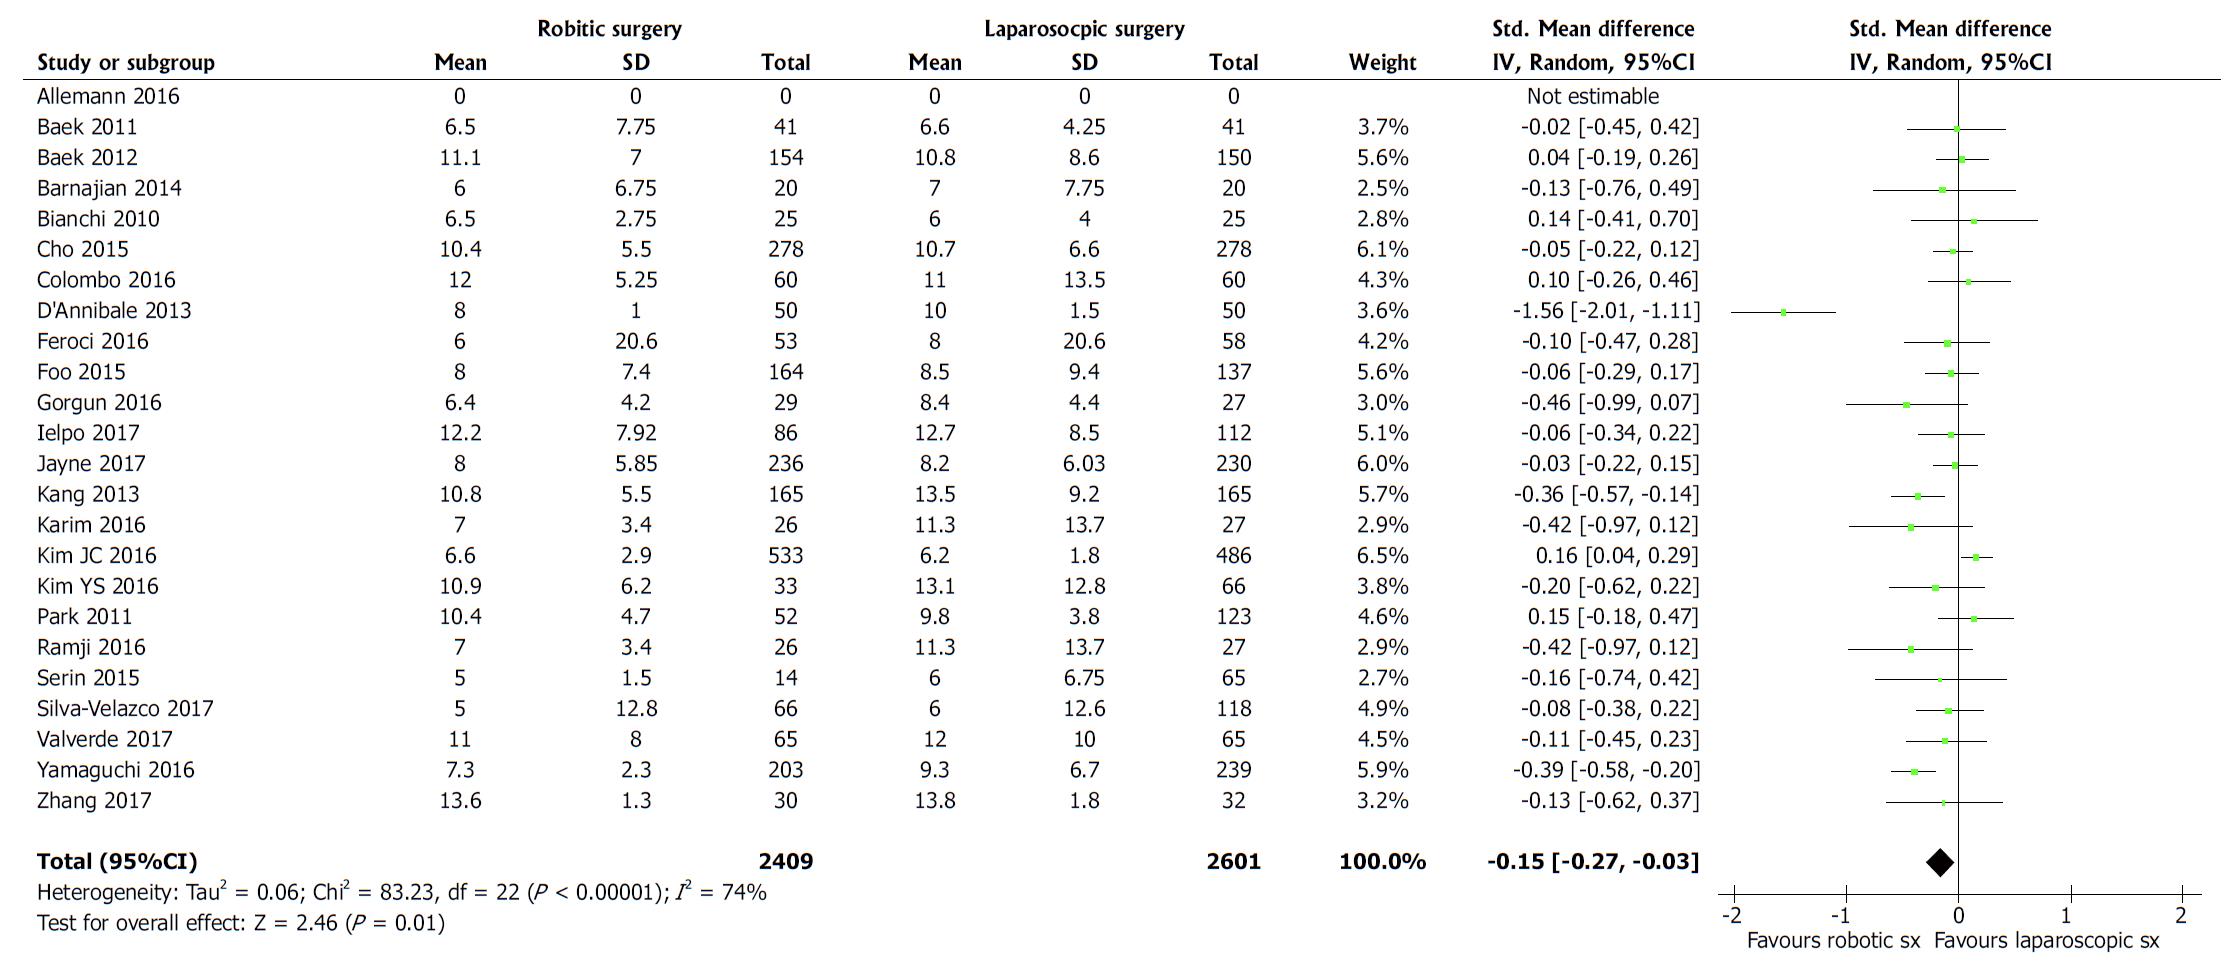
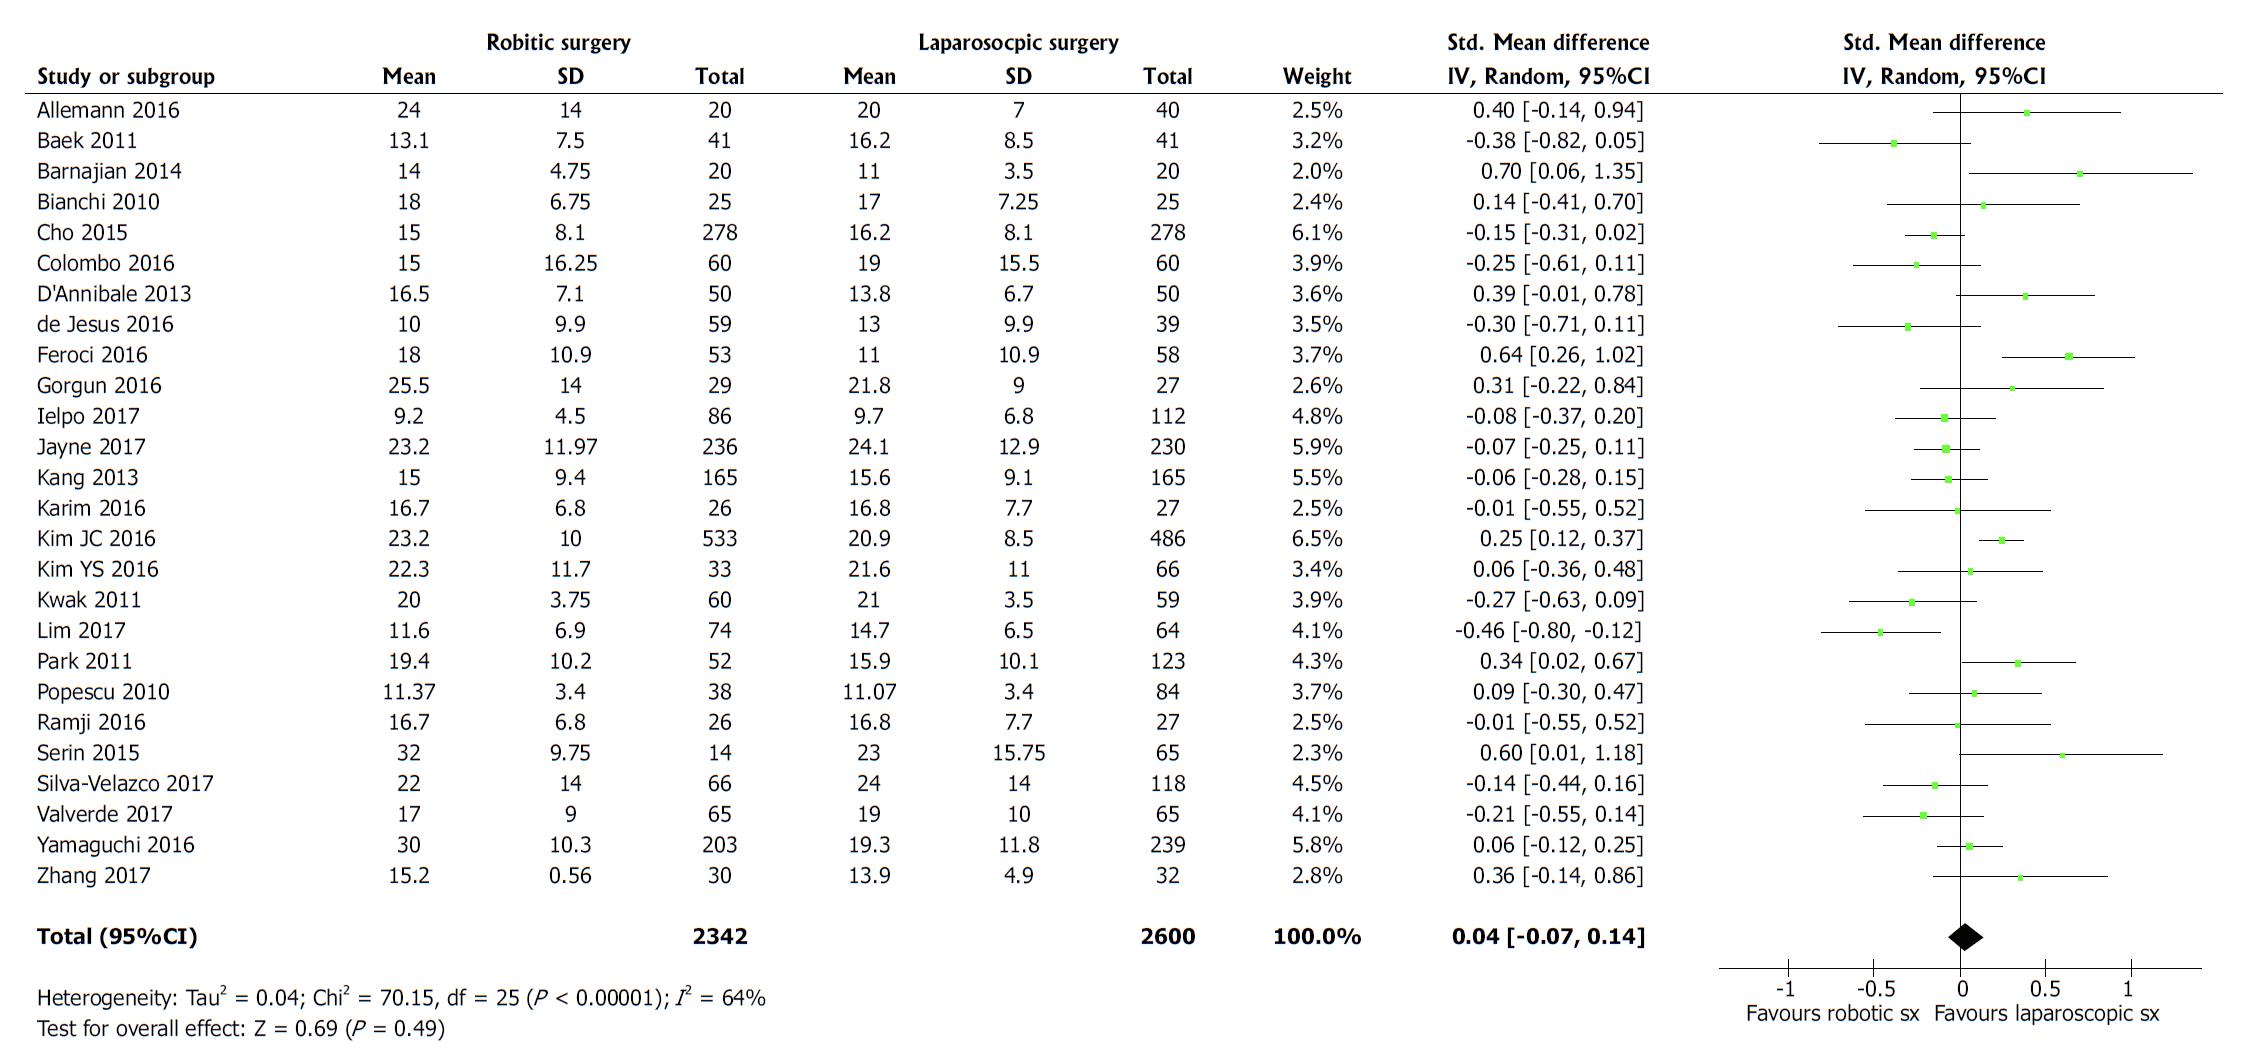
Figure 5 Forest plot for duration of hospital stay following rectal resection by robotic surgery vs conventional laparoscopic surgery.
Standardized mean difference is shown with 95%CIs.
Figure 6 Forest plot for time to first flatus following rectal resection by robotic surgery vs conventional laparoscopic surgery.
Standardized mean difference is shown with 95%CIs.
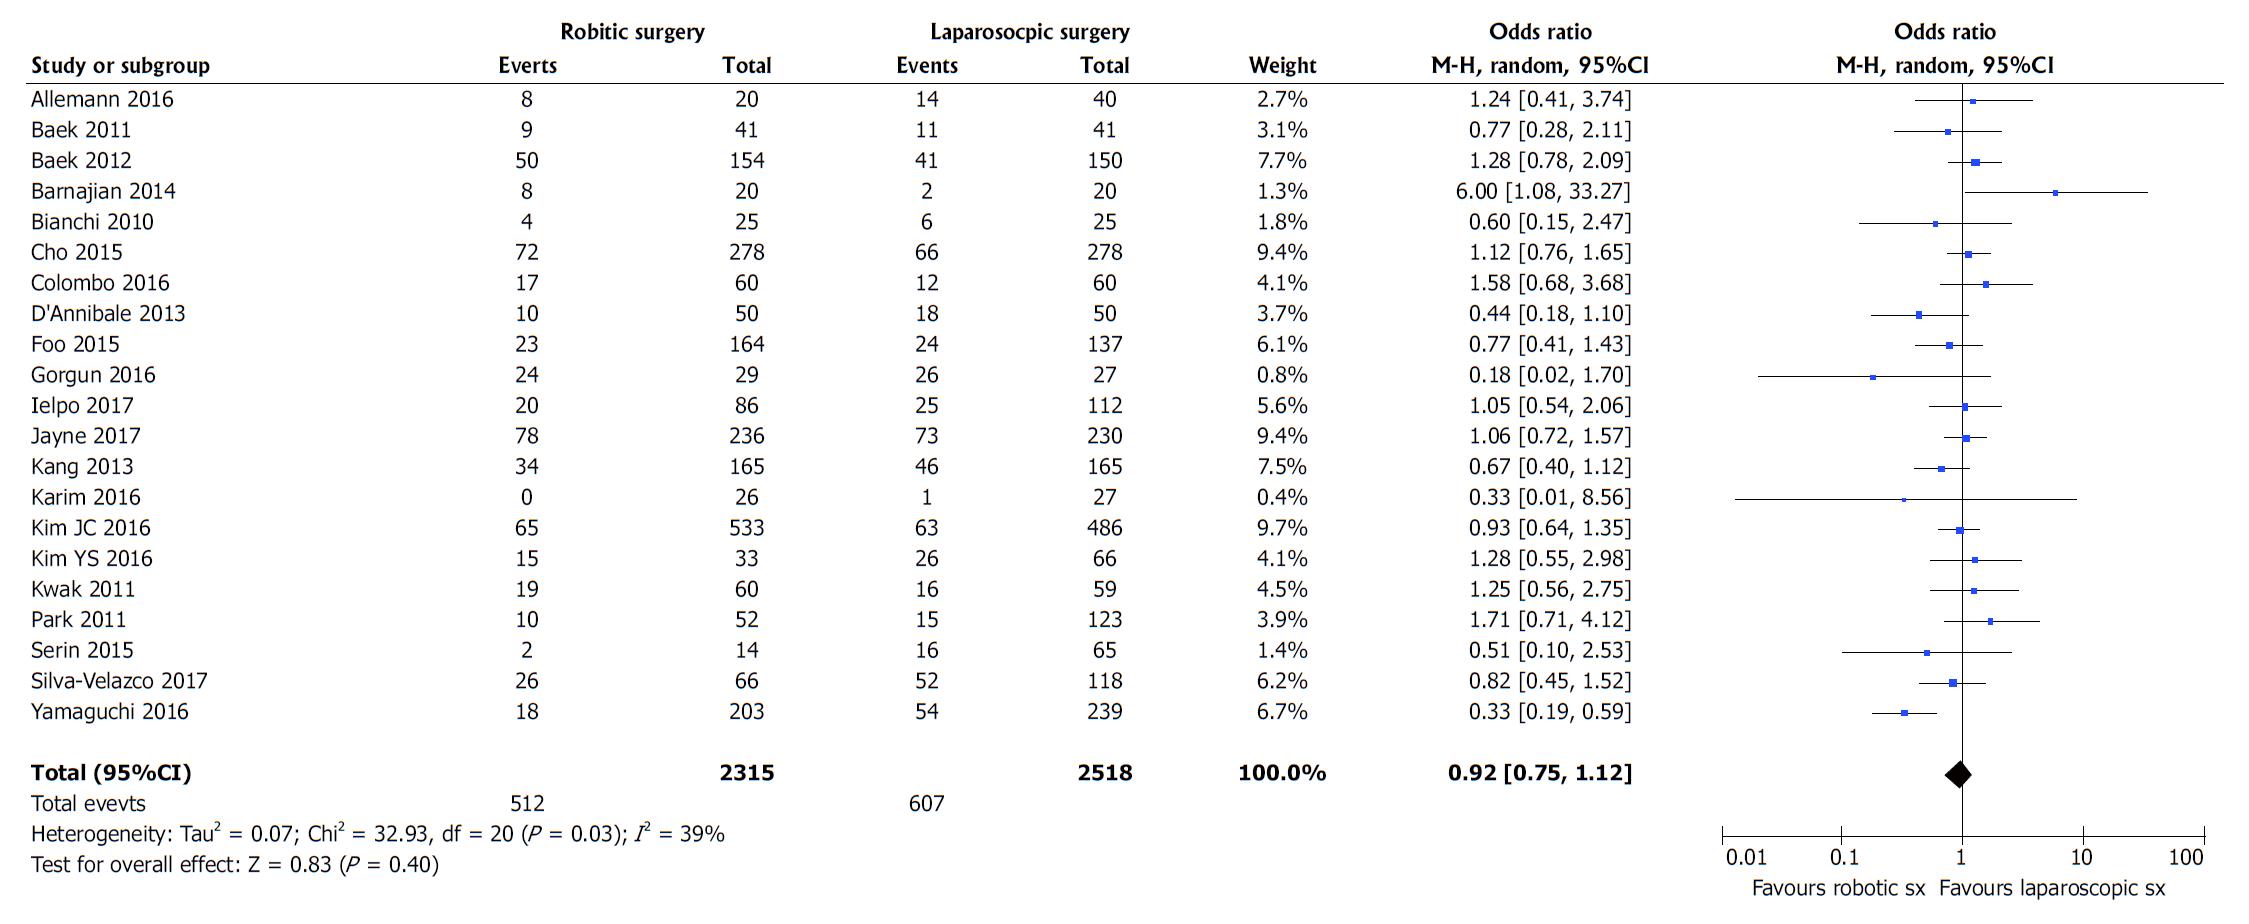
Figure 7 Forest plot for post-operative complications following rectal resection by robotic surgery vs conventional laparoscopic surgery.
Odds ratio is shown with 95%CIs.
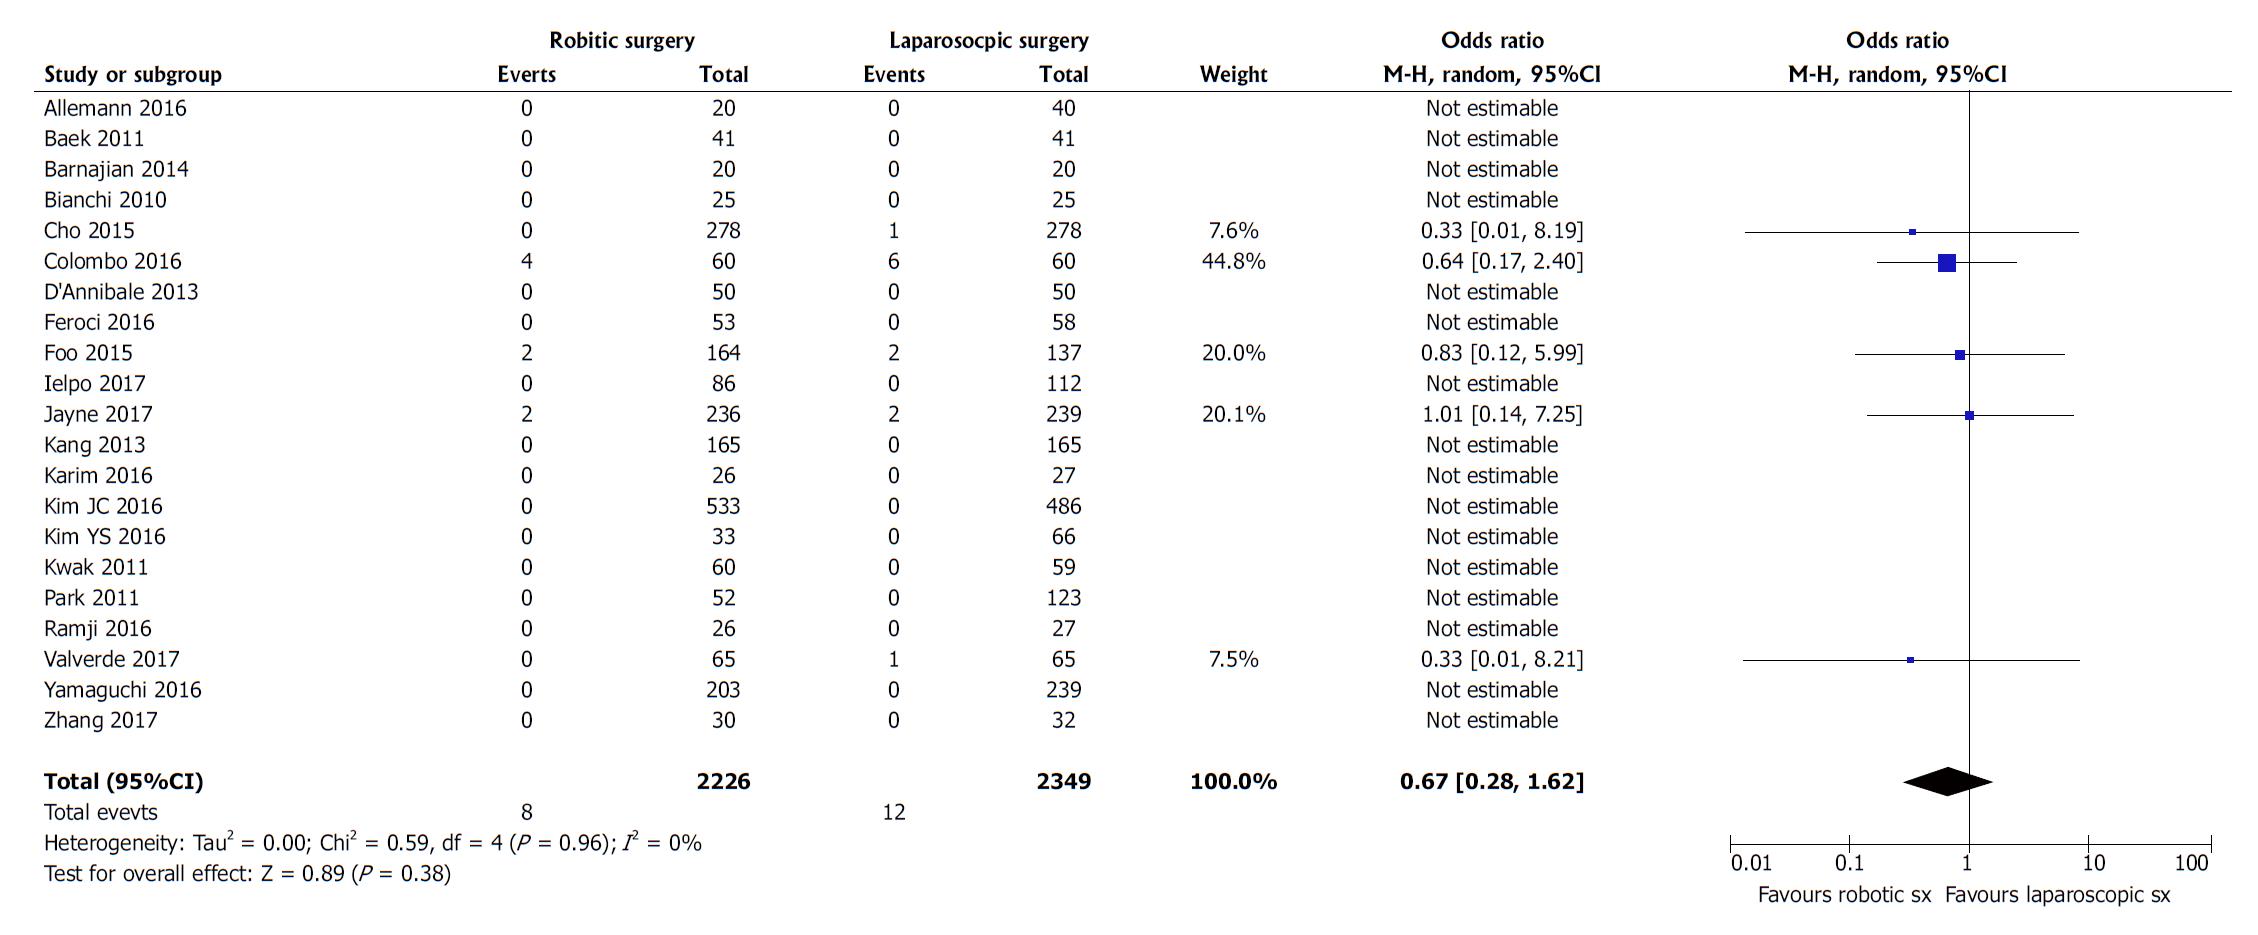
Figure 8 Forest plot for post-operative mortality following rectal resection by robotic surgery vs conventional laparoscopic surgery.
Odds ratio is shown with 95%CIs.
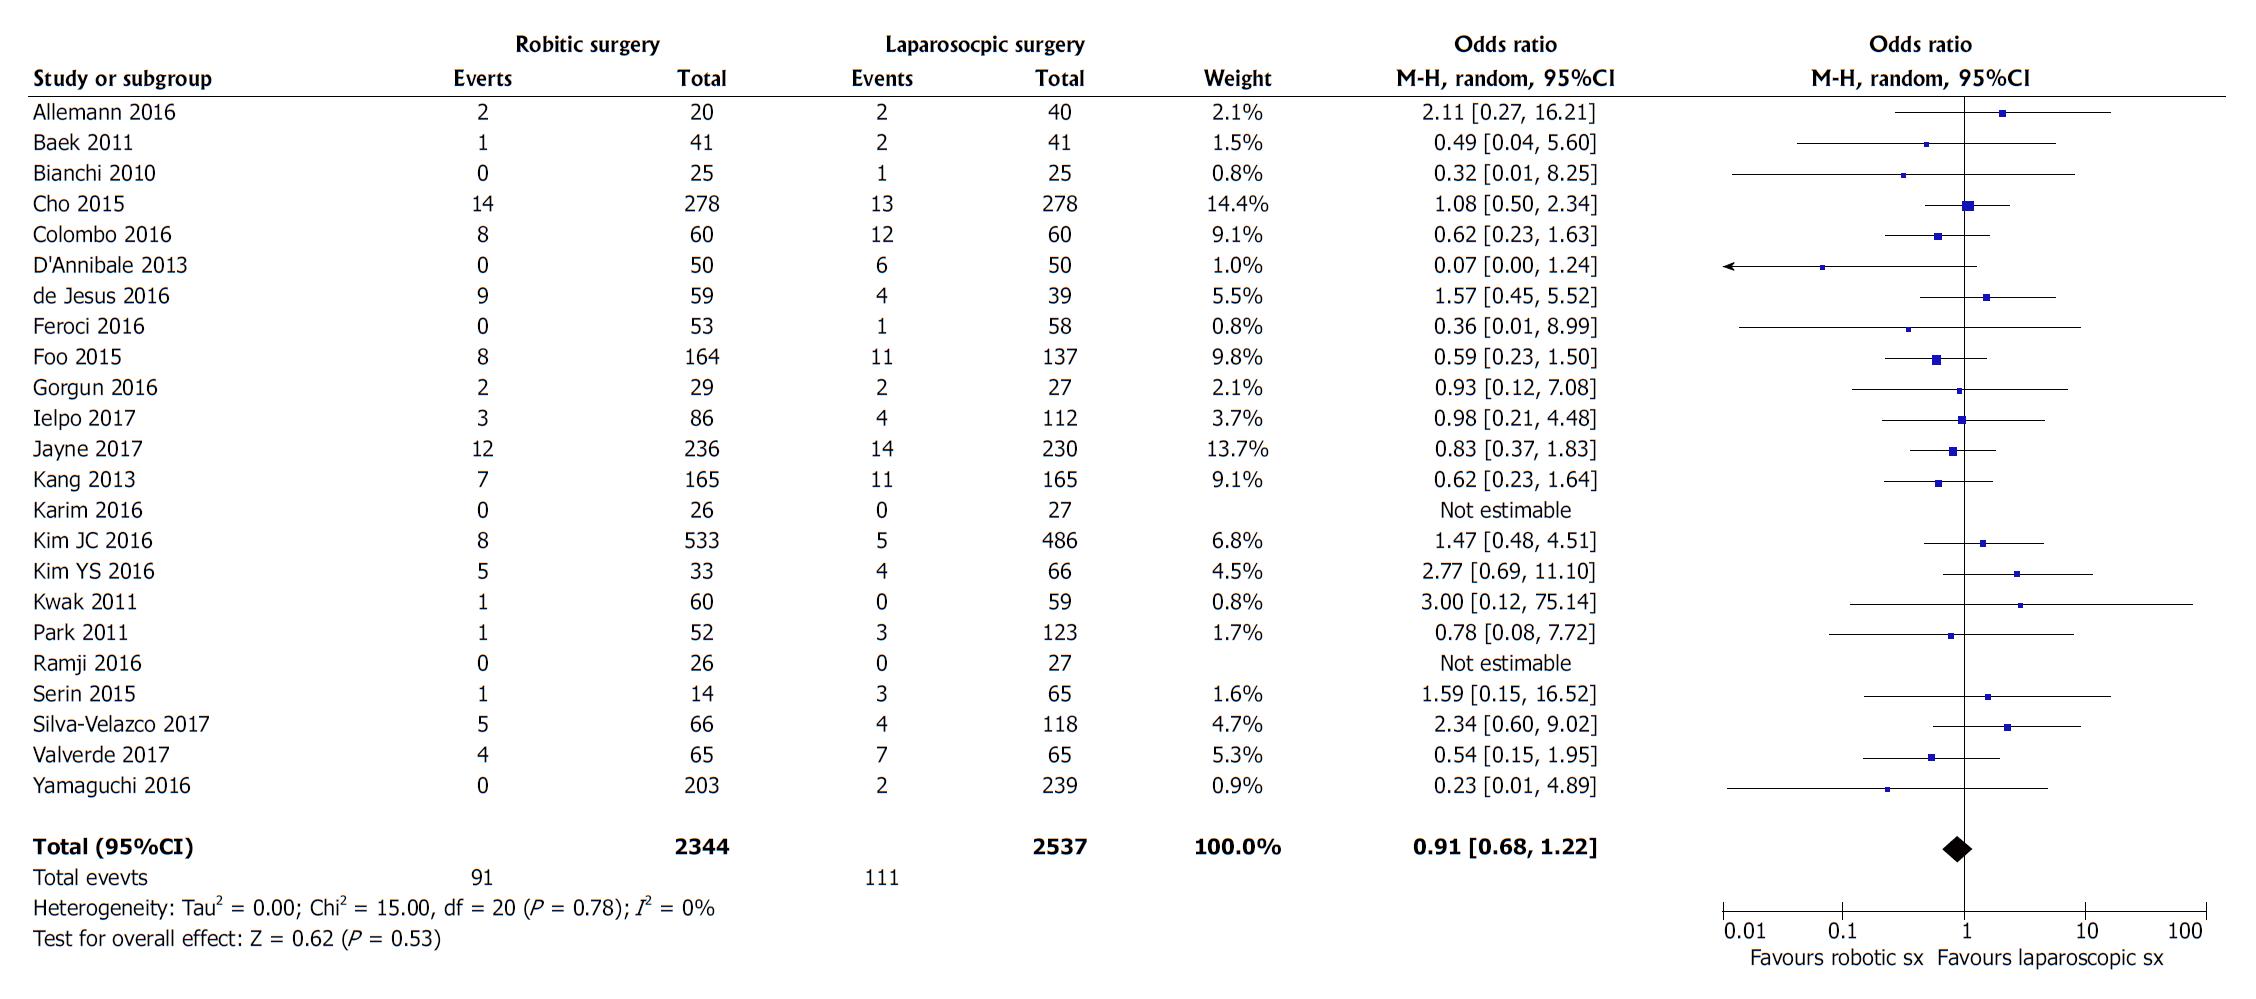
Figure 9 Forest plot for re-operation rate following rectal resection by robotic surgery vs conventional laparoscopic surgery.
Odds ratio is shown with 95%CIs.
Figure 10 Forest plot for positive circumferential resection margins following rectal resection by robotic surgery vs conventional laparoscopic surgery.
Odds ratio is shown with 95%CIs.
Figure 11 Forest plot for length of distal resection margin following rectal resection by robotic surgery vs conventional laparoscopic surgery.
Standardized mean difference is shown with 95%CIs.
Figure 12 Forest plot for lymph node yield following rectal resection by robotic surgery vs conventional laparoscopic surgery.
Standardized mean difference is shown with 95%CIs.
Figure 13 Forest plot for tumour recurrence following rectal resection by robotic surgery vs conventional laparoscopic surgery.
Odds ratio is shown with 95%CIs.
- Citation: Jones K, Qassem MG, Sains P, Baig MK, Sajid MS. Robotic total meso-rectal excision for rectal cancer: A systematic review following the publication of the ROLARR trial. World J Gastrointest Oncol 2018; 10(11): 449-464
- URL: https://www.wjgnet.com/1948-5204/full/v10/i11/449.htm
- DOI: https://dx.doi.org/10.4251/wjgo.v10.i11.449


