Copyright
©2013 Baishideng Publishing Group Co.
World J Gastrointest Endosc. Jul 16, 2013; 5(7): 313-322
Published online Jul 16, 2013. doi: 10.4253/wjge.v5.i7.313
Published online Jul 16, 2013. doi: 10.4253/wjge.v5.i7.313
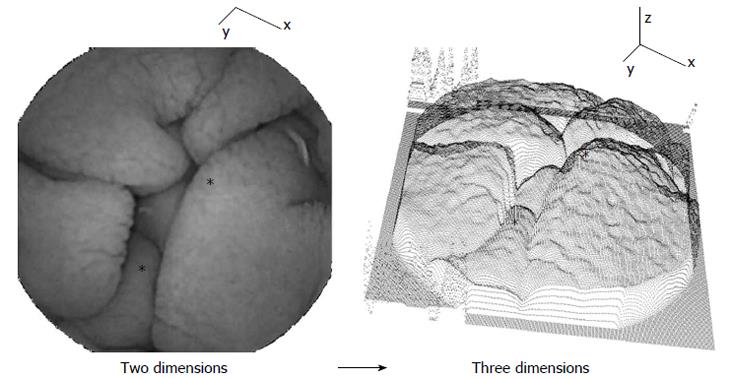
Figure 3 Image transformation from two to three dimensions.
Coordinate axes are shown for reference. Examples of corresponding landmark locations are noted by asterisks. The gray levels of the two-dimensional endoscopic image at left are converted to a depth along the z axis in the three-dimensional projection at right. The characteristics of the surface protrusions in the three-dimensional image are used for distinguishing celiac from control patient data.
- Citation: Ciaccio EJ, Tennyson CA, Bhagat G, Lewis SK, Green PH. Implementation of a polling protocol for predicting celiac disease in videocapsule analysis. World J Gastrointest Endosc 2013; 5(7): 313-322
- URL: https://www.wjgnet.com/1948-5190/full/v5/i7/313.htm
- DOI: https://dx.doi.org/10.4253/wjge.v5.i7.313


