Copyright
©2013 Baishideng Publishing Group Co.
World J Gastrointest Endosc. Jul 16, 2013; 5(7): 313-322
Published online Jul 16, 2013. doi: 10.4253/wjge.v5.i7.313
Published online Jul 16, 2013. doi: 10.4253/wjge.v5.i7.313
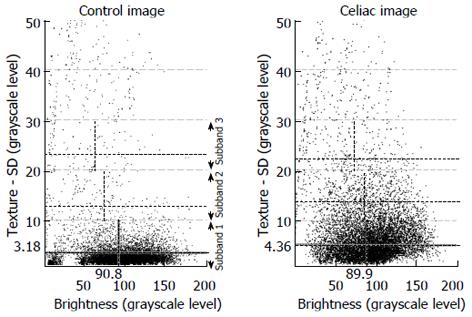
Figure 2 The method of using subbands in the standard deviation of image texture.
Subbands are shown to the right of the control scatterplot. Mean values for each of the two variables are noted as hatched lines in each subband. The subband characteristics differ in celiac vs control videoclip series. In the control scatterplot the points are concentrated at low values of standard deviation in texture. In the celiac scatterplot the points are concentrated at higher values of standard deviation in texture. Thus the celiac image data has a greater variability of pixel gray level, which can be used to distinguish it from the control image data.
- Citation: Ciaccio EJ, Tennyson CA, Bhagat G, Lewis SK, Green PH. Implementation of a polling protocol for predicting celiac disease in videocapsule analysis. World J Gastrointest Endosc 2013; 5(7): 313-322
- URL: https://www.wjgnet.com/1948-5190/full/v5/i7/313.htm
- DOI: https://dx.doi.org/10.4253/wjge.v5.i7.313


