Copyright
©The Author(s) 2016.
World J Gastrointest Endosc. Aug 10, 2016; 8(15): 517-532
Published online Aug 10, 2016. doi: 10.4253/wjge.v8.i15.517
Published online Aug 10, 2016. doi: 10.4253/wjge.v8.i15.517
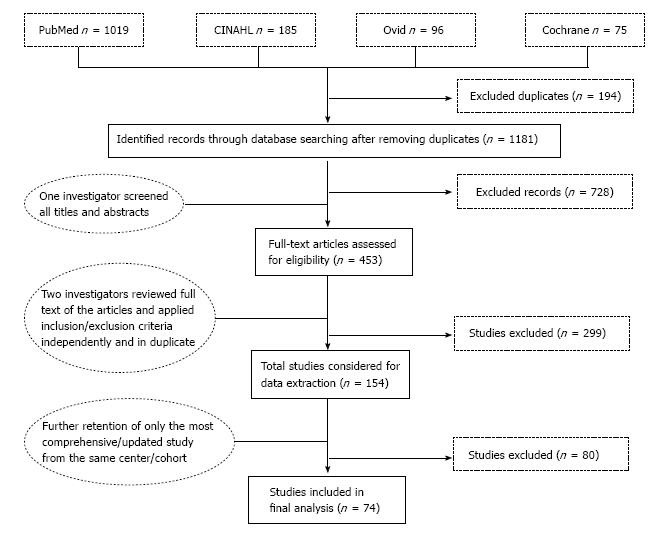
Figure 1 Screening and selection process.
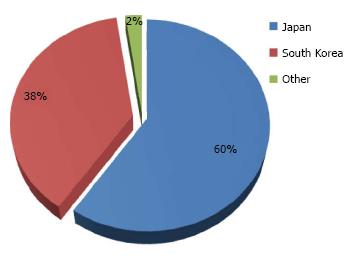
Figure 2 Percentage distribution of 27155 patients who underwent gastric endoscopic submucosal dissection between 1999 and 2014 in 11 countries.
Others include China, Taiwan, Australia, Germany, Italy, Poland, Portugal, Brazil and Uruguay that contributed ≤ 1% each.
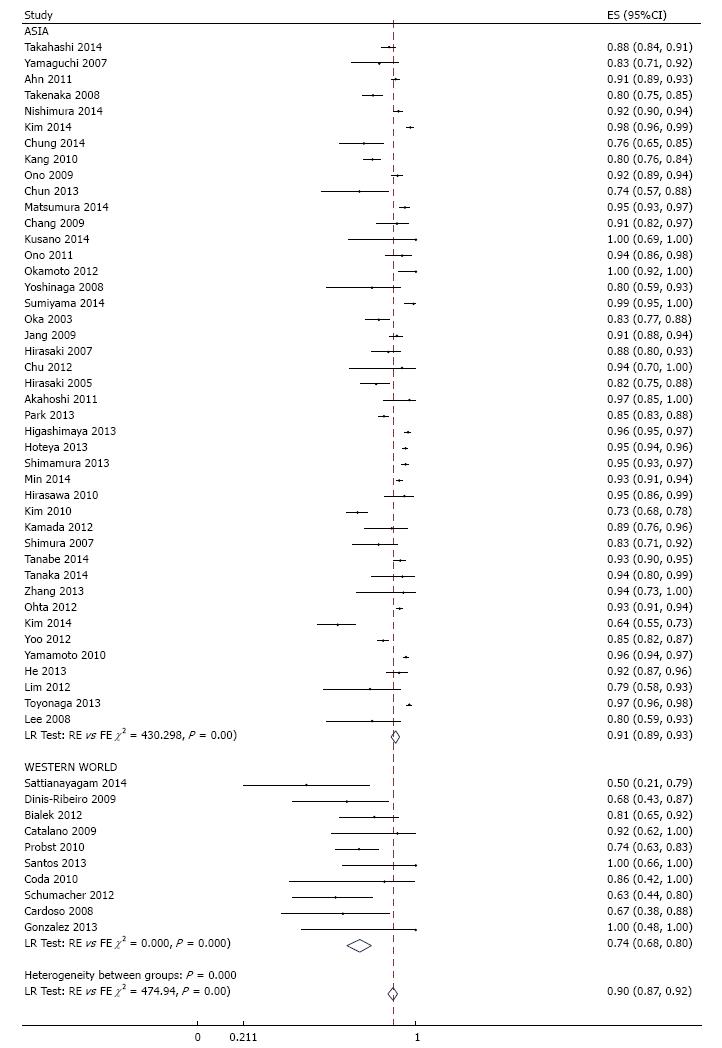
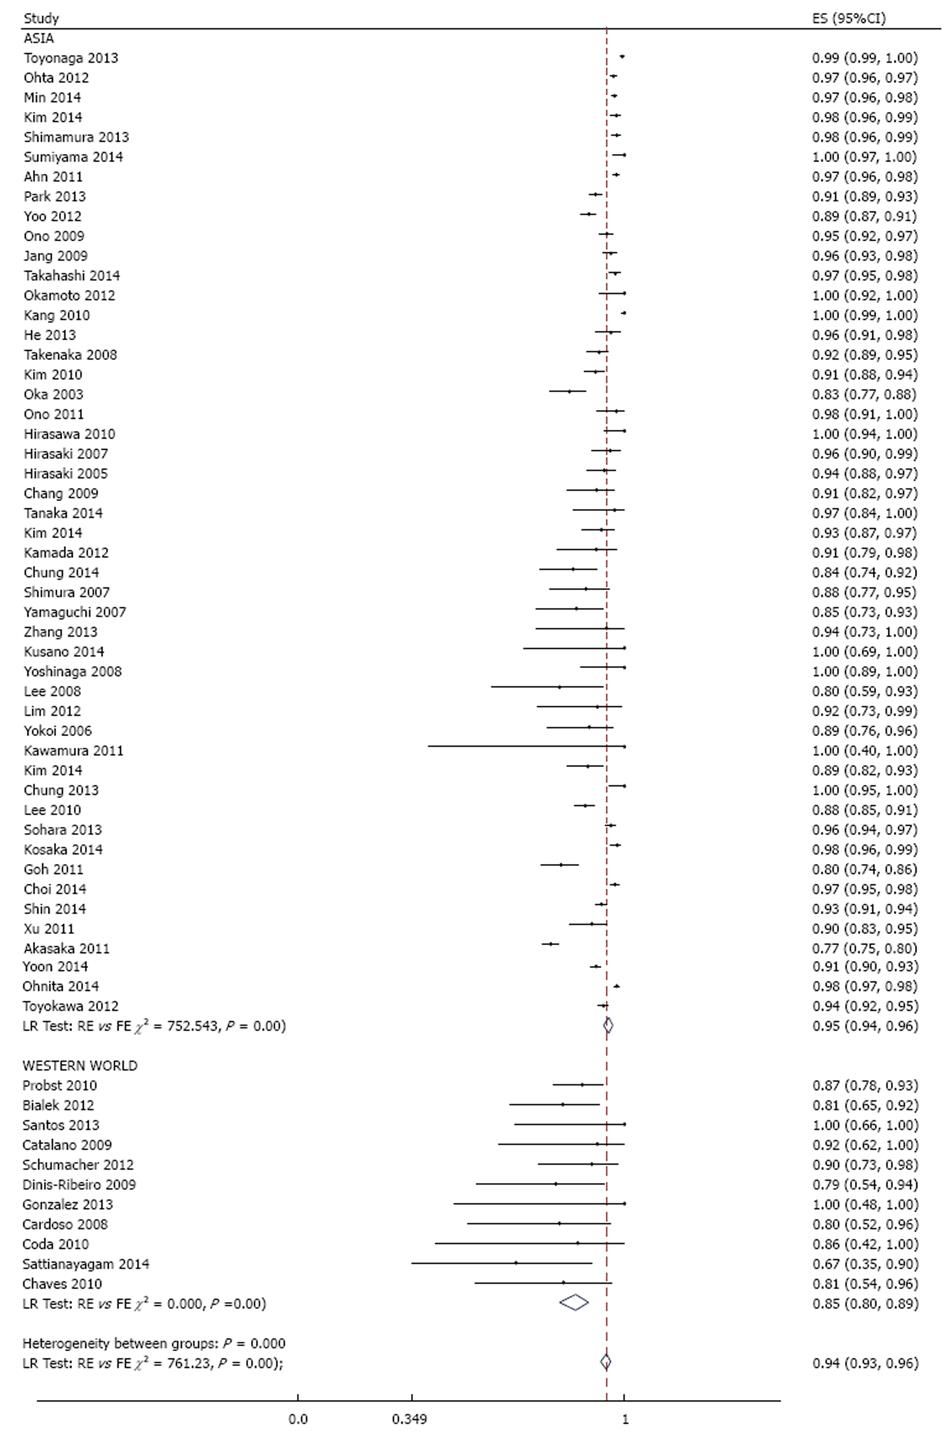
Figure 3 Meta-analysis of histologic en bloc resection rate in 53 studies involving 18017 tumors in 16472 patients that underwent gastric endoscopic submucosal dissection, stratified by region.
Each dot and the horizontal line through them correspond to the point estimate and confidence interval from each study respectively while the center and width of the diamond corresponds to the pooled estimate and its confidence interval respectively. Even though weighting (not shown) was done, it is not explicit because an iterative procedure was used in parameter estimation. ES: Estimate.
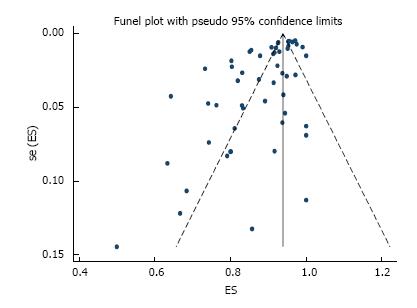
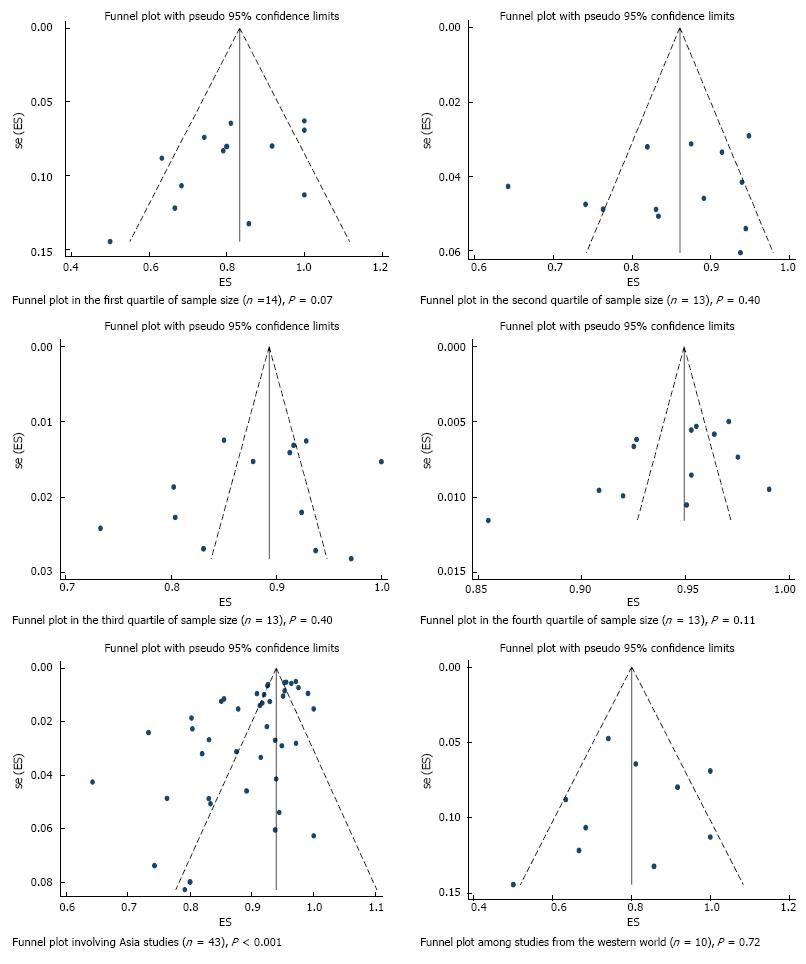
Figure 4 Funnel plot of histologically confirmed en bloc (R0) resection rate in 53 studies involving 18017 tumors in 16472 patients that underwent gastric endoscopic submucosal dissection.
Each dot represents the R0 resection rate. Asymmetry in the distribution of study estimates around the center of the funnel suggests a potential publication bias. P value for egger’s test < 0.001. ES: Estimate; se (ES): Standard error of estimate.
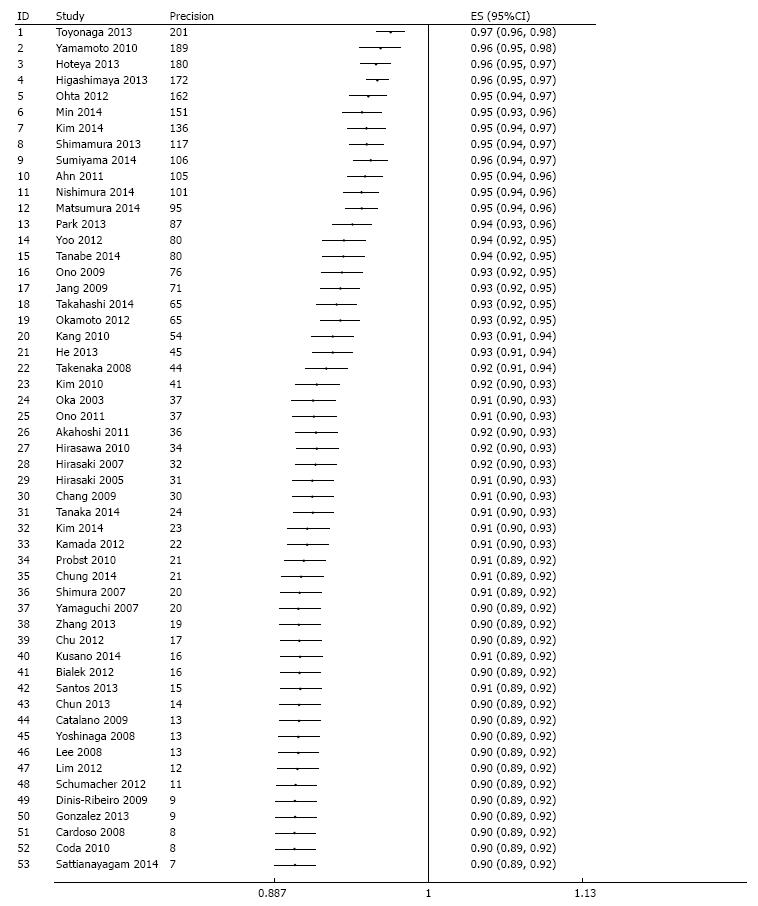
Figure 5 Evaluation of potential publication bias via a cumulative meta-analysis plotted as a function of study precision.
The dots and the error bars correspond to the cumulative estimates and associated 95%CI respectively. After sorting by precision (calculated as inverse of standard error) from most precise to least precise study, a variance - weighted method was used to obtain cumulative meta-analysis estimates by adding one study at a time. Analysis begins with the most precise study; thereafter, effect estimate from the next study in order of decreasing precision are added at each step in the analysis and cumulative estimate and 95%CI is recalculated until the least precise study is added.
Figure 6 Funnel plot of histologically confirmed en bloc (R0) resection rate in 53 studies involving 18017 tumors in 16472 patients that underwent gastric endoscopic submucosal dissection, stratified based on sources of heterogeneity.
Each dot represents the R0 resection rate. Lack of asymmetry in the funnel plot within quartile of study precision (calculated as inverse of standard error) indicates that the asymmetry in the overall plot (Figure 4) is most likely due to true heterogeneity by sample size rather than a publication bias. P values were calculated based on egger’s test. ES: Estimate; se (ES): Standard error of estimate.
Figure 7 Meta-analysis of endoscopic en bloc resection rate in 60 studies involving 21511 tumors in 19935 patients that underwent gastric endoscopic submucosal dissection, stratified by region.
Each dot and the horizontal line through them correspond to the point estimate and confidence interval from each study respectively while the center and width of the diamond corresponds to the pooled estimate and its confidence interval respectively. Even though weighting (not shown) was done, it is not explicit because an iterative procedure was used in parameter estimation. ES: Estimate.
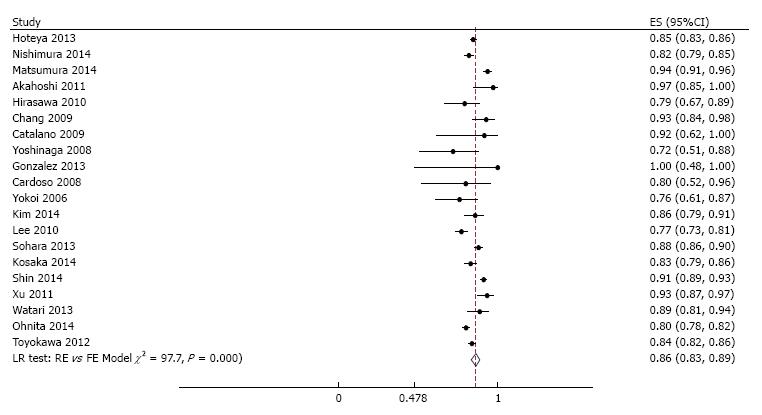
Figure 8 Meta-analysis of curative resection rate in 20 studies involving 8589 tumors in 7785 patients that underwent gastric endoscopic submucosal dissection.
Each dot and the horizontal line through them correspond to the point estimate and confidence interval from each study respectively while the center and width of the diamond corresponds to the pooled estimate and its confidence interval respectively. Even though weighting (not shown) was done, it is not explicit because an iterative procedure was used in parameter estimation. All studies except one (Emura 2014, Colombia) were from Asia. ES: Estimate.
- Citation: Akintoye E, Obaitan I, Muthusamy A, Akanbi O, Olusunmade M, Levine D. Endoscopic submucosal dissection of gastric tumors: A systematic review and meta-analysis. World J Gastrointest Endosc 2016; 8(15): 517-532
- URL: https://www.wjgnet.com/1948-5190/full/v8/i15/517.htm
- DOI: https://dx.doi.org/10.4253/wjge.v8.i15.517


