Copyright
©2014 Baishideng Publishing Group Inc.
World J Gastrointest Endosc. Nov 16, 2014; 6(11): 555-563
Published online Nov 16, 2014. doi: 10.4253/wjge.v6.i11.555
Published online Nov 16, 2014. doi: 10.4253/wjge.v6.i11.555
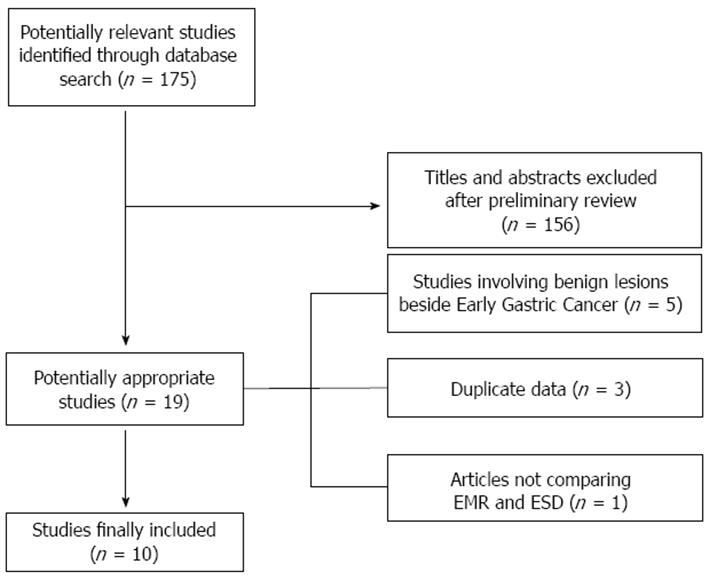
Figure 1 Flow chart of the search strategy.
EMR: Endoscopic mucosal resection; ESD: Endoscopic submucosal dissection.
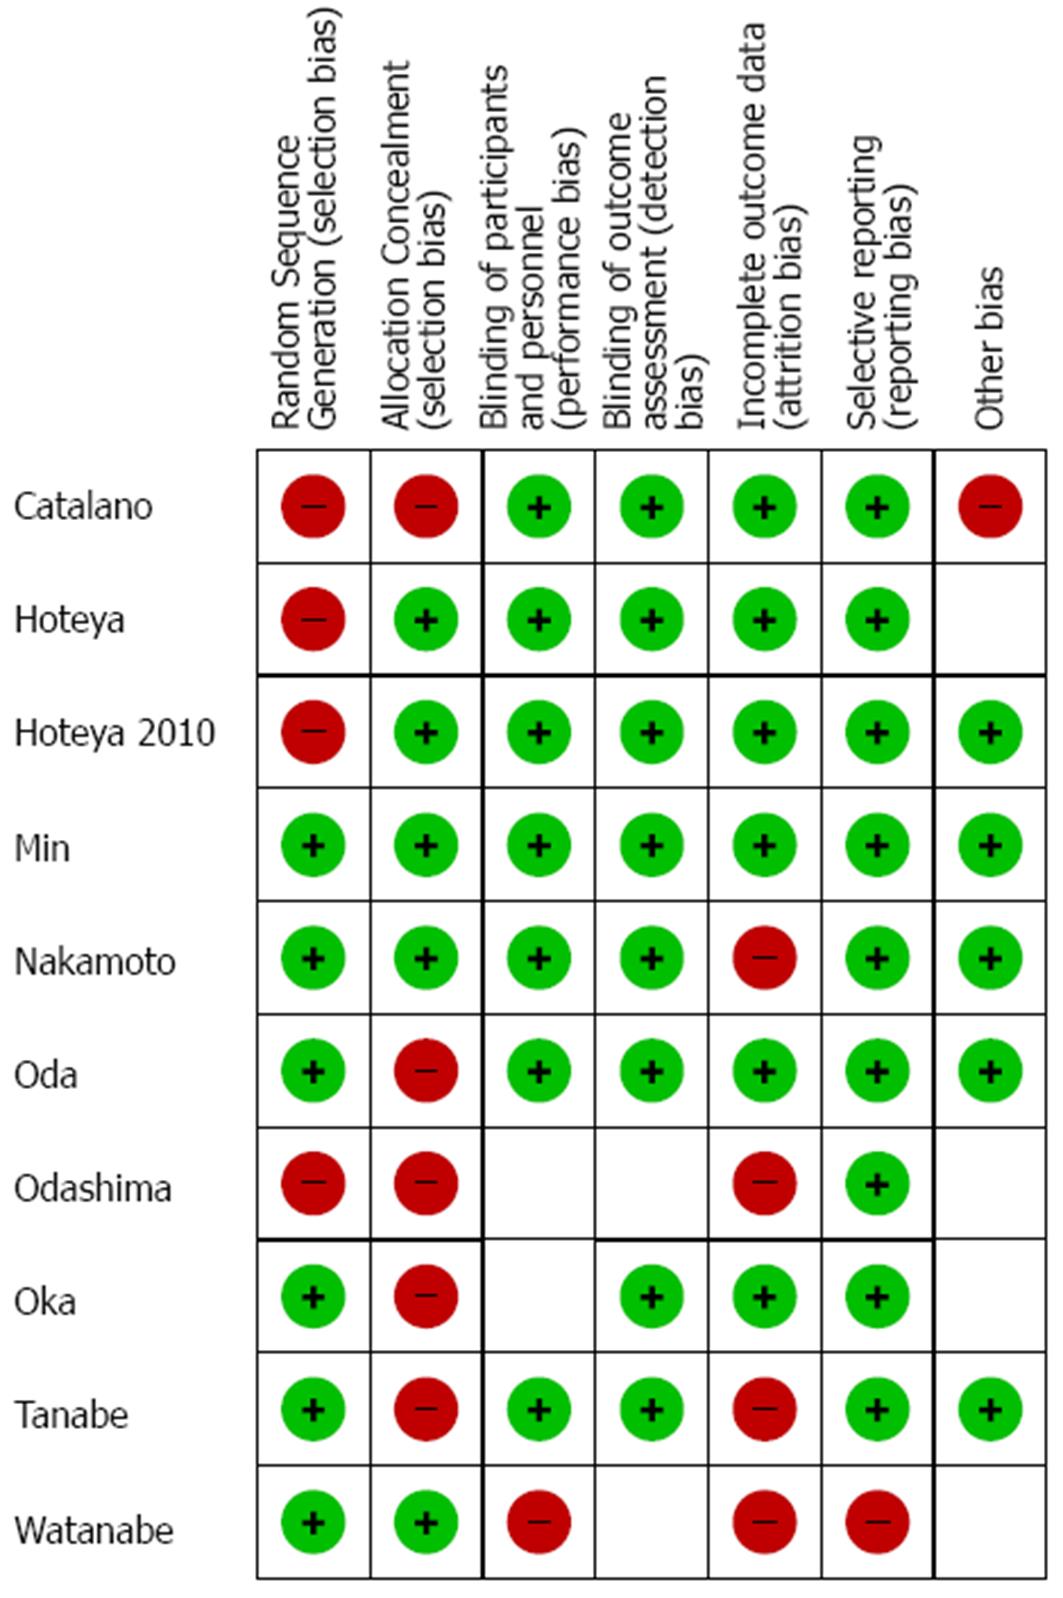
Figure 2 Quality of included studies according to the Cochrane Collaboration guidelines[7].
Figure 3 Forest plot of mean operation time.
ESD: Endoscopic submucosal dissection; EMR: Endoscopic mucosal resection; df: Degrees of freedom.
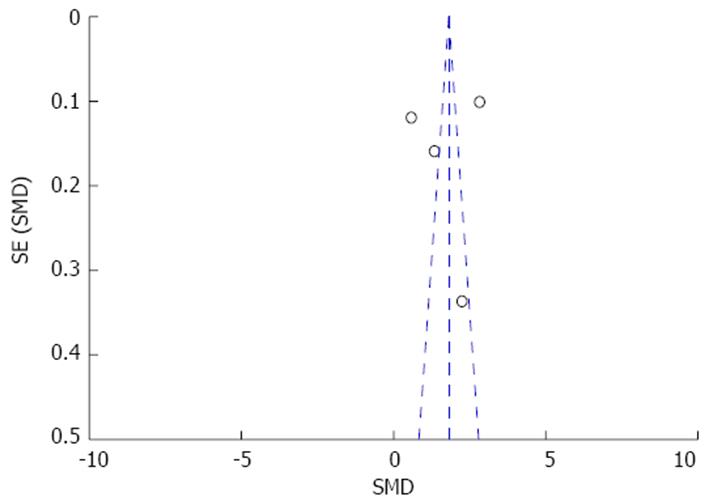
Figure 4 Funnel plot of publication bias for mean operation time.
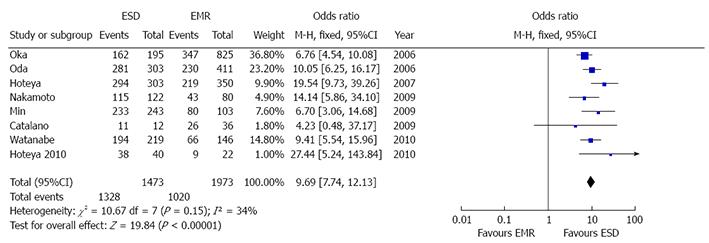
Figure 5 Forest plot of en bloc resection rate.
ESD: Endoscopic submucosal dissection; EMR: Endoscopic mucosal resection; M-H: Mantel-Haenszel; df: Degrees of freedom.
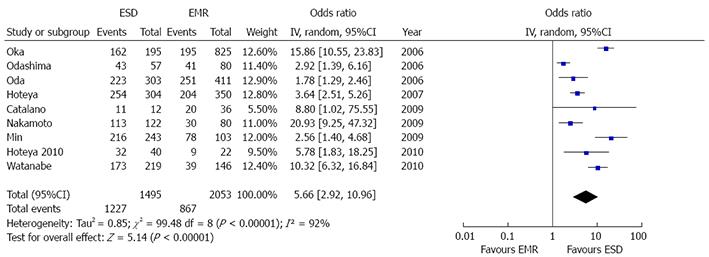
Figure 6 Forest plot of complete histologic resection rate.
ESD: Endoscopic submucosal dissection; EMR: Endoscopic mucosal resection; IV: Inverse variance; df: Degrees of freedom.
Figure 7 Forest plot of recurrence rate.
ESD: Endoscopic submucosal dissection; EMR: Endoscopic mucosal resection; M-H: Mantel-Haenszel; df: Degrees of freedom.
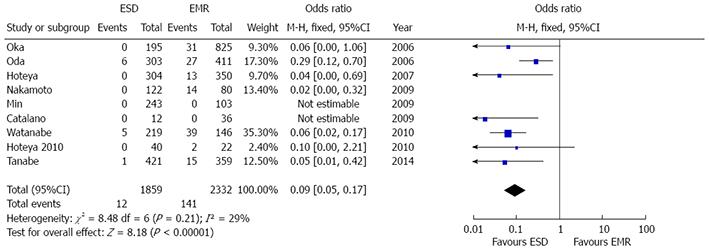
Figure 8 Forest plot of perforation rate.
ESD: Endoscopic submucosal dissection; EMR: Endoscopic mucosal resection; M-H: Mantel-Haenszel; df: Degrees of freedom.
Figure 9 Forest plot of bleeding rate.
ESD: Endoscopic submucosal dissection; EMR: Endoscopic mucosal resection; M-H: Mantel-Haenszel; df: Degrees of freedom.
-
Citation: Facciorusso A, Antonino M, Di Maso M, Muscatiello N. Endoscopic submucosal dissection
vs endoscopic mucosal resection for early gastric cancer: A meta-analysis. World J Gastrointest Endosc 2014; 6(11): 555-563 - URL: https://www.wjgnet.com/1948-5190/full/v6/i11/555.htm
- DOI: https://dx.doi.org/10.4253/wjge.v6.i11.555


