
















Copyright: ©Author(s) 2026.
World J Gastrointest Endosc. Oct 16, 2026; 18(10): 125082
Published online Oct 16, 2026. doi: 10.4253/wjge.125082
Published online Oct 16, 2026. doi: 10.4253/wjge.125082
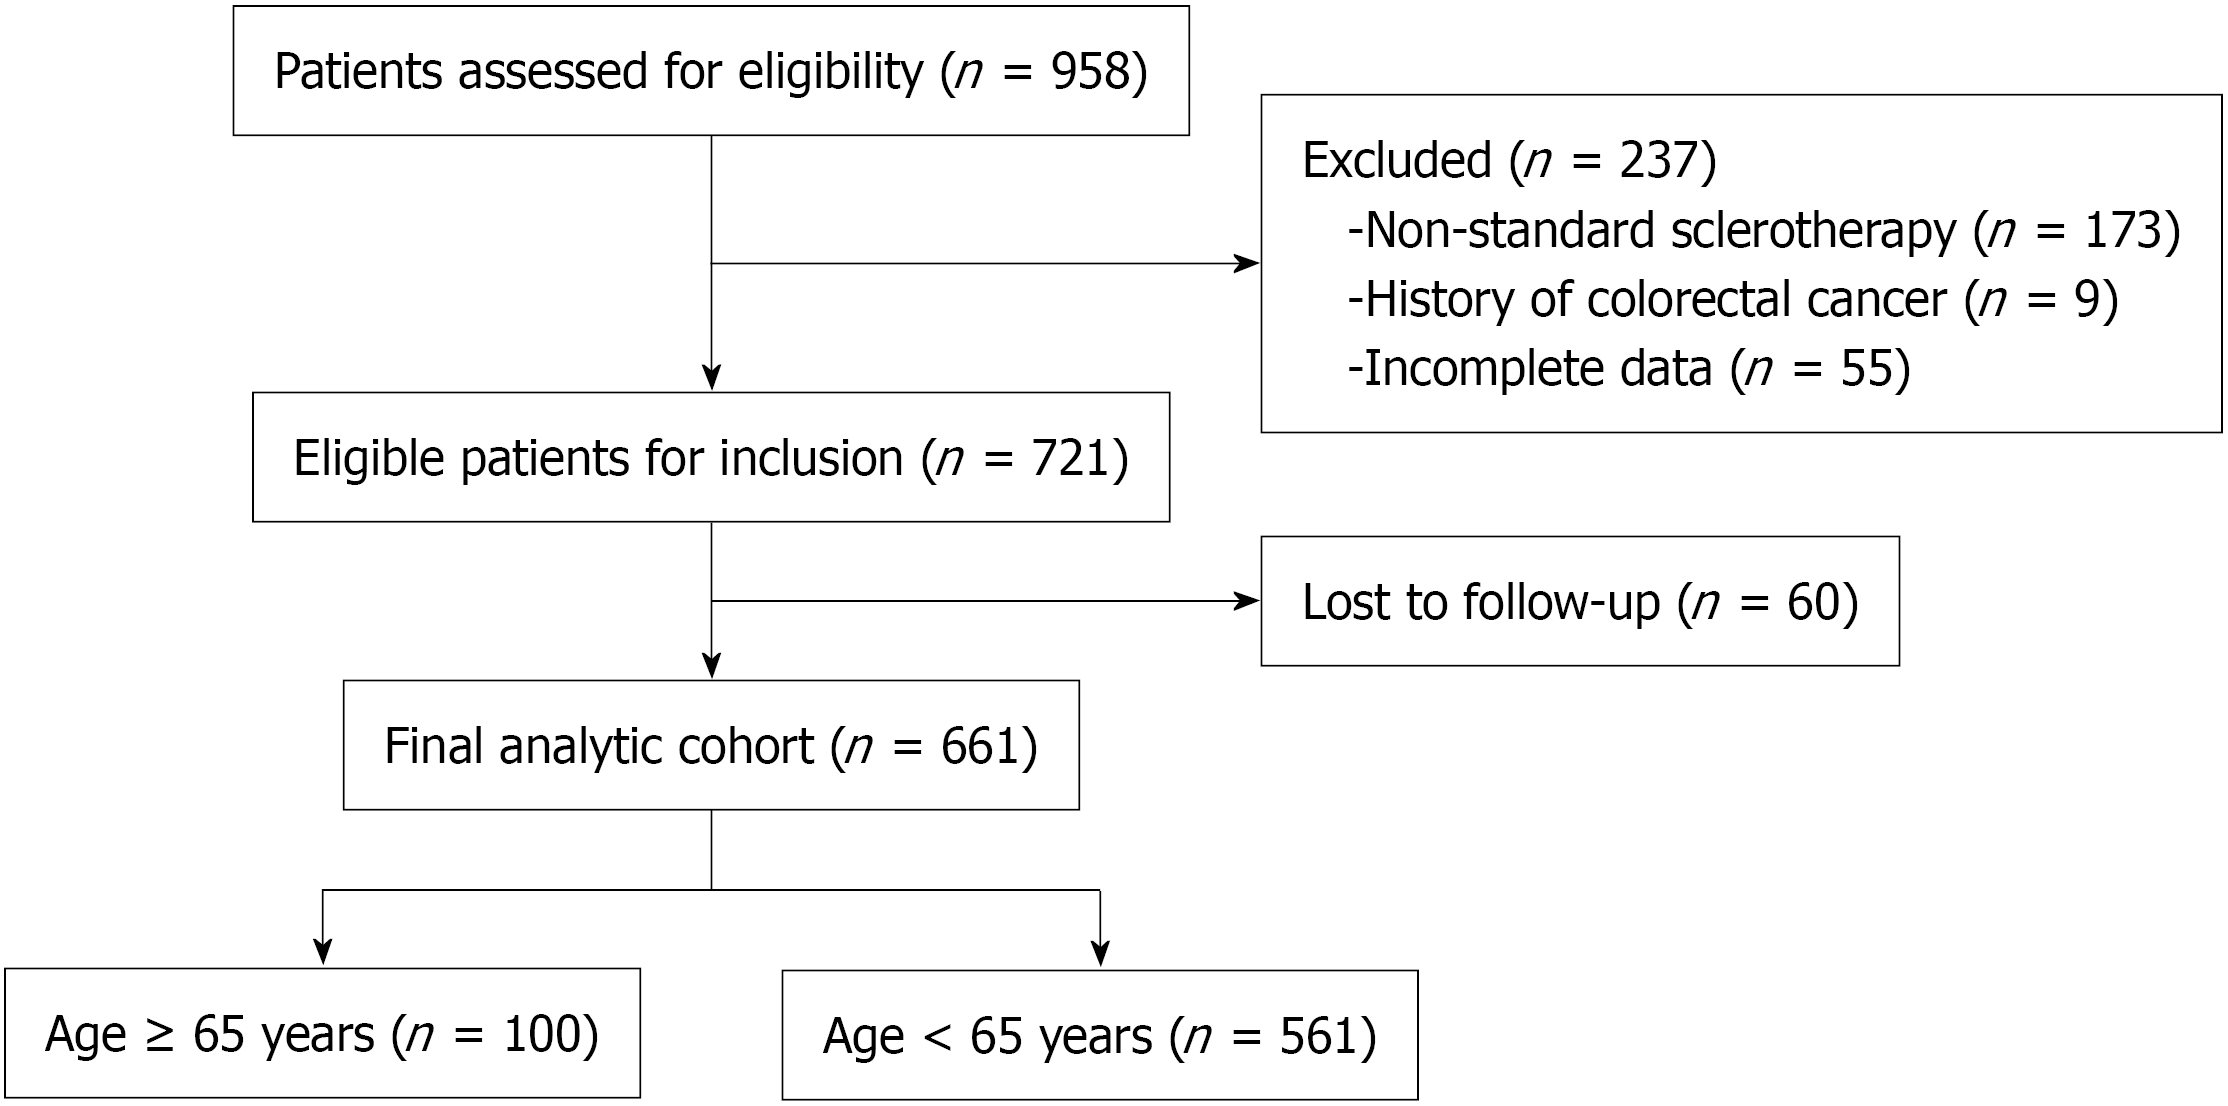
Figure 1 Flow diagram of patient selection and cohort formation.
The flow diagram shows the screening, exclusion, loss to follow-up, and final inclusion of patients in the analytic cohort.
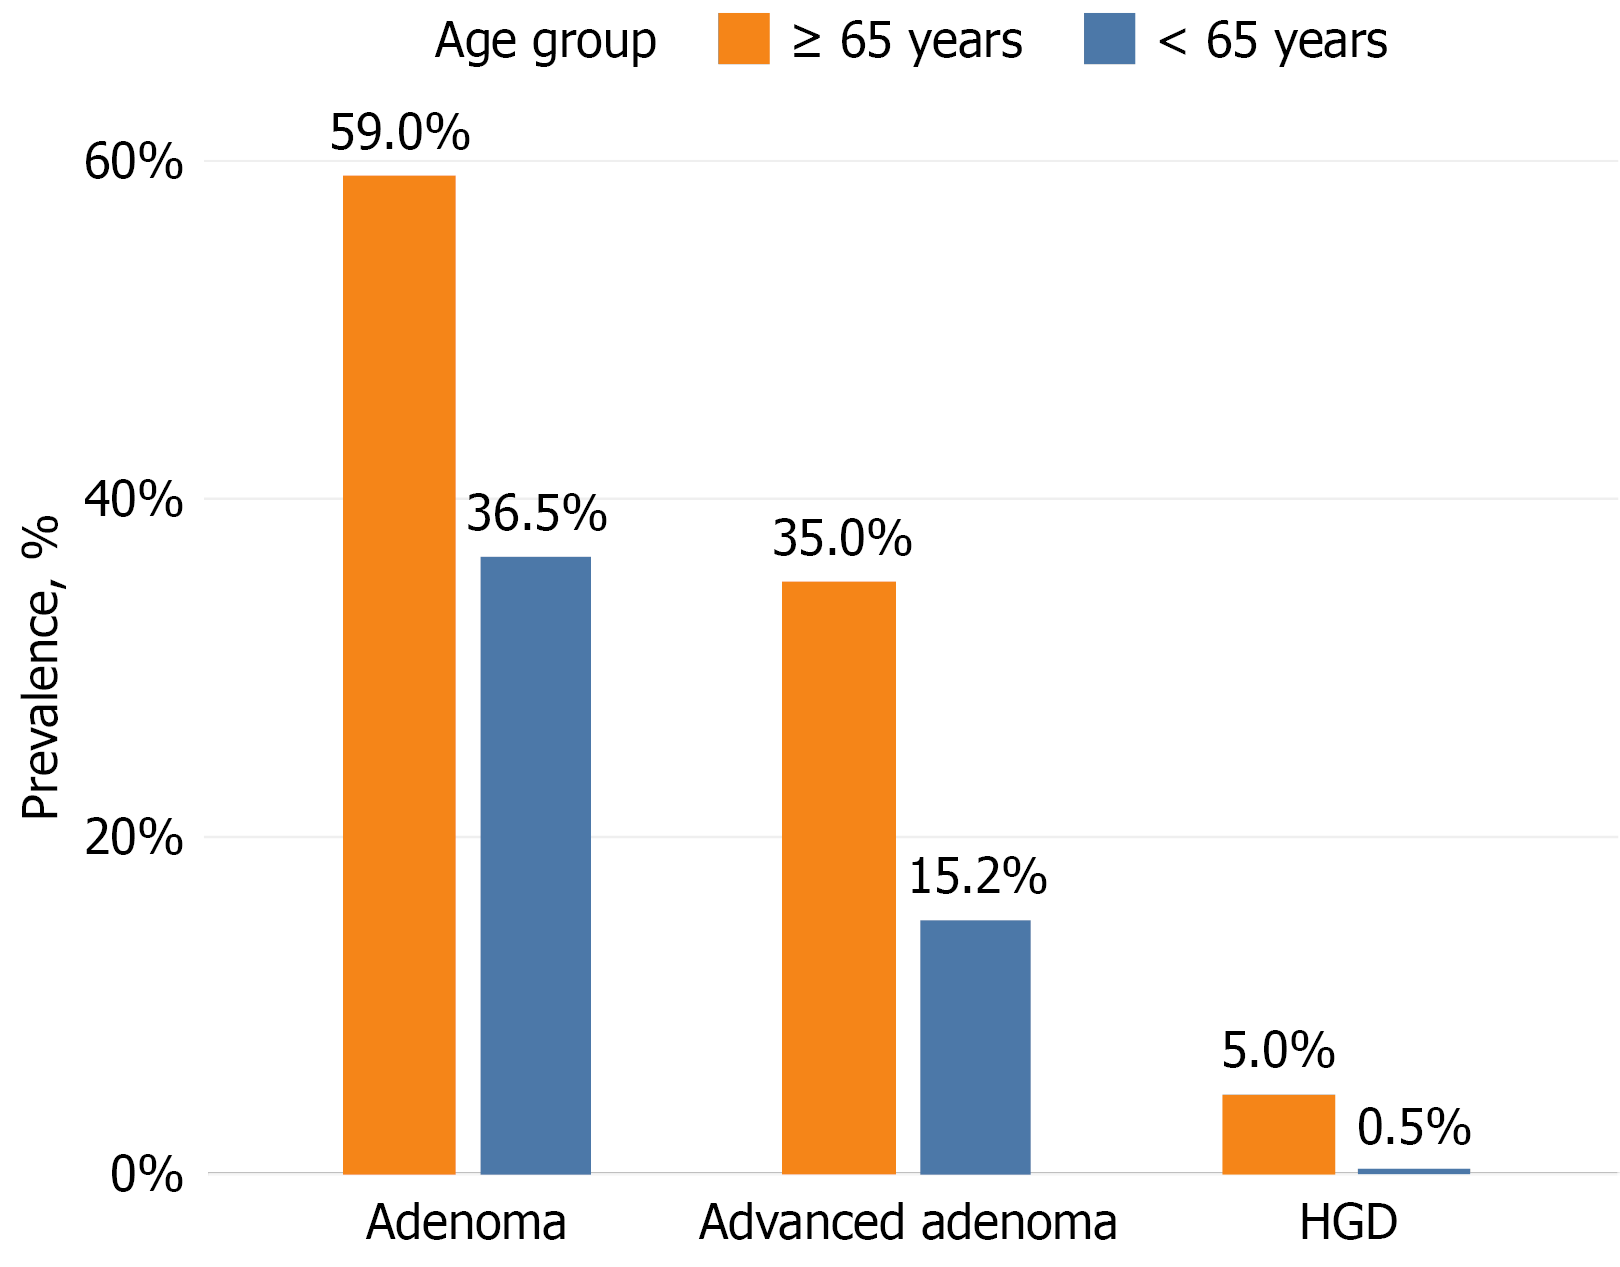
Figure 2 Prevalence of colorectal lesions according to age group.
Prevalence was calculated using all patients within each age group as the denominator. Adenoma, advanced adenoma, and high-grade dysplasia are shown for elderly (≥ 65 years) and non-elderly (< 65 years) patients. HGD: High-grade dysplasia.
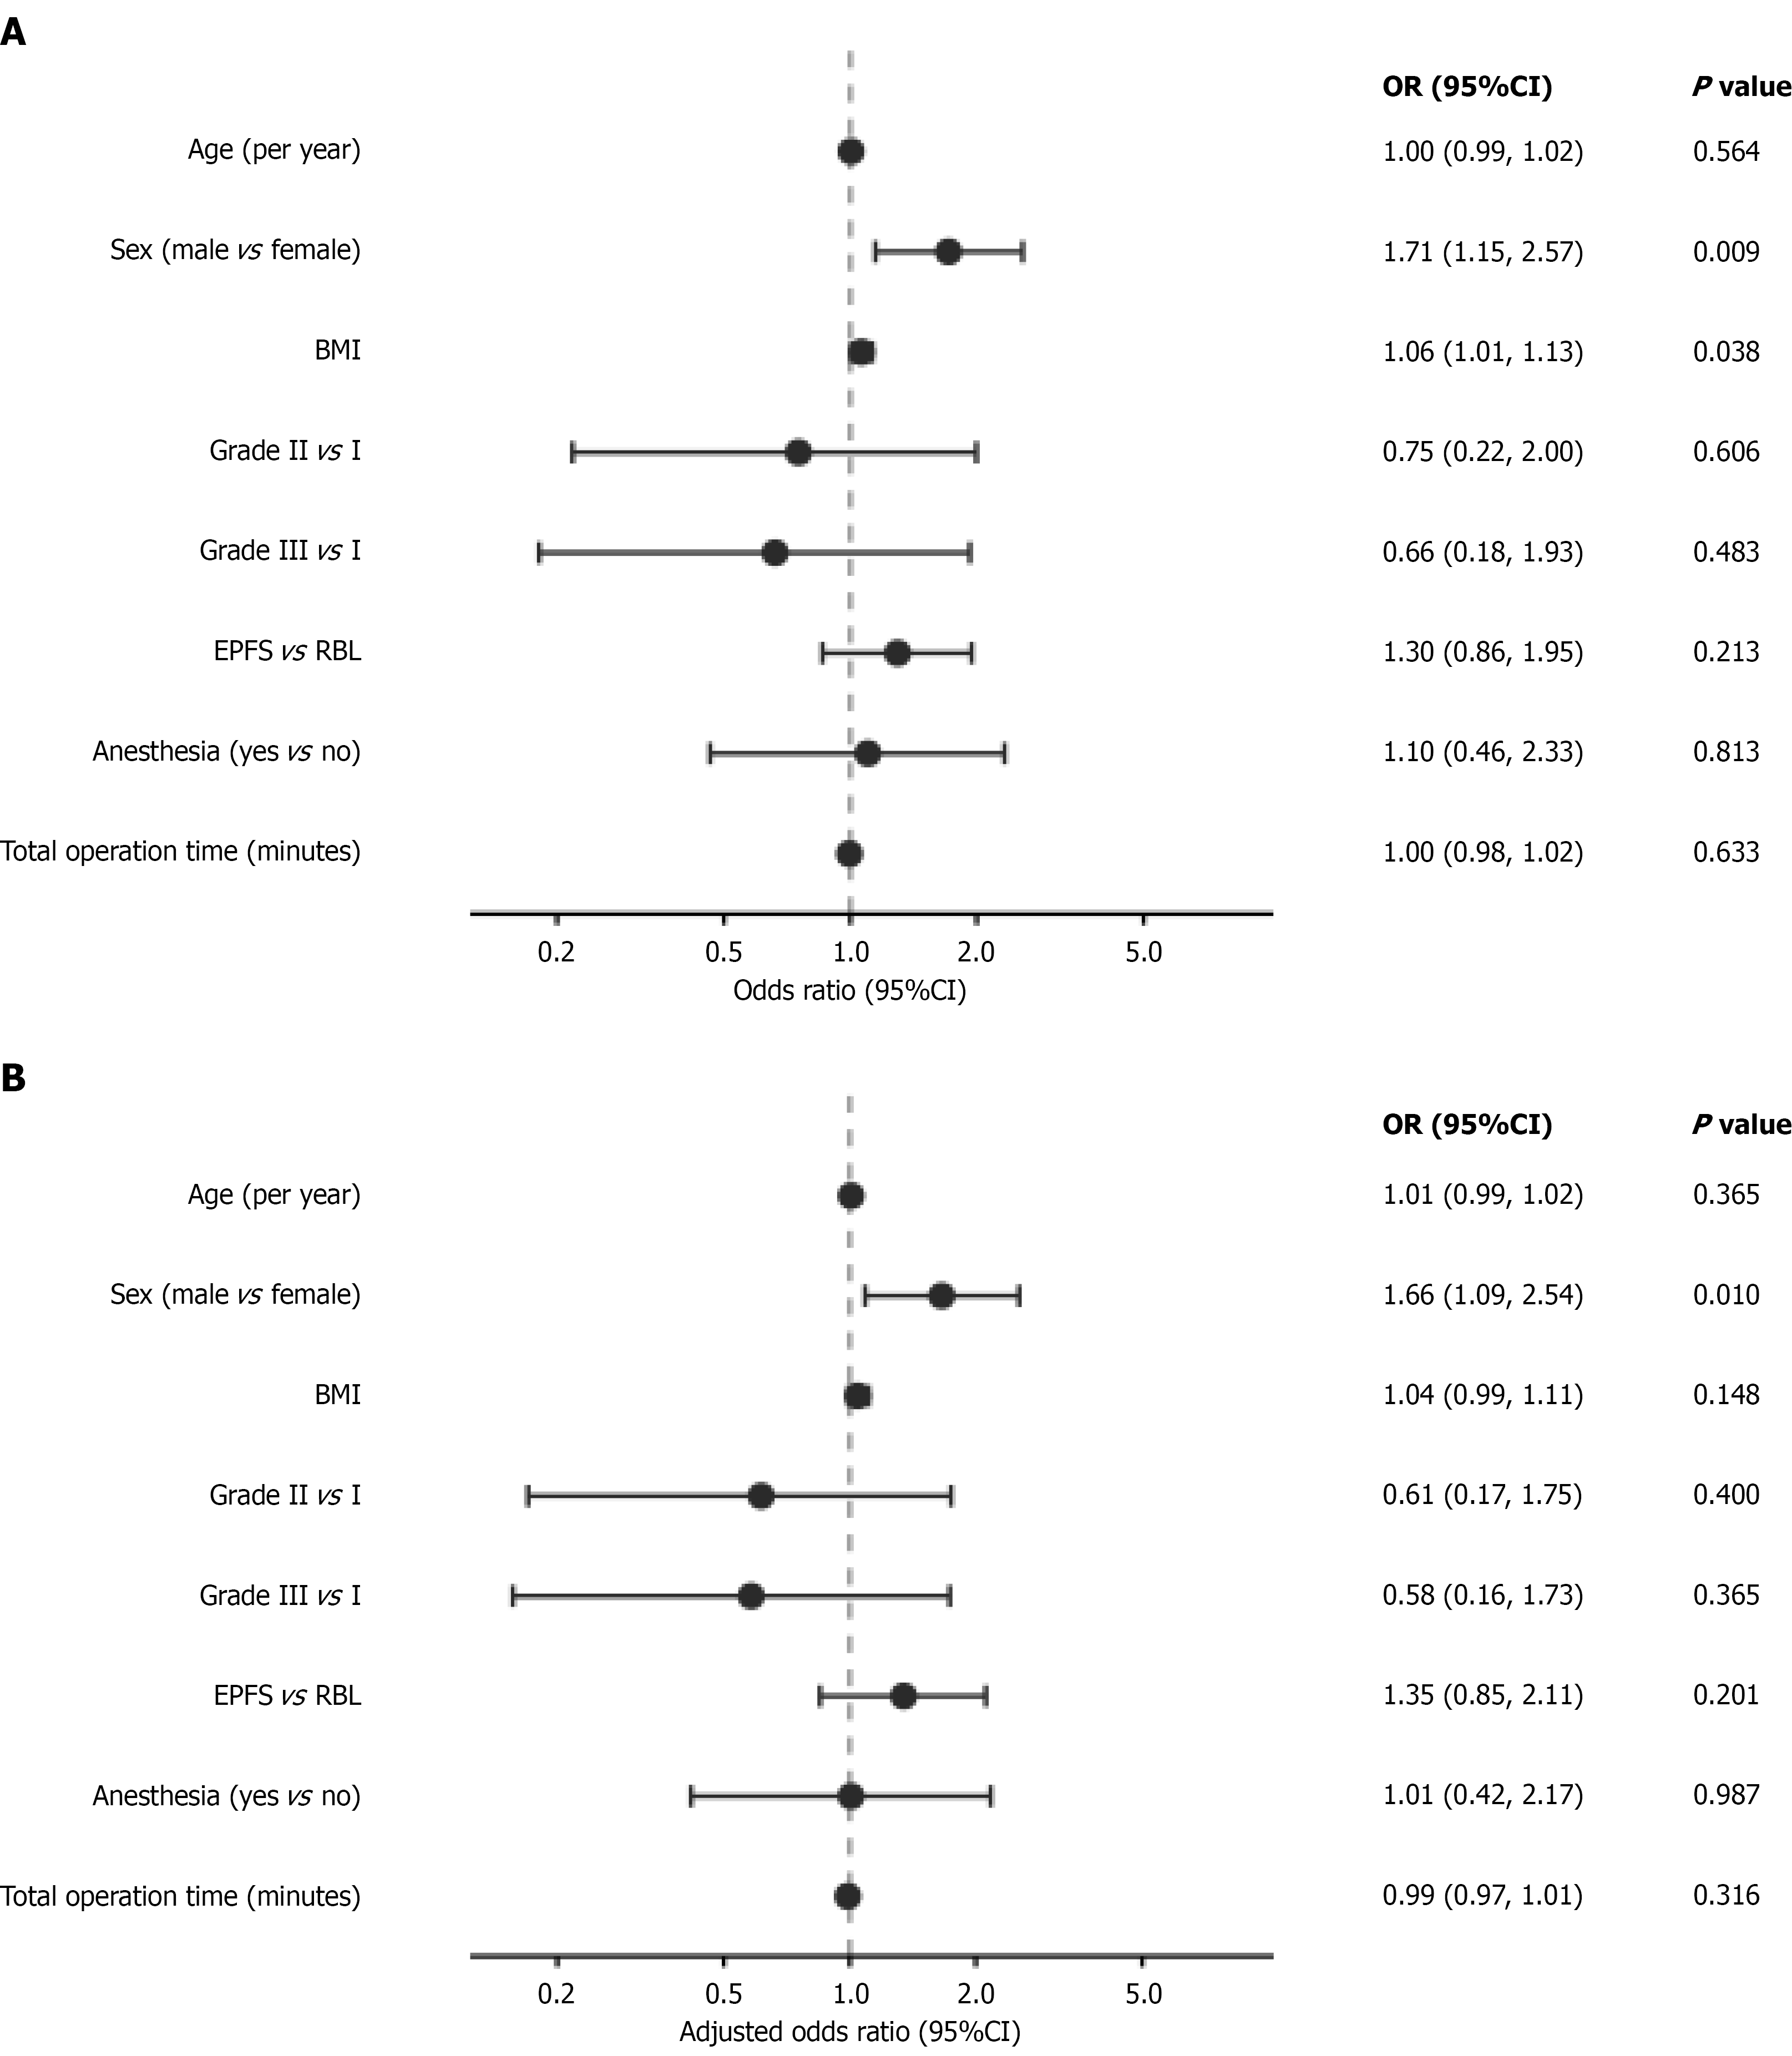
Figure 3 Factors associated with symptom improvement following endoscopic treatment of internal hemorrhoids.
A: Odds ratios and 95% confidence intervals from univariable logistic regression analysis; B: Adjusted odds ratios and 95% confidence intervals derived from multivariable logistic regression analysis. Covariates included age, sex, body mass index, hemorrhoid grade, treatment modality, anesthesia use, and total operation duration. OR: Odds ratio; CI: Confidence interval; BMI: Body mass index; RBL: Rubber band ligation; EPFS: Endoscopic polidocanol foam sclerotherapy.
- Citation: Qiu M, Xiao J, Deng XL, Dai X, Cao T, Zhao GR, Gu ZY, Liang XY. One-stop colonoscopy-based management of colorectal polyps and internal hemorrhoids in older adults: A real-world cohort study. World J Gastrointest Endosc 2026; 18(10): 125082
- URL: https://www.wjgnet.com/1948-5190/full/v18/i10/125082.htm
- DOI: https://dx.doi.org/10.4253/wjge.125082