Copyright
©The Author(s) 2023.
World J Gastrointest Endosc. Aug 16, 2023; 15(8): 528-539
Published online Aug 16, 2023. doi: 10.4253/wjge.v15.i8.528
Published online Aug 16, 2023. doi: 10.4253/wjge.v15.i8.528
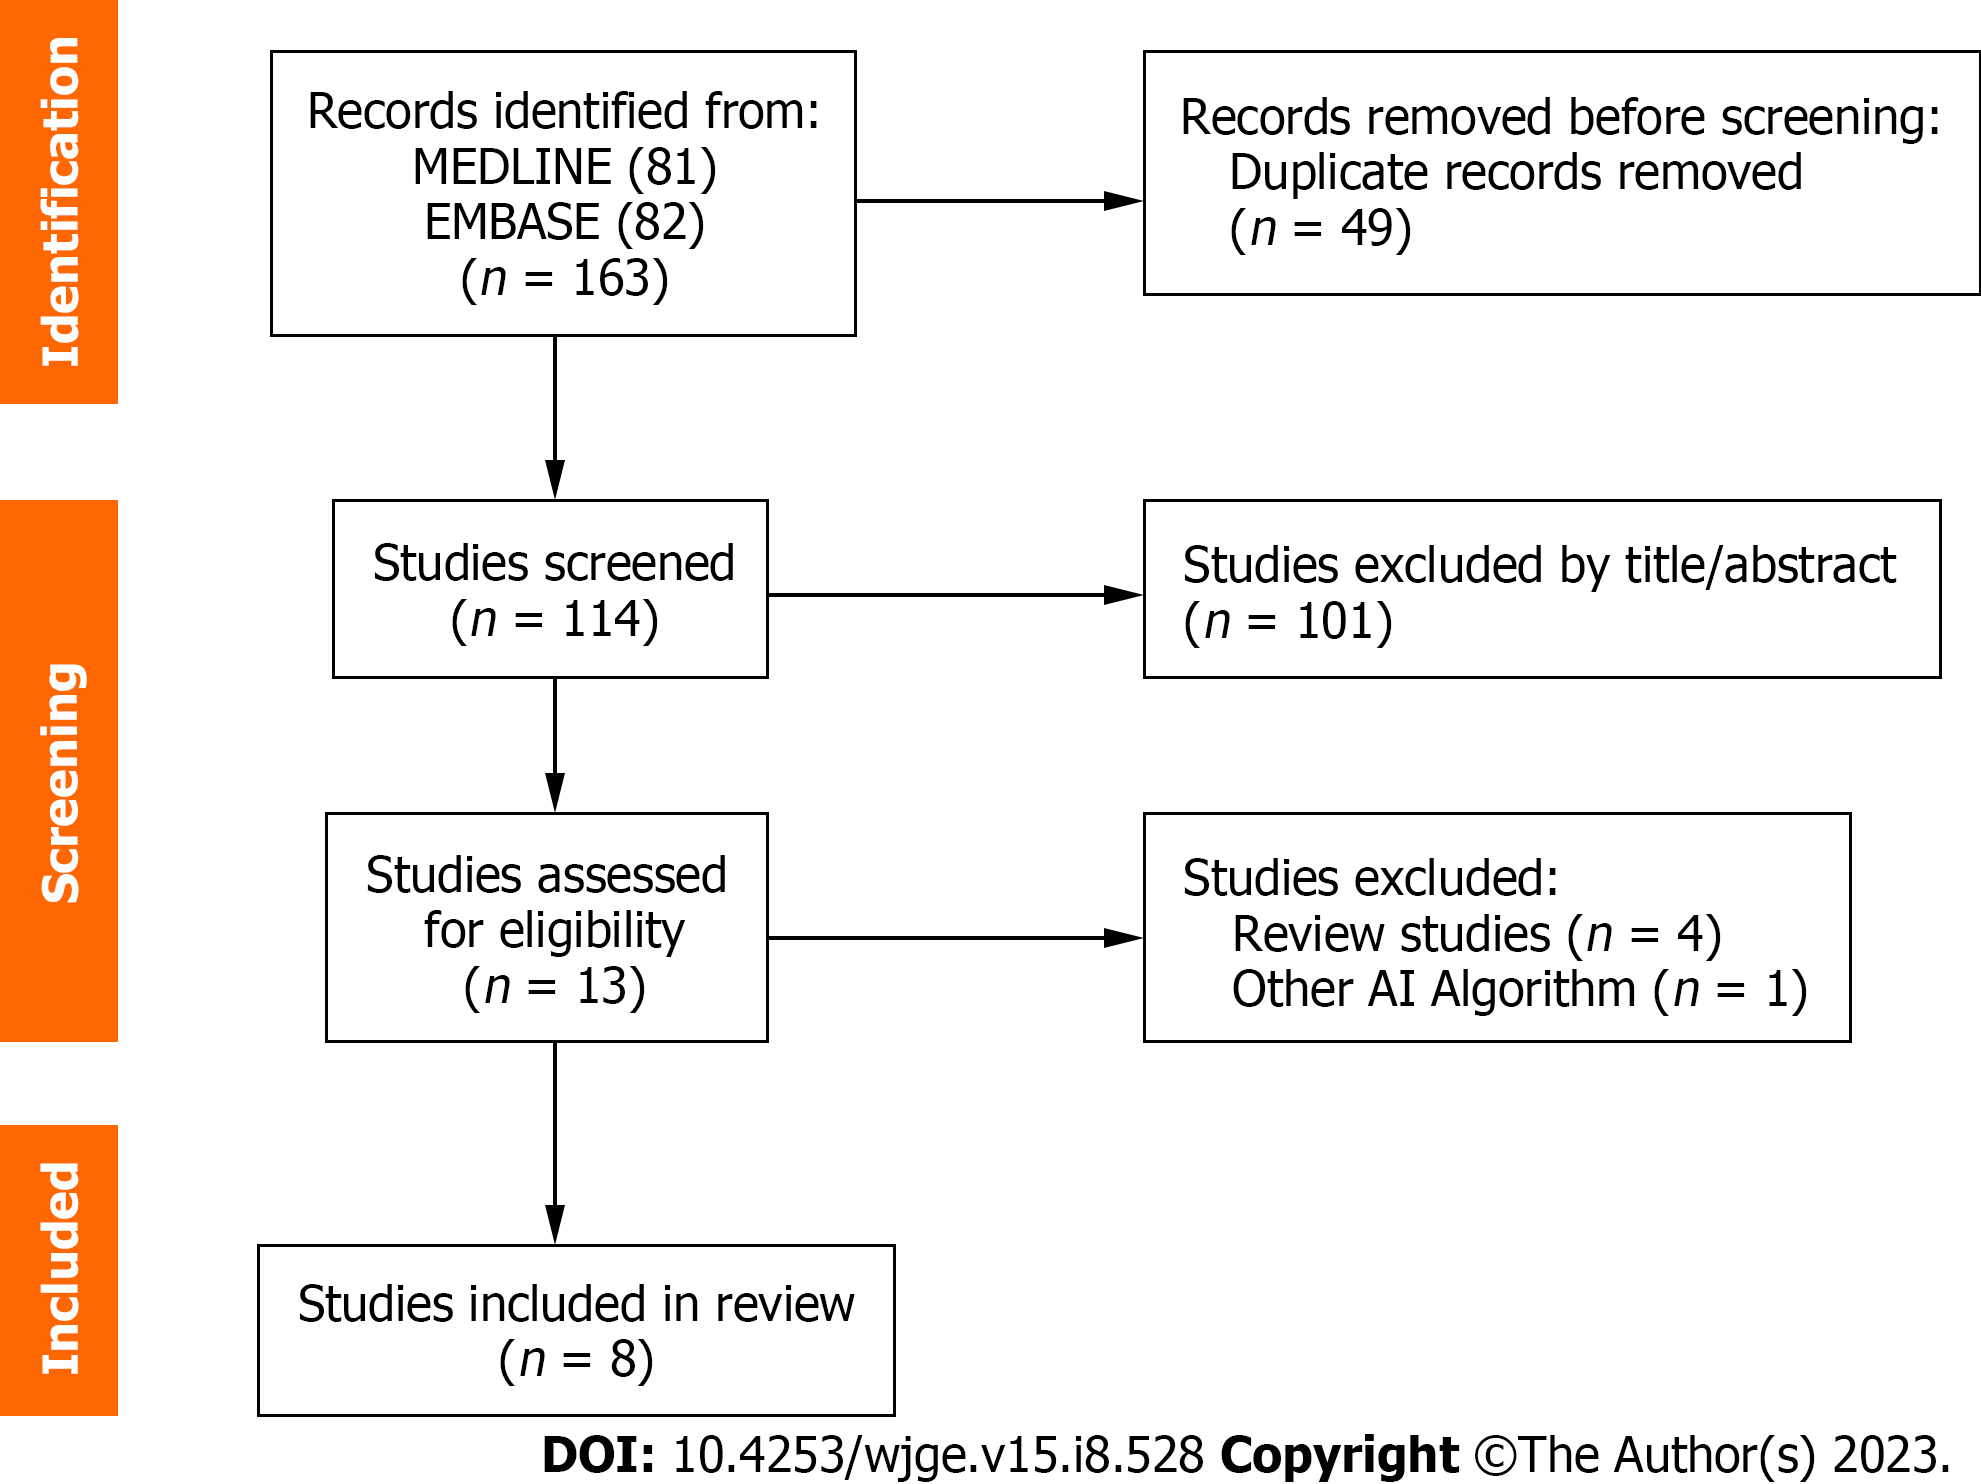
Figure 1 Flow diagram showing the study selection process for meta-analysis.
AI: Artificial intelligence.
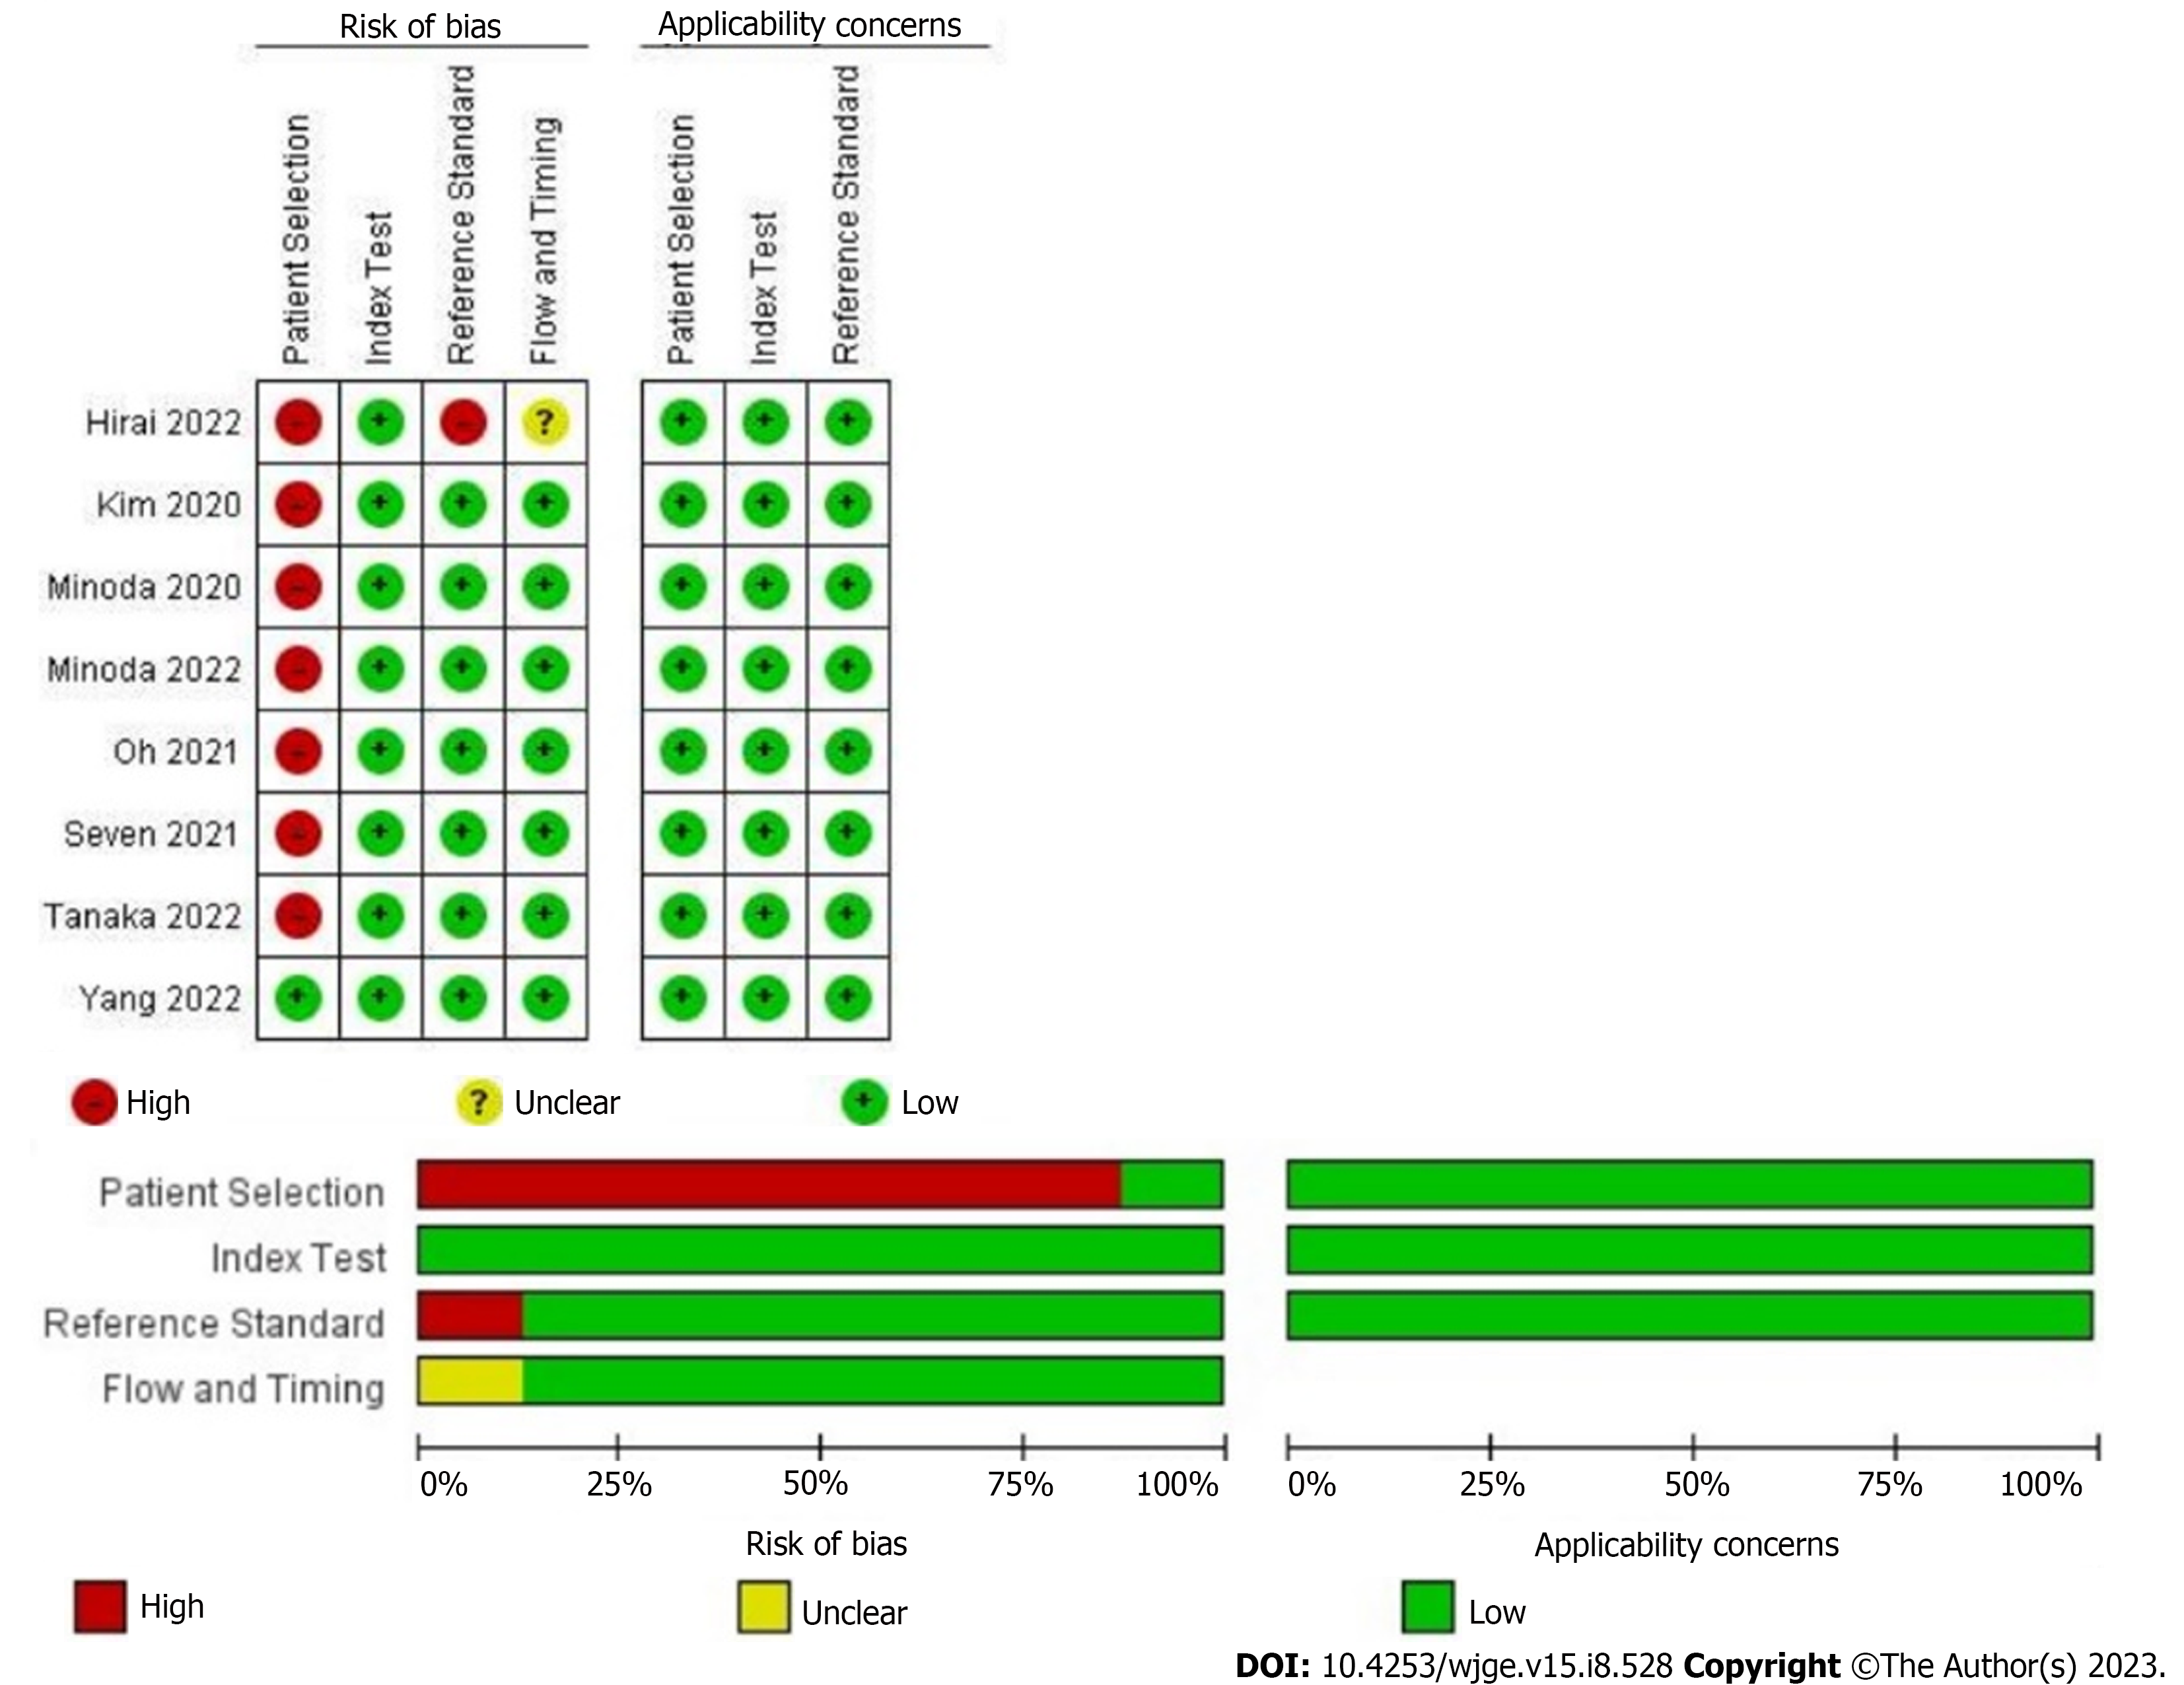
Figure 2
Risk of bias and applicability concerns of 8 included records using the Quality Assessment of Diagnostic Accuracy Studies tool.
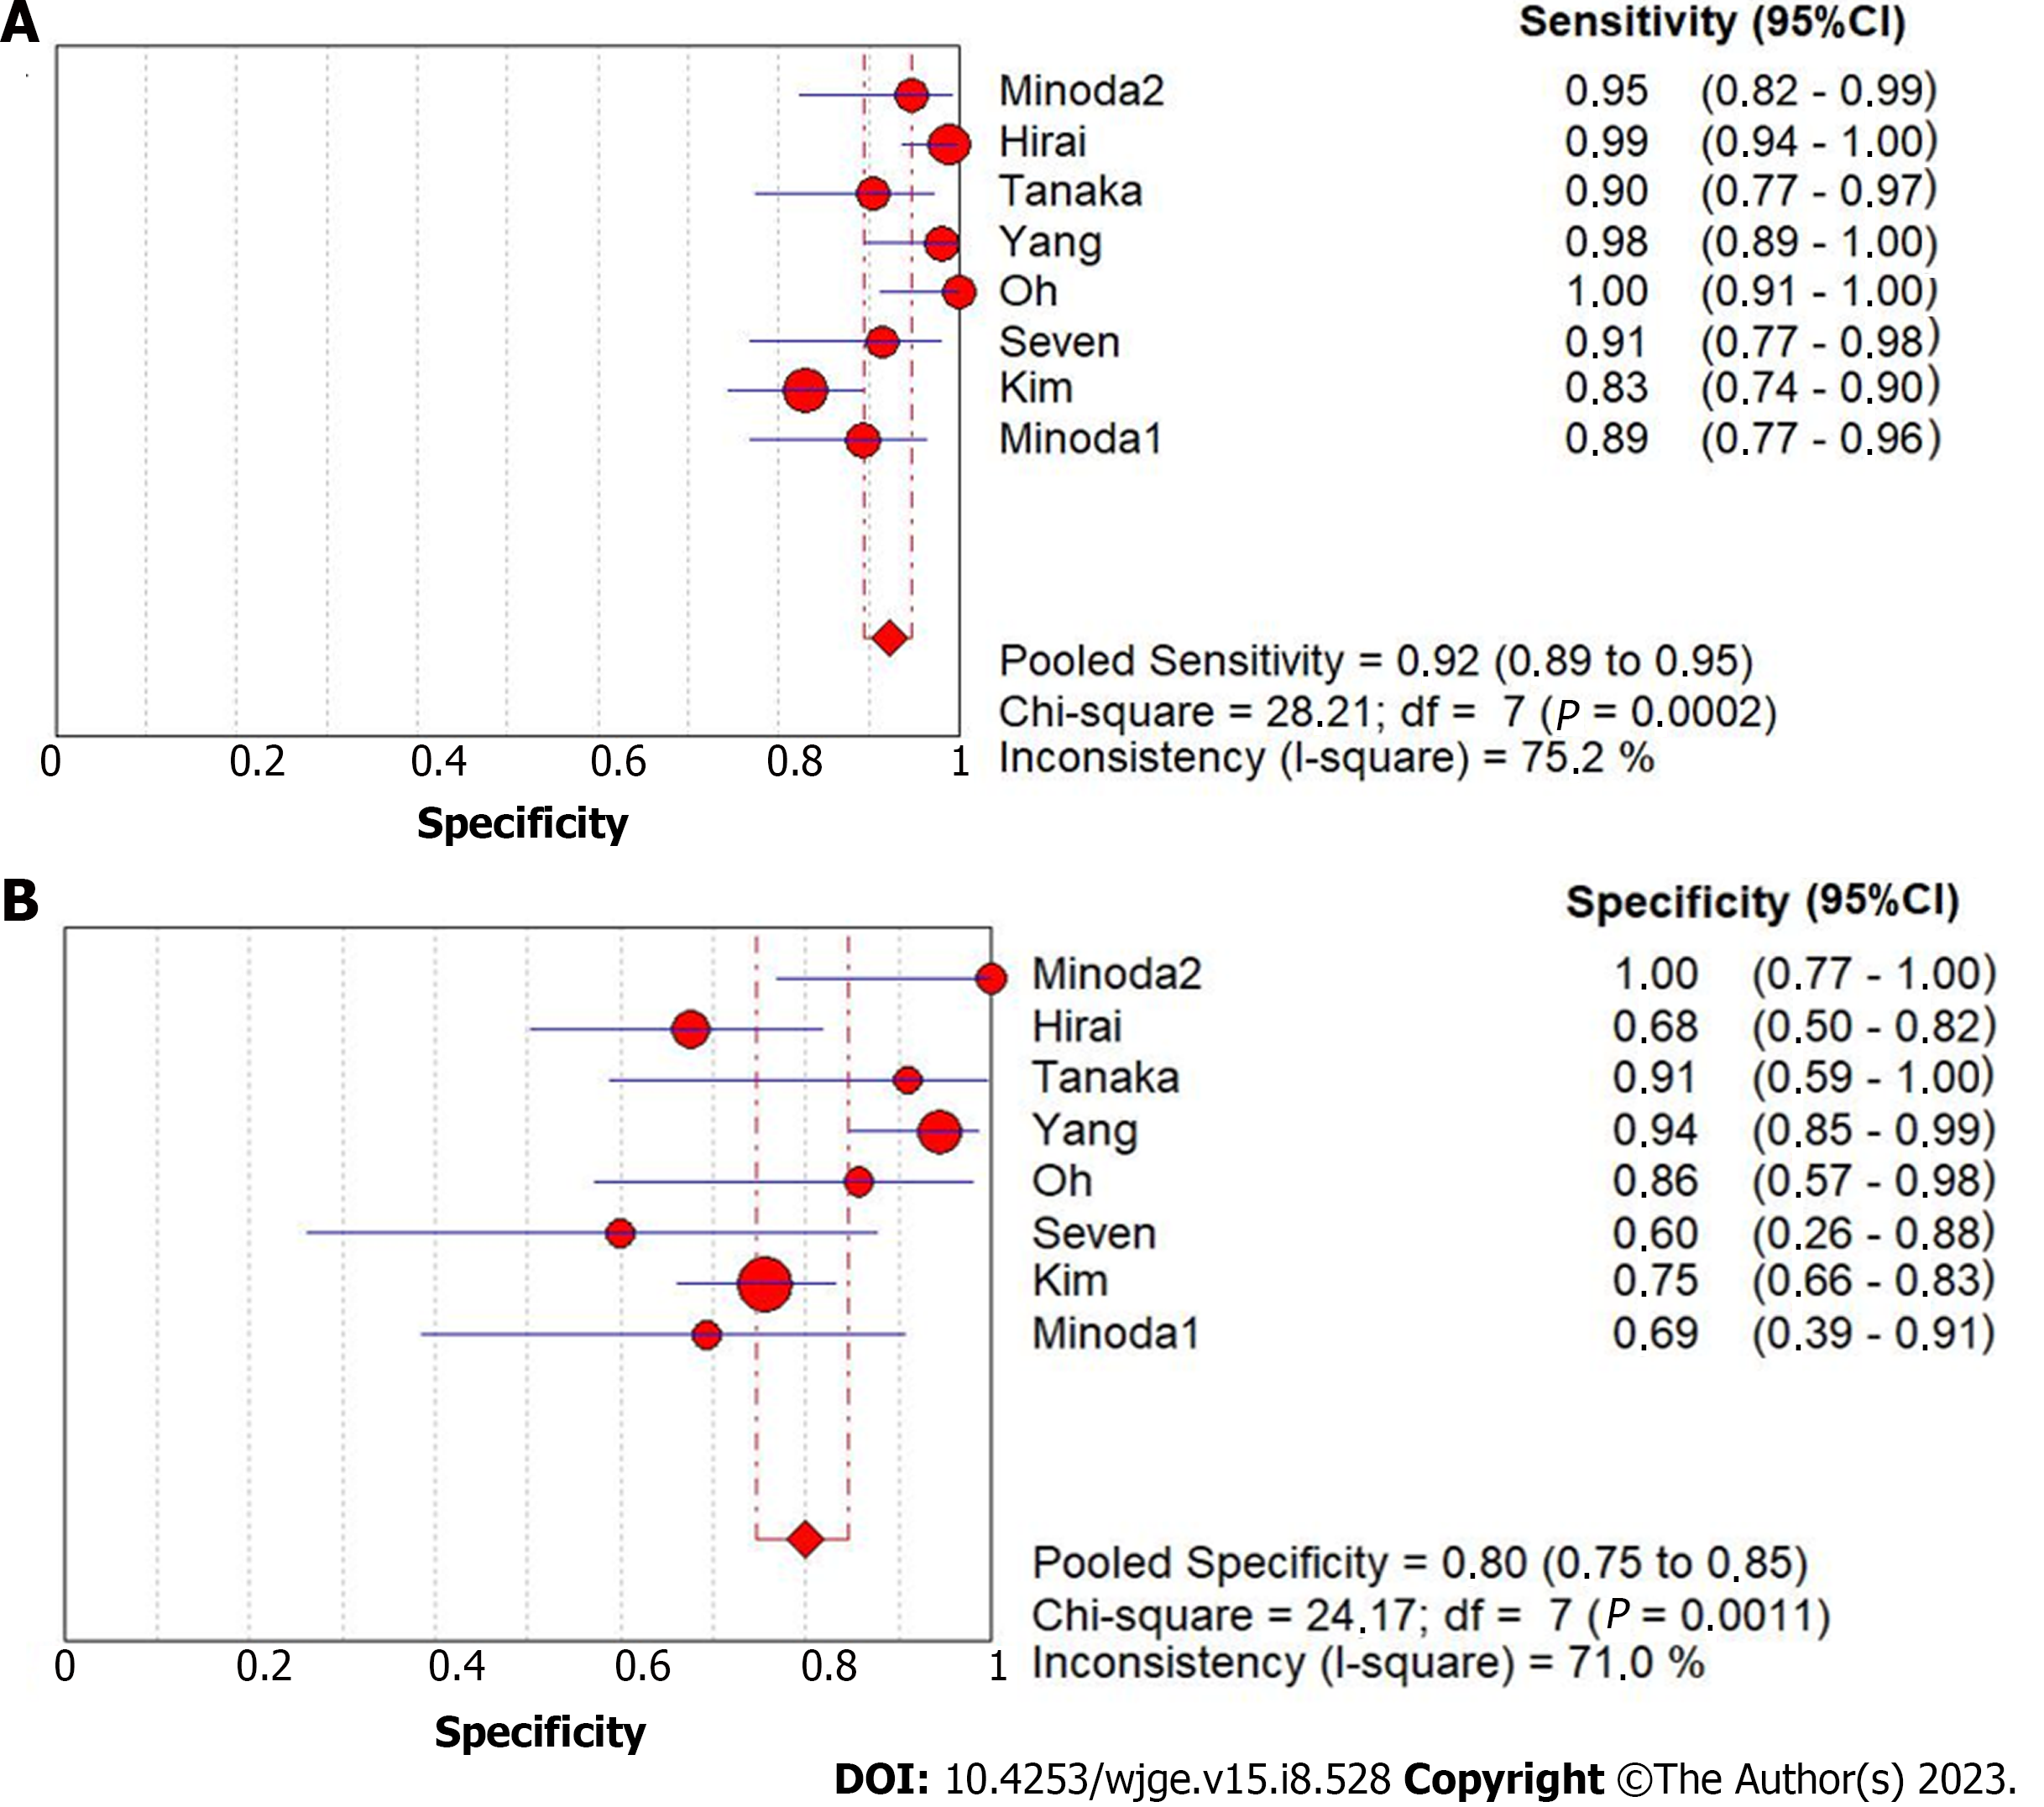
Figure 3 Sensibility and specificity of endoscopic ultrasound with Artificial Intelligence for overall diagnosis of gastrointestinal stromal tumor.
A: Sensibility; B: Specificity. CI: Confidence interval.
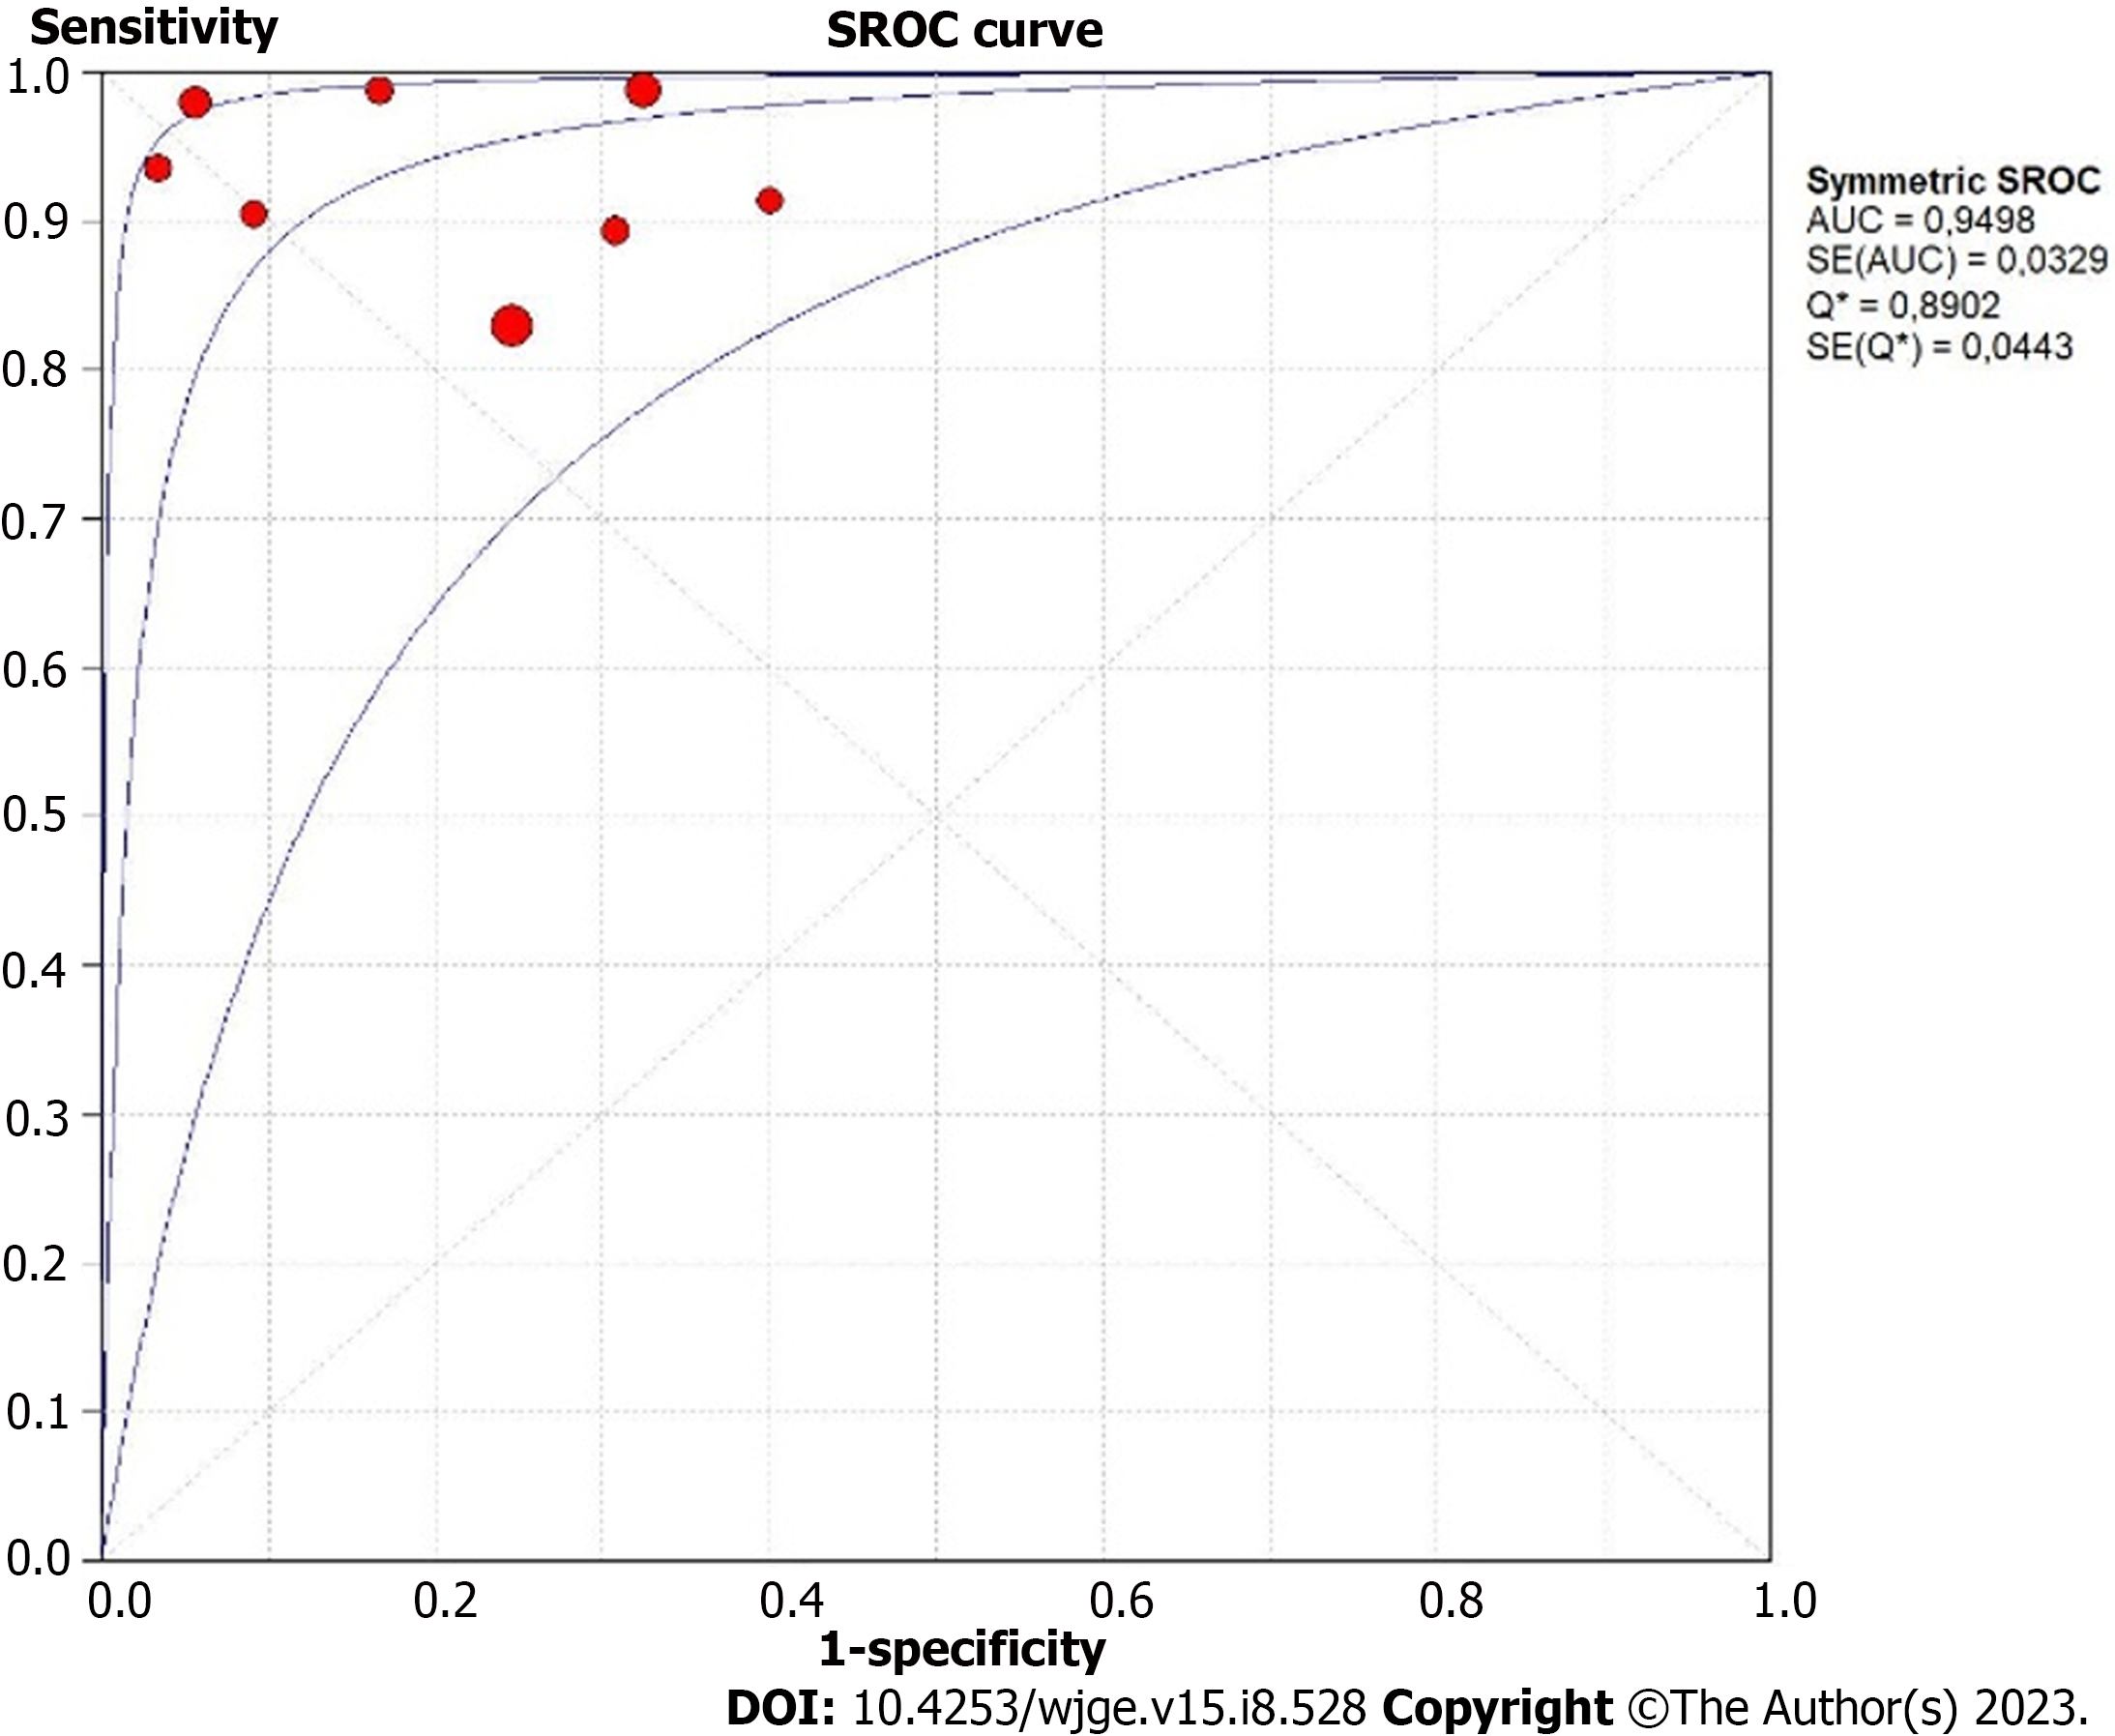
Figure 4 Summary receiver operating characteristic curve of endoscopic ultrasound with artificial intelligence for gastrointestinal stromal tumor diagnostic.
Each circle represent an individual study. SROC: Summary receiver operating characteristic; AUC: Area under curve.
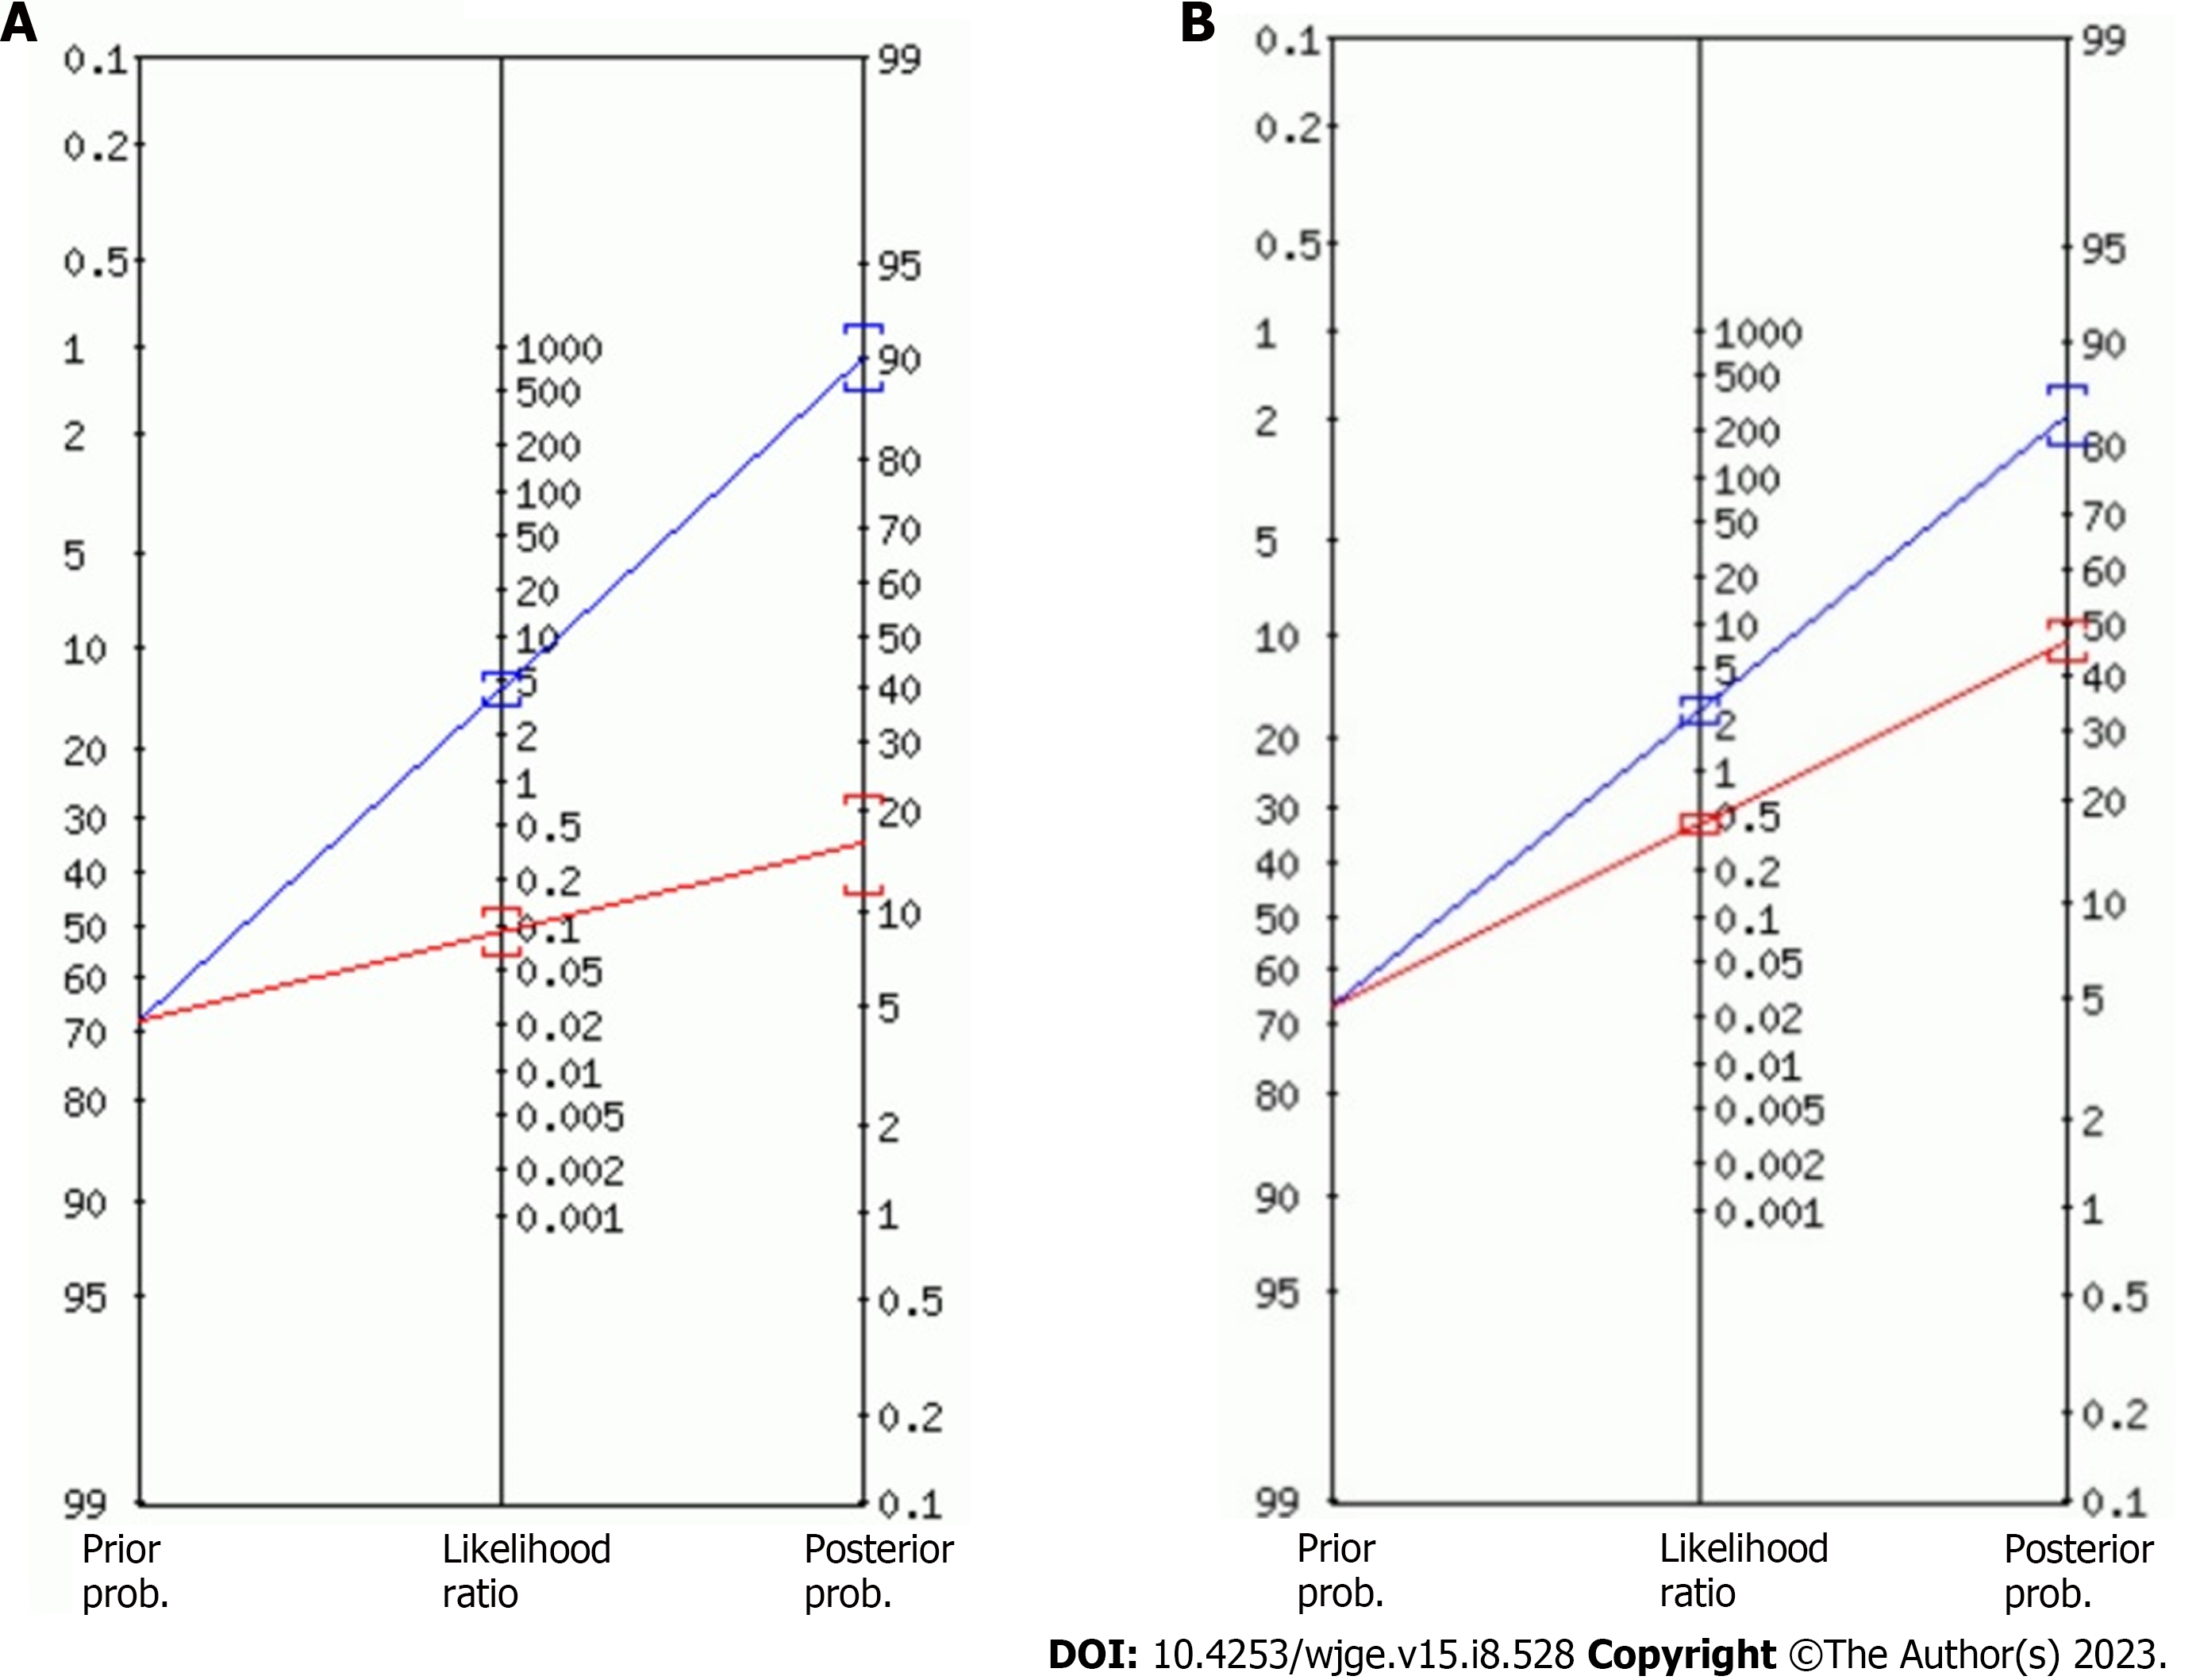
Figure 5 Fagan plot depicting the impact of a positive or negative result on pretest probabilities.
A: Fagan plot depicting the impact of a positive or negative result of artificial intelligence; B: Fagan plot depicting the impact of a positive or negative result of experienced endoscopists’ (i.e., the pooled prevalence of subepithelial lesions).
- Citation: Gomes RSA, de Oliveira GHP, de Moura DTH, Kotinda APST, Matsubayashi CO, Hirsch BS, Veras MO, Ribeiro Jordão Sasso JG, Trasolini RP, Bernardo WM, de Moura EGH. Endoscopic ultrasound artificial intelligence-assisted for prediction of gastrointestinal stromal tumors diagnosis: A systematic review and meta-analysis. World J Gastrointest Endosc 2023; 15(8): 528-539
- URL: https://www.wjgnet.com/1948-5190/full/v15/i8/528.htm
- DOI: https://dx.doi.org/10.4253/wjge.v15.i8.528


