Copyright
©The Author(s) 2022.
World J Gastrointest Endosc. May 16, 2022; 14(5): 320-334
Published online May 16, 2022. doi: 10.4253/wjge.v14.i5.320
Published online May 16, 2022. doi: 10.4253/wjge.v14.i5.320
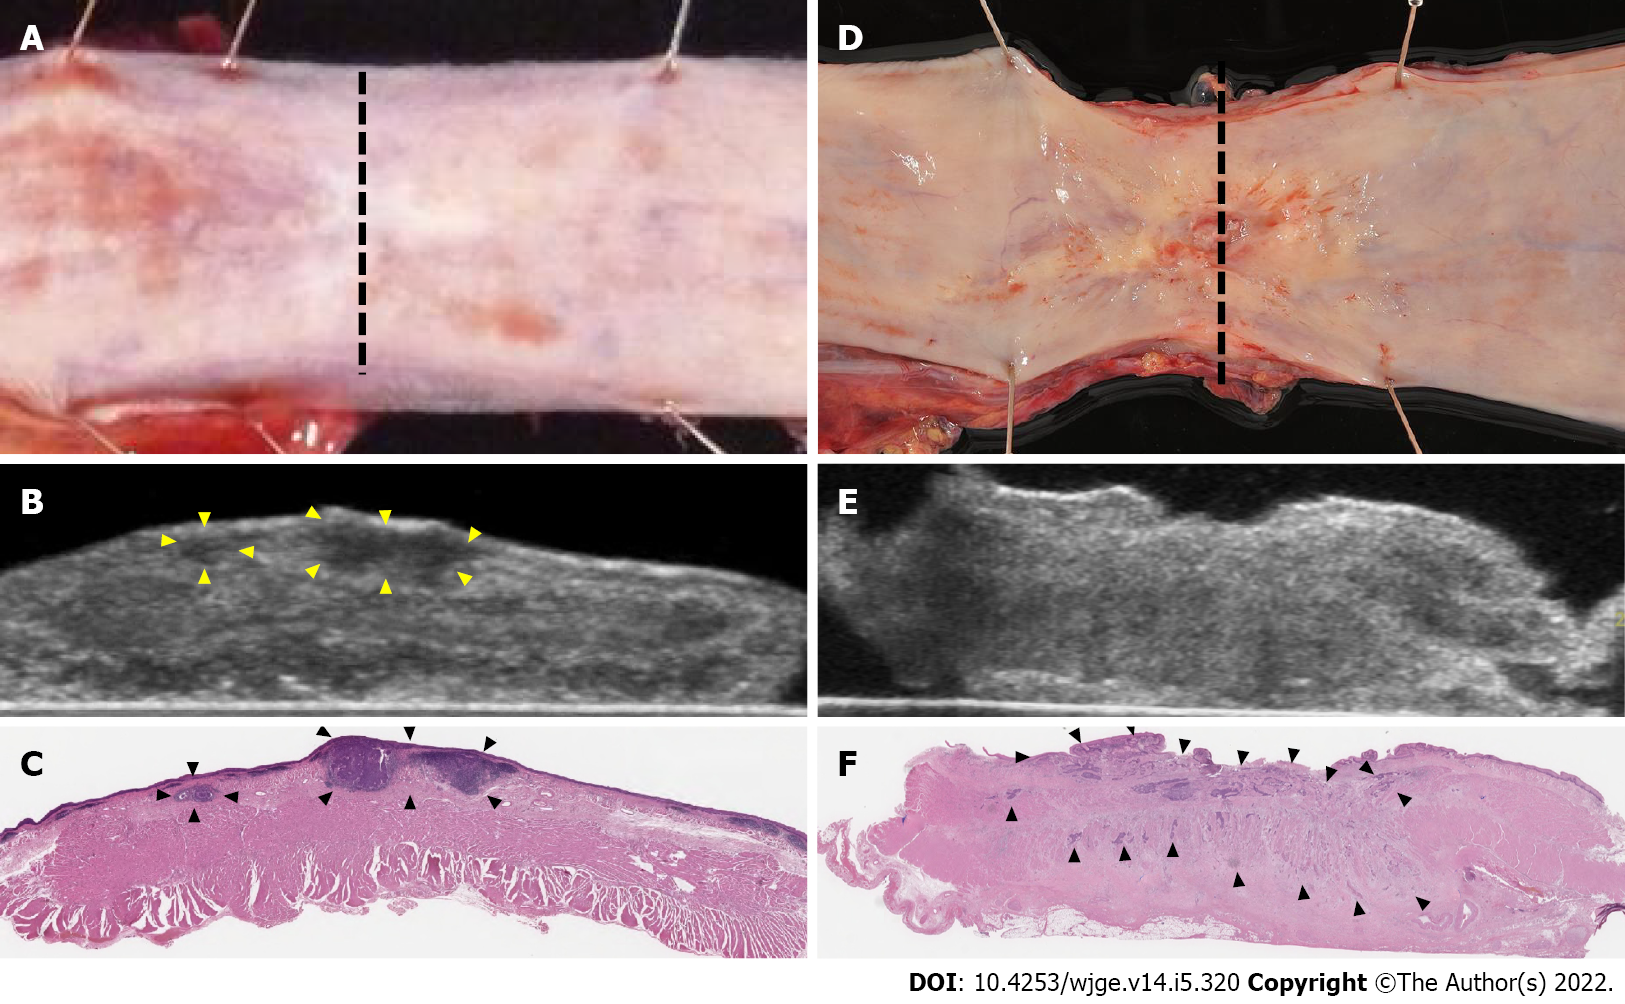
Figure 1 Ultrasound for specimens.
A: In the after neoadjuvant chemotherapy cases, the residual tumor was SMT type with no exposure to the mucosal surface; B: Ultrasound showed the tumor as hypoechoic with regular borders (arrowhead); C: Pathology showed 18 mm × 18 mm, pT1b-SM3 (arrowhead). The pathological response was Grade1; D: After chemoradiotherapy, the residual tumor was ulcerative type; E: Ultrasound showed the tumor as mixed echoic with irregular borders; F: Pathology showed 45 mm × 20 mm, pT3 (arrowhead). The pathological response was Grade1.
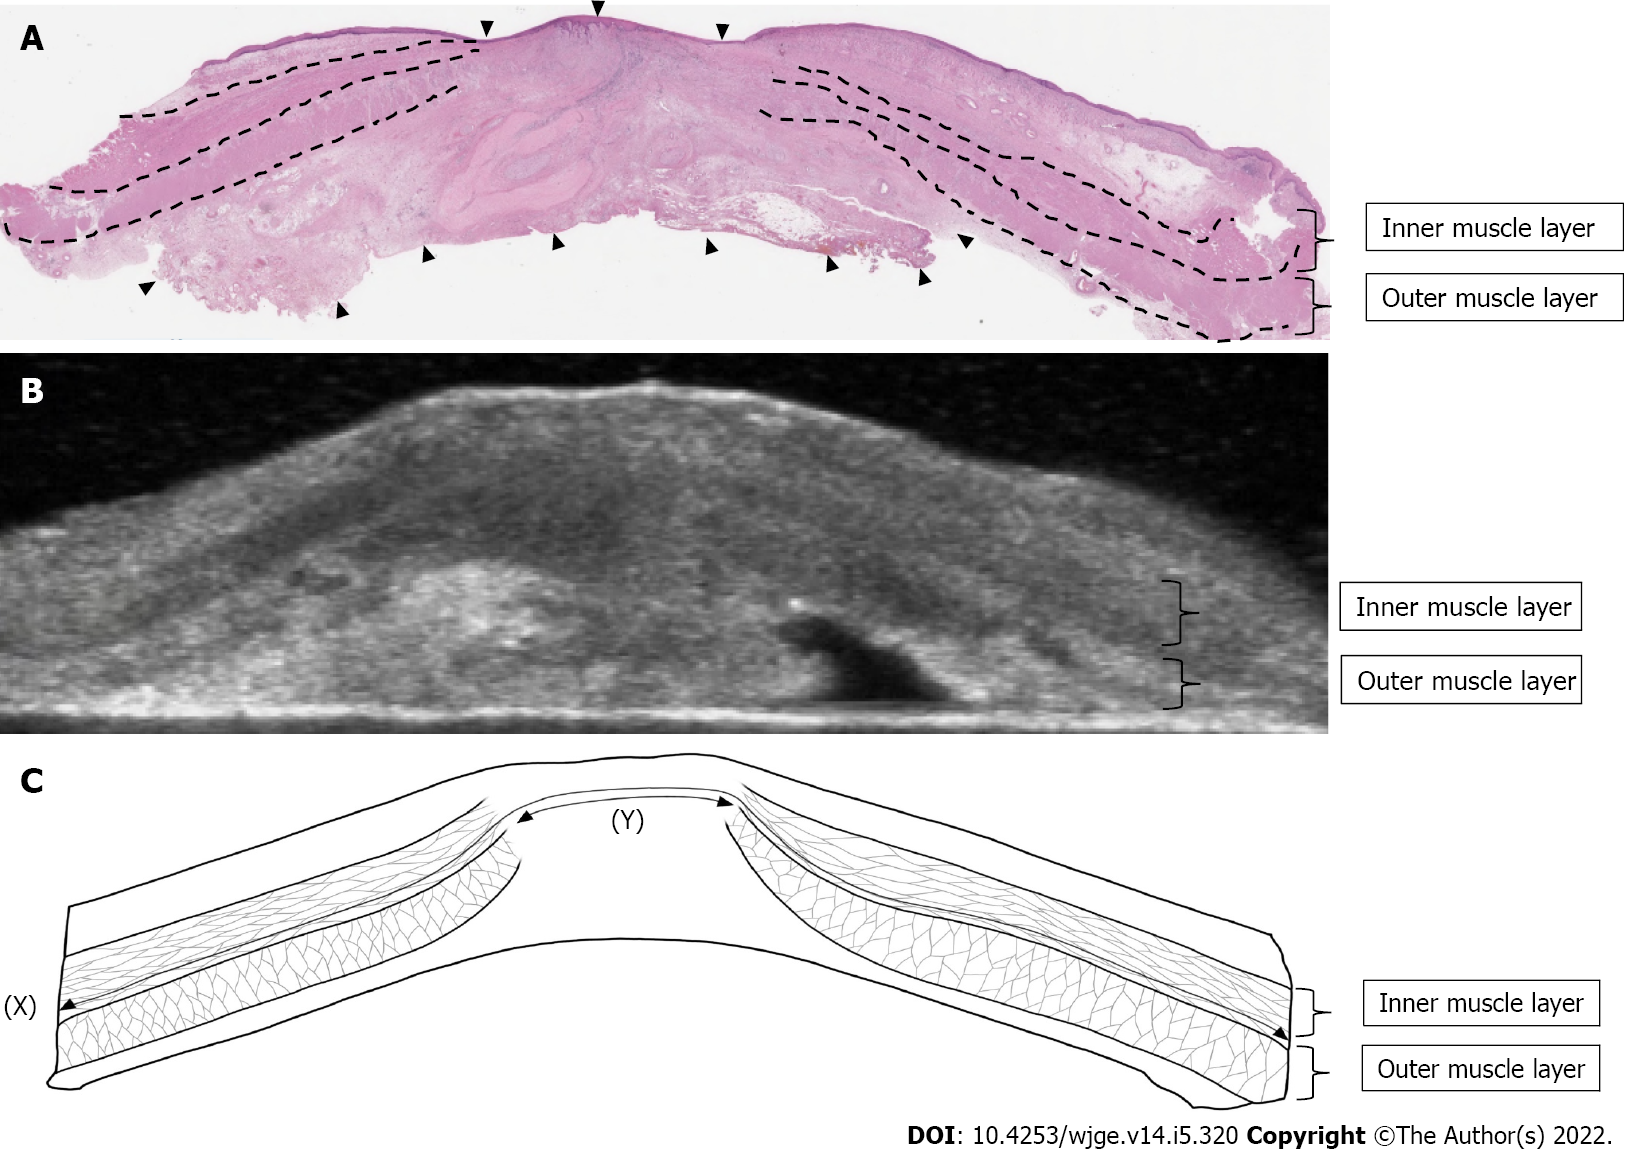
Figure 2 Measurements of muscle layer defect.
A: In this case of cT4b to pT1a after chemoradiotherapy, most of the primary tumors were replaced by degenerative tissue (arrowhead), and the muscle layer was taking over; B: Ultrasound for specimens showed a clearly defined disruption of the muscle layer; C: Length of muscle layer circumference (X) was 45 mm. The length of the muscle layer defect (Y) was 12 mm. In this case, the ratio of muscle layer defect was 27%.
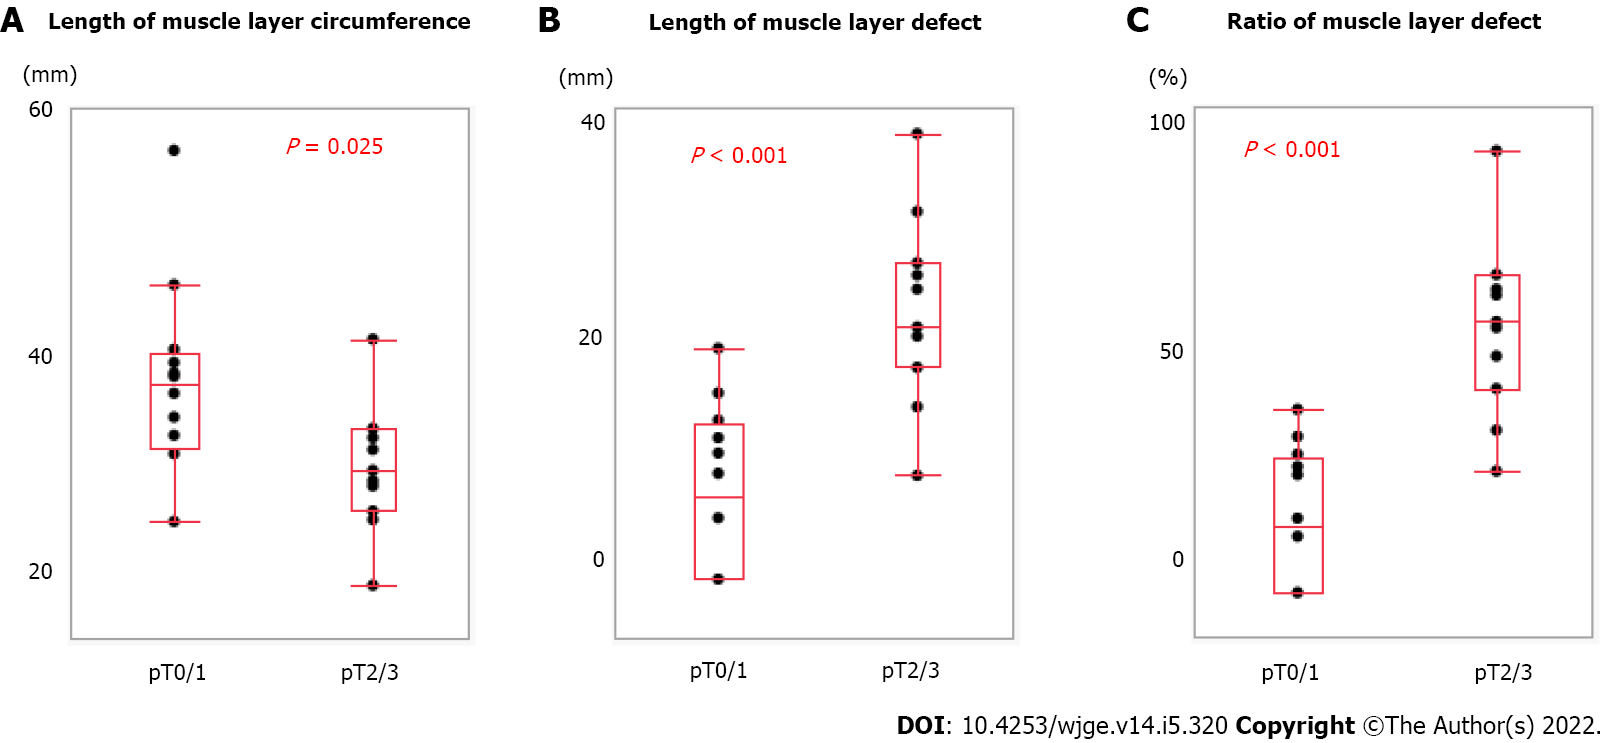
Figure 3 Relationship between muscle layer measurements and pathological characteristics.
A: Length of muscle layer circumference correlated with pT (pT0/1 vs pT2/3); B: Length of muscle layer defect correlated with pT; C: Ratio of muscle layer defect correlated with pT.
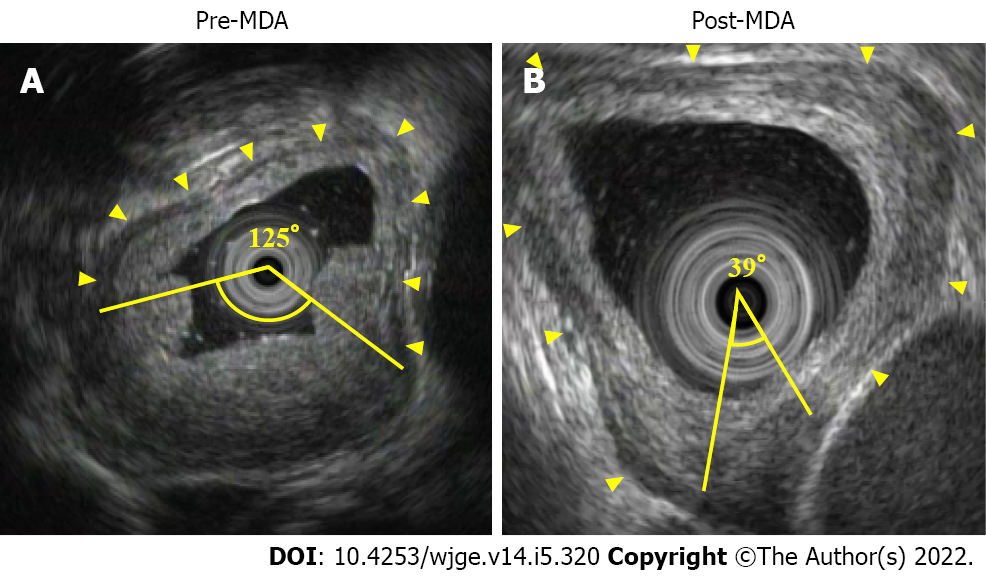
Figure 4 Measurements of muscle layer defect angle.
A: Endoscopic ultrasound showed the normal muscle layer as hypoechoic inner muscle layer, hyperechoic intermuscular connective tissue layer, and hypoechoic outer muscle layer (arrowhead). In this case of cT3 before neoadjuvant chemotherapy (NAC), pre-muscle layer defect angle (MDA) was 125°; B: After NAC, post-MDA was 39°, and thus MDA reduction rate was 34.8%. This case achieved pCR.
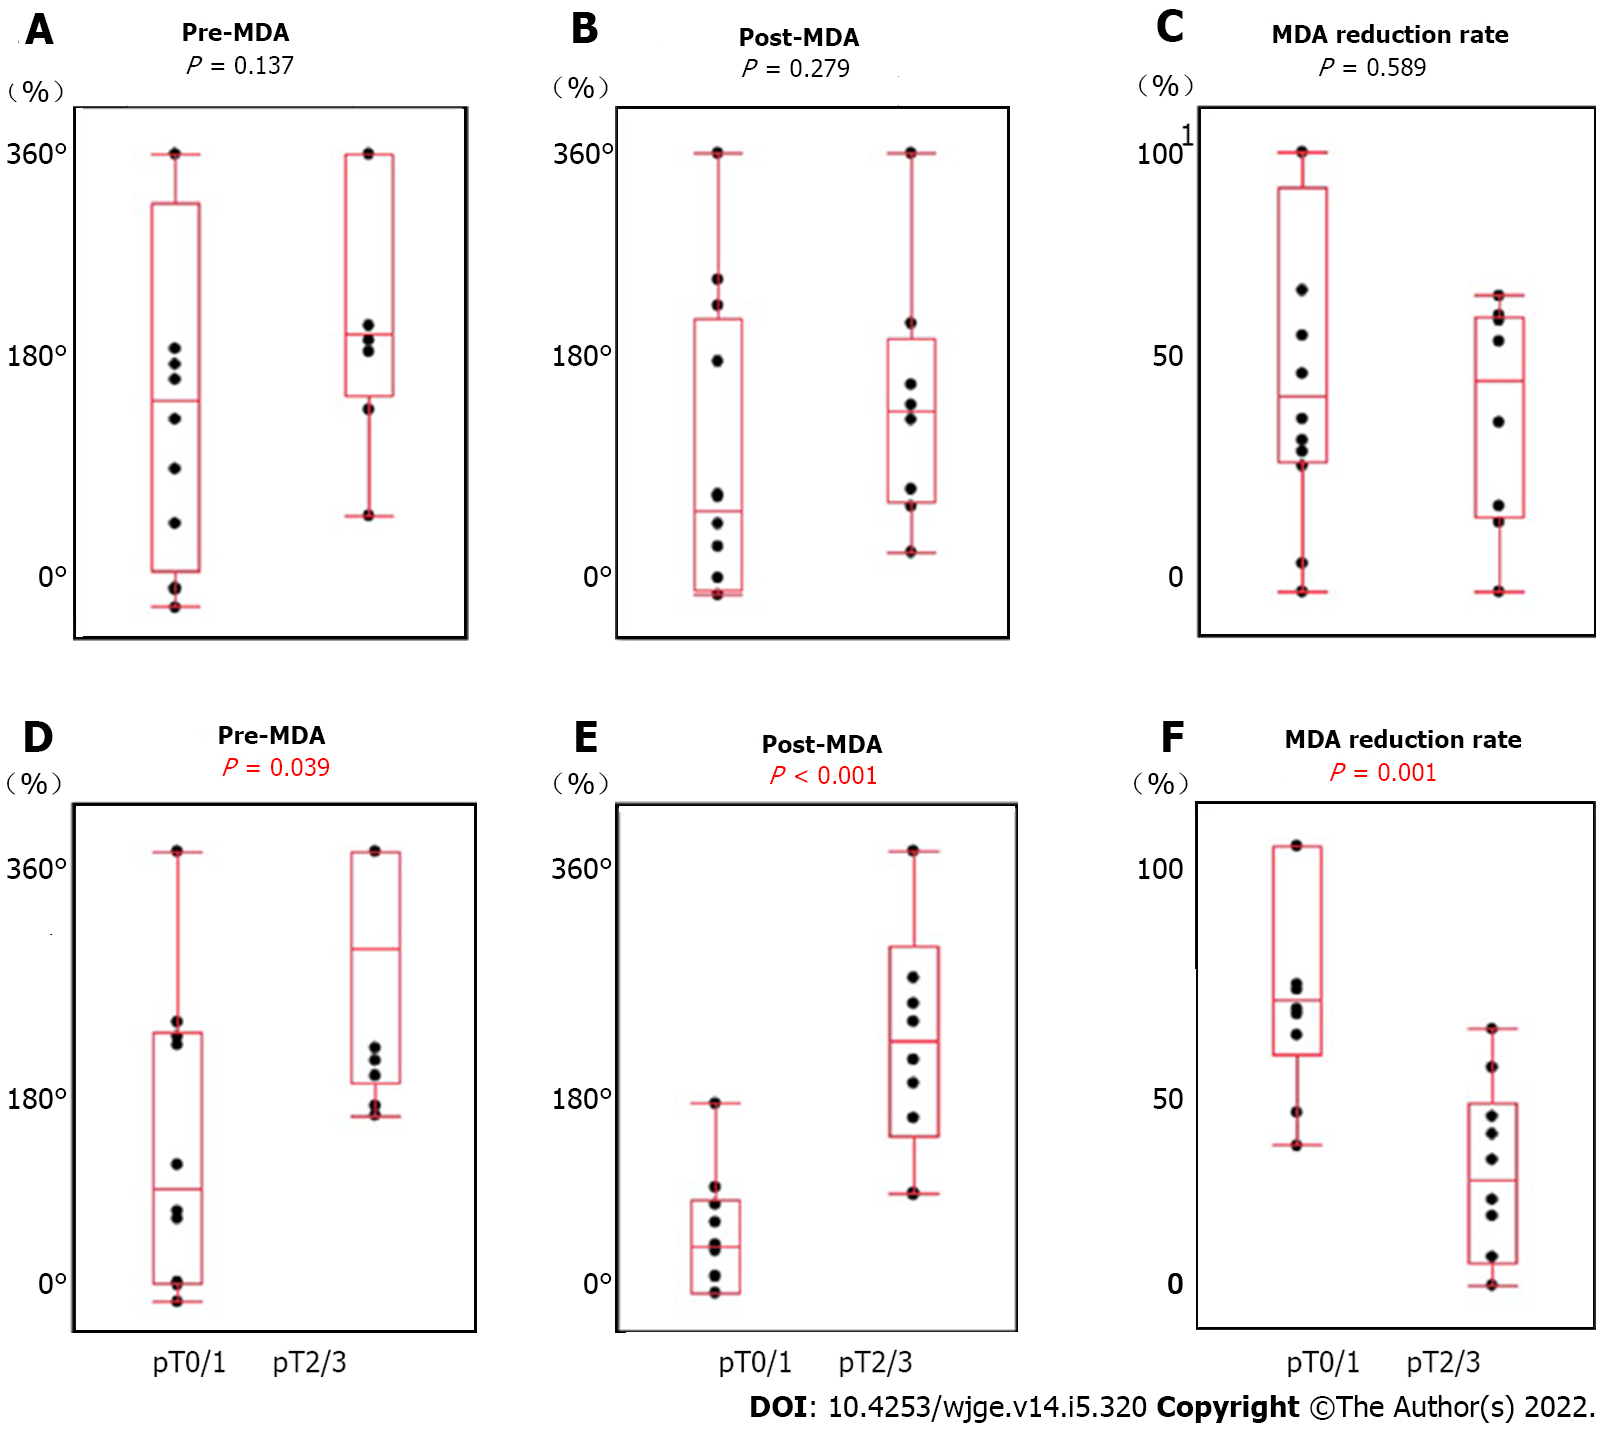
Figure 5 Relationship between muscle layer defect angle measurements and clinicopathological factors.
A: Pre-muscle layer defect angle (MDA) not correlated with preoperative treatment [neoadjuvant chemotherapy (NAC) vs chemoradiotherapy (CRT)]; B: Post-MDA not correlated with preoperative treatment (NAC vs CRT); C: MDA reduction rate not correlated with preoperative treatment (NAC vs CRT); D: Pre-MDA correlated with pT (pT0/1 vs pT2/3); E: Post-MDA correlated with pT (pT0/1 vs pT2/3); F: MDA reduction rate correlated with pT (pT0/1 vs pT2/3).
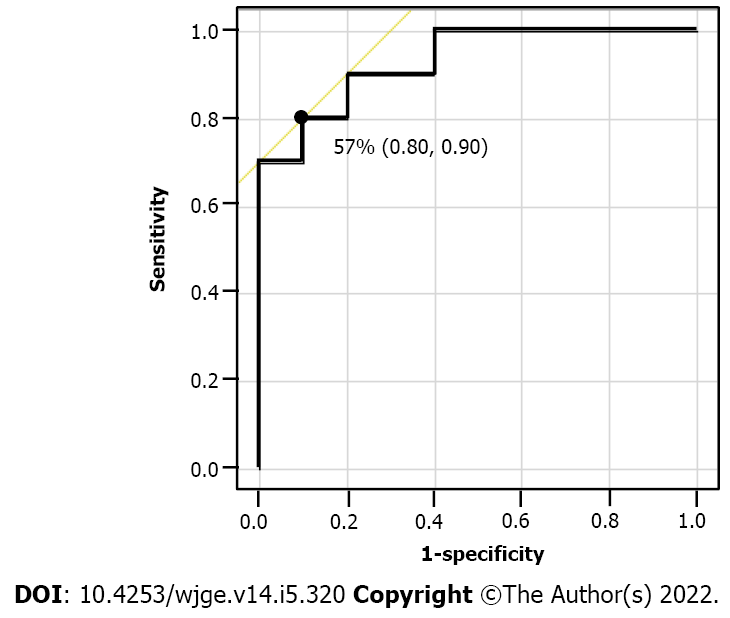
Figure 6 Receiver operating characteristics curve of the muscle layer defect angle reduction rate.
The AUS was 0.93, and 57% was the optimal cut-off value to detect the patients in the pT0/1 group with the highest accuracy.
- Citation: Yonemoto S, Uesato M, Nakano A, Murakami K, Toyozumi T, Maruyama T, Suito H, Tamachi T, Kato M, Kainuma S, Matsusaka K, Matsubara H. Why is endosonography insufficient for residual diagnosis after neoadjuvant therapy for esophageal cancer? Solutions using muscle layer evaluation. World J Gastrointest Endosc 2022; 14(5): 320-334
- URL: https://www.wjgnet.com/1948-5190/full/v14/i5/320.htm
- DOI: https://dx.doi.org/10.4253/wjge.v14.i5.320


