Copyright
©The Author(s) 2022.
World J Gastrointest Endosc. May 16, 2022; 14(5): 267-290
Published online May 16, 2022. doi: 10.4253/wjge.v14.i5.267
Published online May 16, 2022. doi: 10.4253/wjge.v14.i5.267
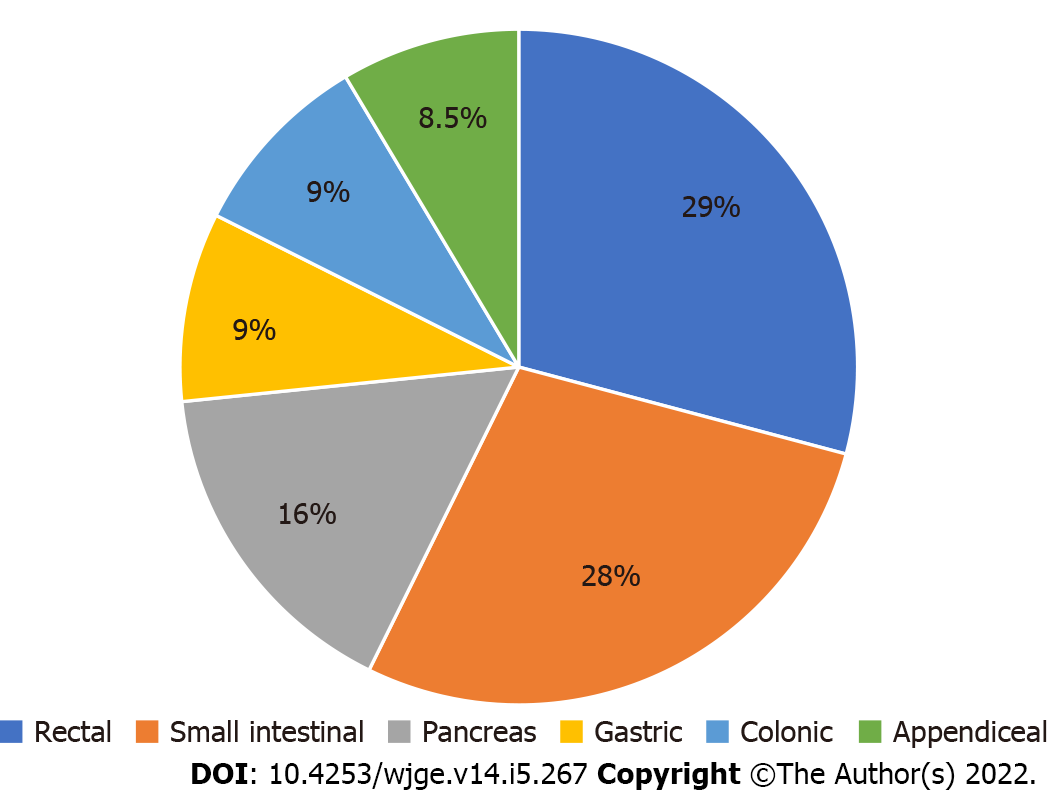
Figure 1 Epidemiology of gastroenteropancreatic neuroendocrine neoplasms.
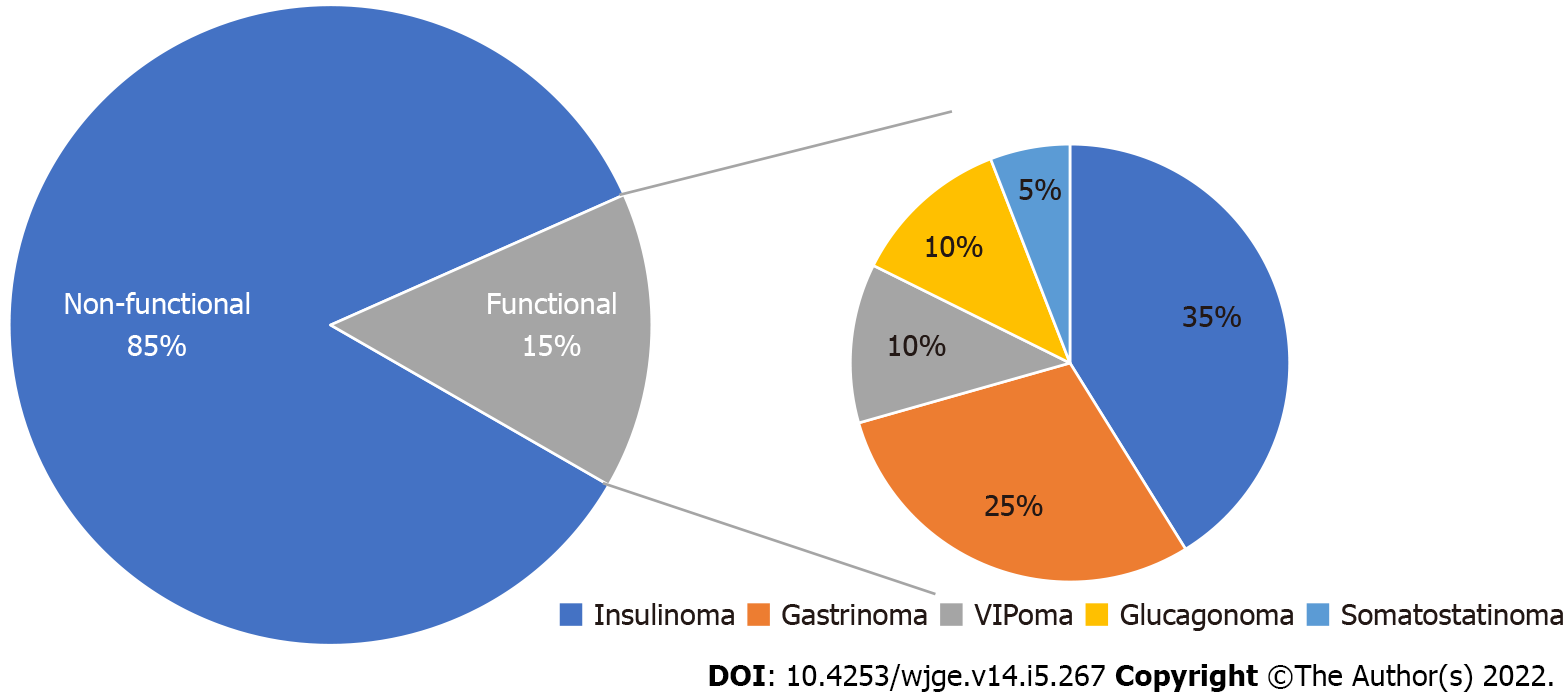
Figure 2 Epidemiology of pancreatic neuroendocrine neoplasms.
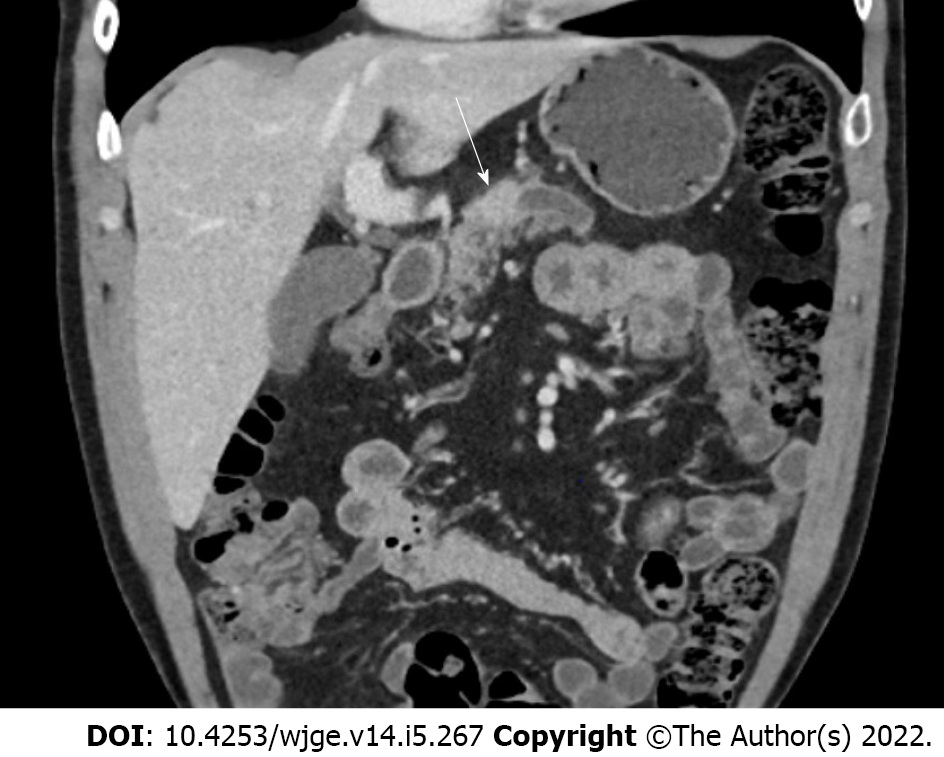
Figure 3 Computerized tomography scan of hyperenhancing pancreatic neuroendocrine tumor (white arrow).
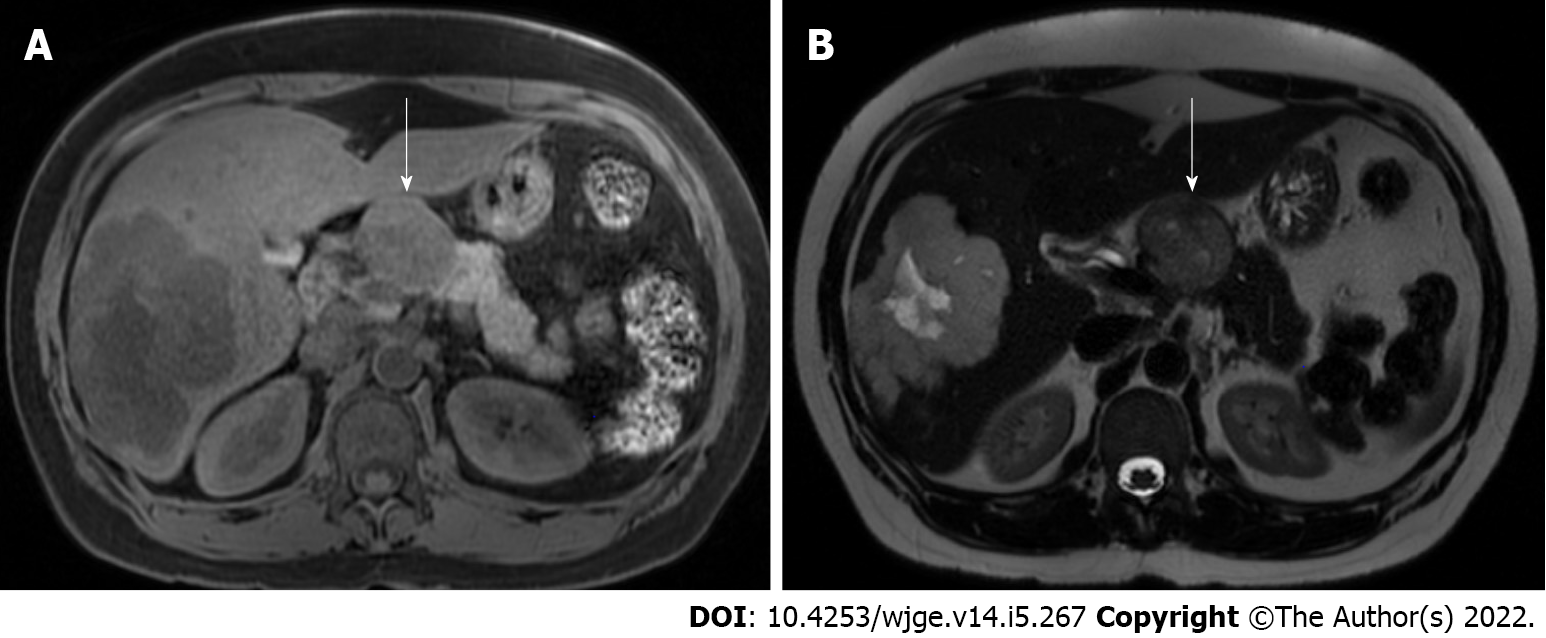
Figure 4 Magnetic resonance imaging with T1 hypointense and T2 mildly hyperintense well-defined peri-pancreatic neuroendocrine tumor.
A: T1 hypointense; B: T2 mildly hyperintense.
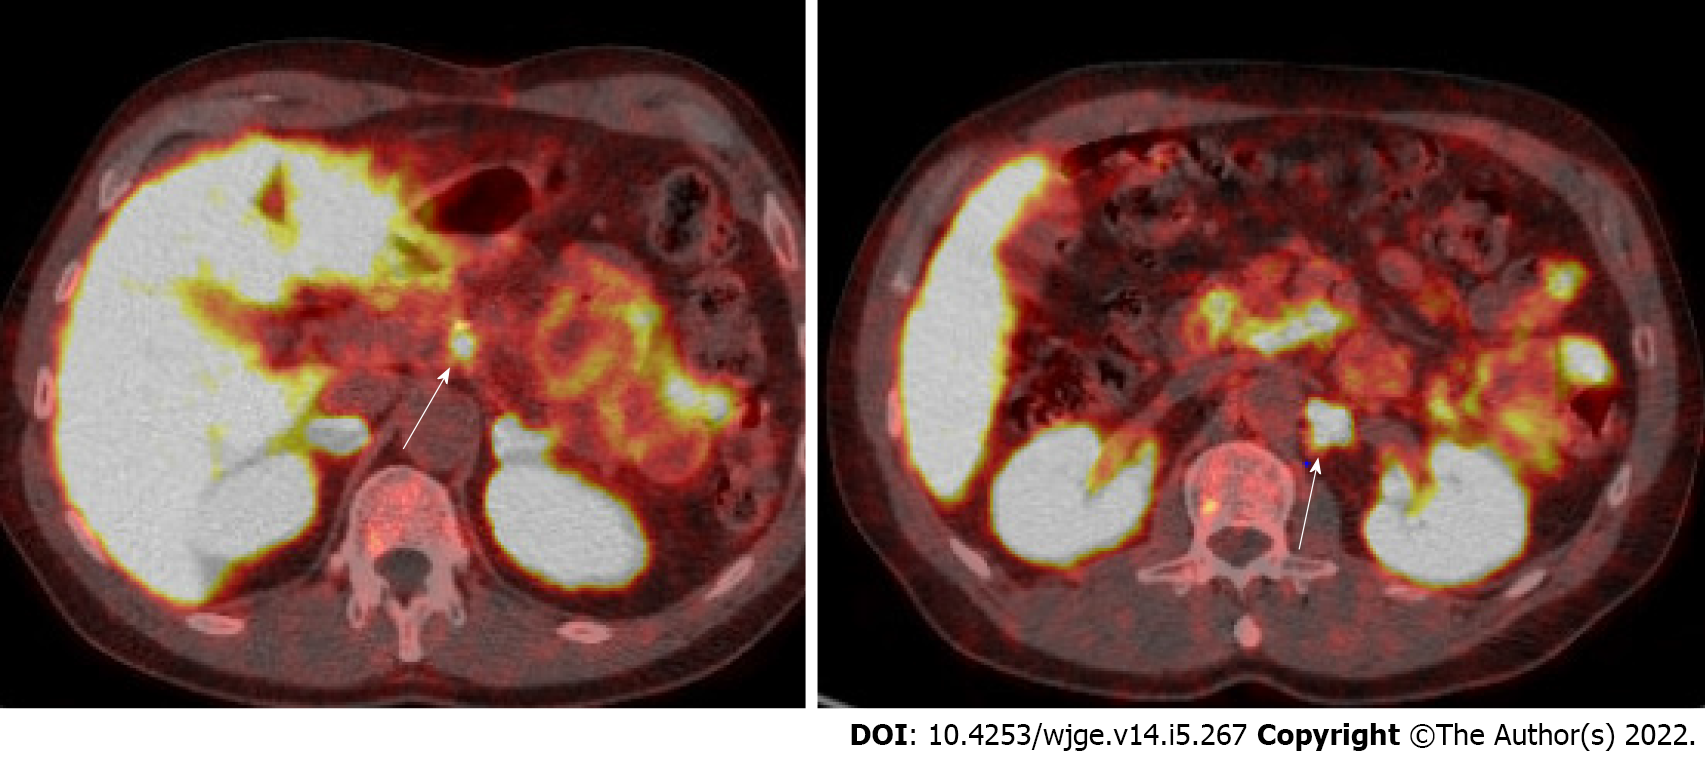
Figure 5 Gallium-68 DOTATATE positron emission tomography/computed tomography demonstrating avid lymph nodes.
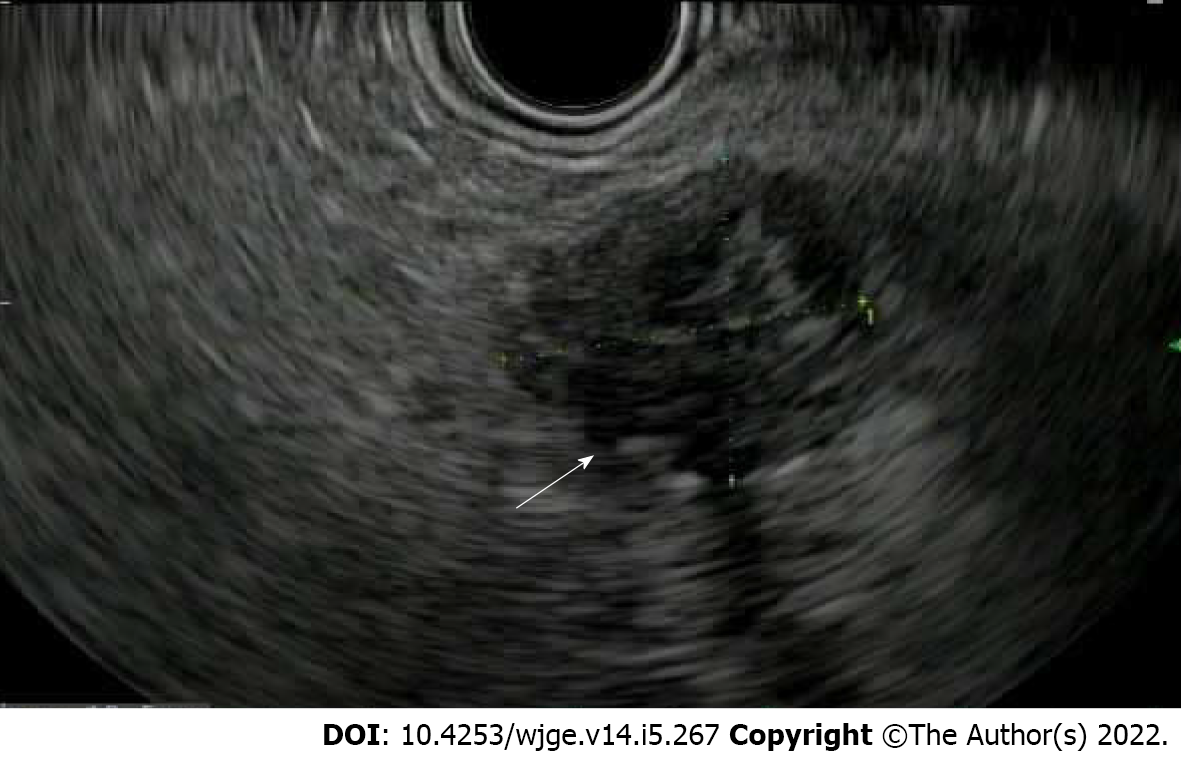
Figure 6 Endoscopic ultrasound of pancreatic neuroendocrine tumor appearing well-defined and hypoechoic.
Figure 7 Endoscopic and endoscopic ultrasound views of type 1 small, superficial neuroendocrine lesions in gastric body.
A and B: Endoscopic; C: Endoscopic ultrasound.
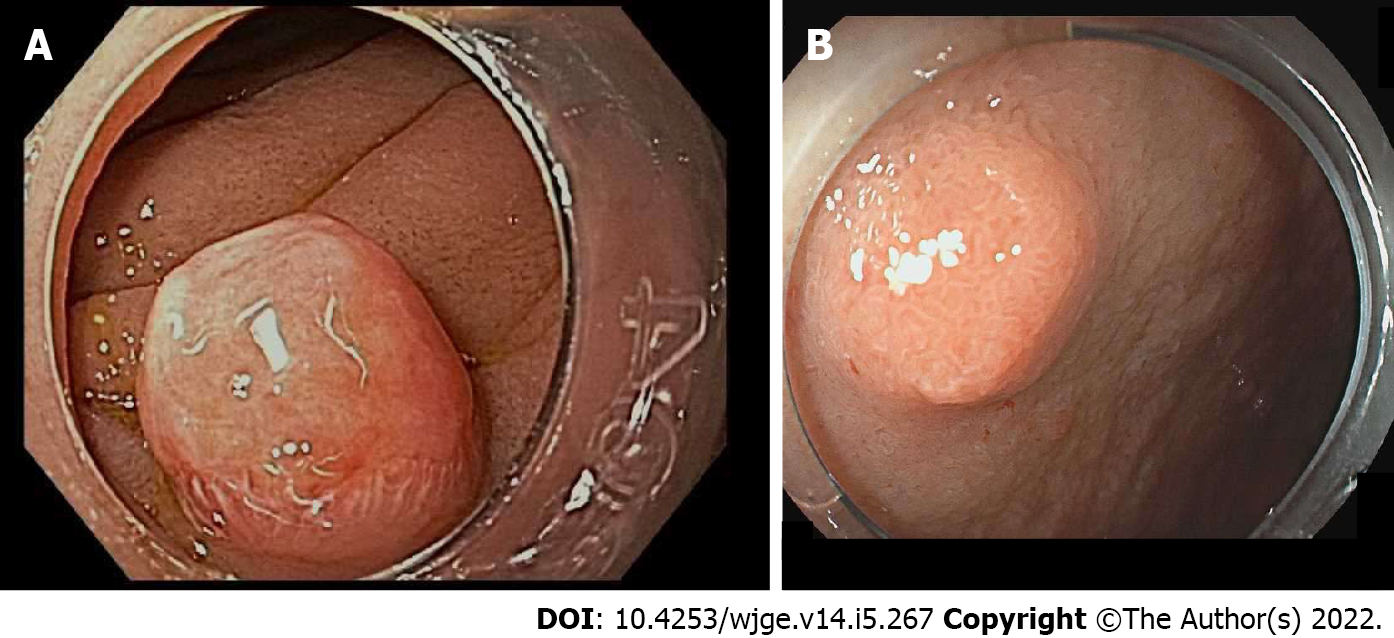
Figure 8 Endoscopic imaging of duodenal neuroendocrine tumors.
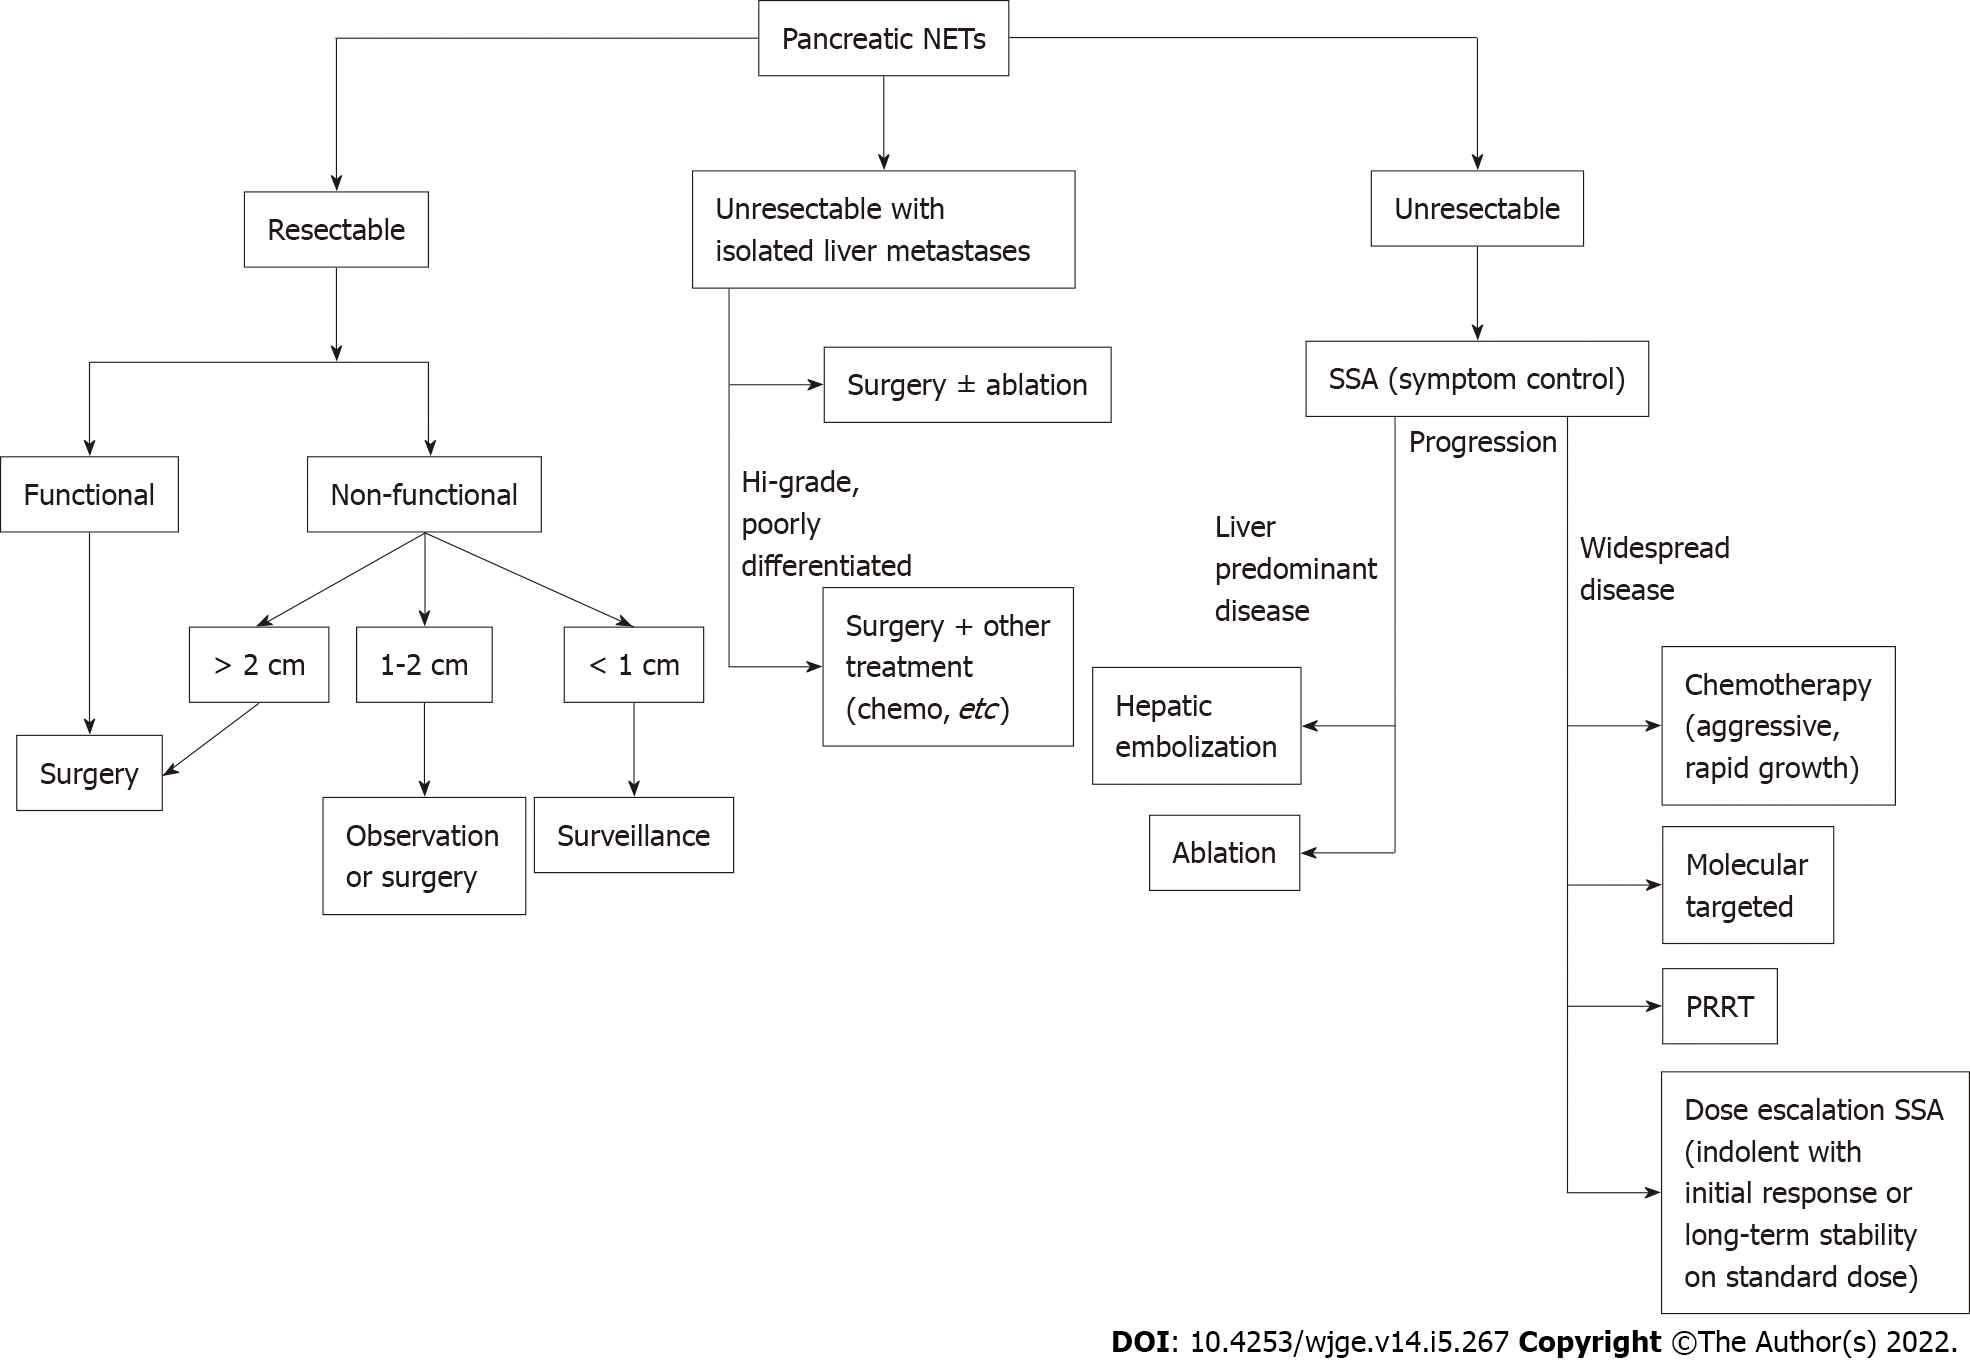
Figure 9 Treatment algorithm for pancreatic neuroendocrine tumors.
NET: Neuroendocrine tumor; SSA: Somatostatin analogue; PRRT: Peptide receptor radionuclide therapy.
- Citation: Canakis A, Lee LS. Current updates and future directions in diagnosis and management of gastroenteropancreatic neuroendocrine neoplasms. World J Gastrointest Endosc 2022; 14(5): 267-290
- URL: https://www.wjgnet.com/1948-5190/full/v14/i5/267.htm
- DOI: https://dx.doi.org/10.4253/wjge.v14.i5.267


