Copyright
©The Author(s) 2021.
World J Gastrointest Endosc. Jul 16, 2021; 13(7): 233-237
Published online Jul 16, 2021. doi: 10.4253/wjge.v13.i7.233
Published online Jul 16, 2021. doi: 10.4253/wjge.v13.i7.233
Figure 1 Computed tomography scan images of the pelvis.
A: Plain; B: Arterial phase; and C: Delayed phase; Contrast extravasation is observed in the lower rectum on the arterial phase with further pooling of contrast on the delayed phase (orange arrow).
Figure 2 Endoscopic images of emergent colonoscopy.
A: Massive pulsatile bleeding from the ulcer on the lower rectum hindered the detection of the bleeding point with white light imaging; B: After switching to red dichromatic imaging, the bleeding point was observed as deep yellow (orange arrow) compared to surrounding blood, and that allowed us to recognize it precisely; and C: The bleeding vessel was coagulated, and hemostasis was achieved successfully with red dichromatic imaging.
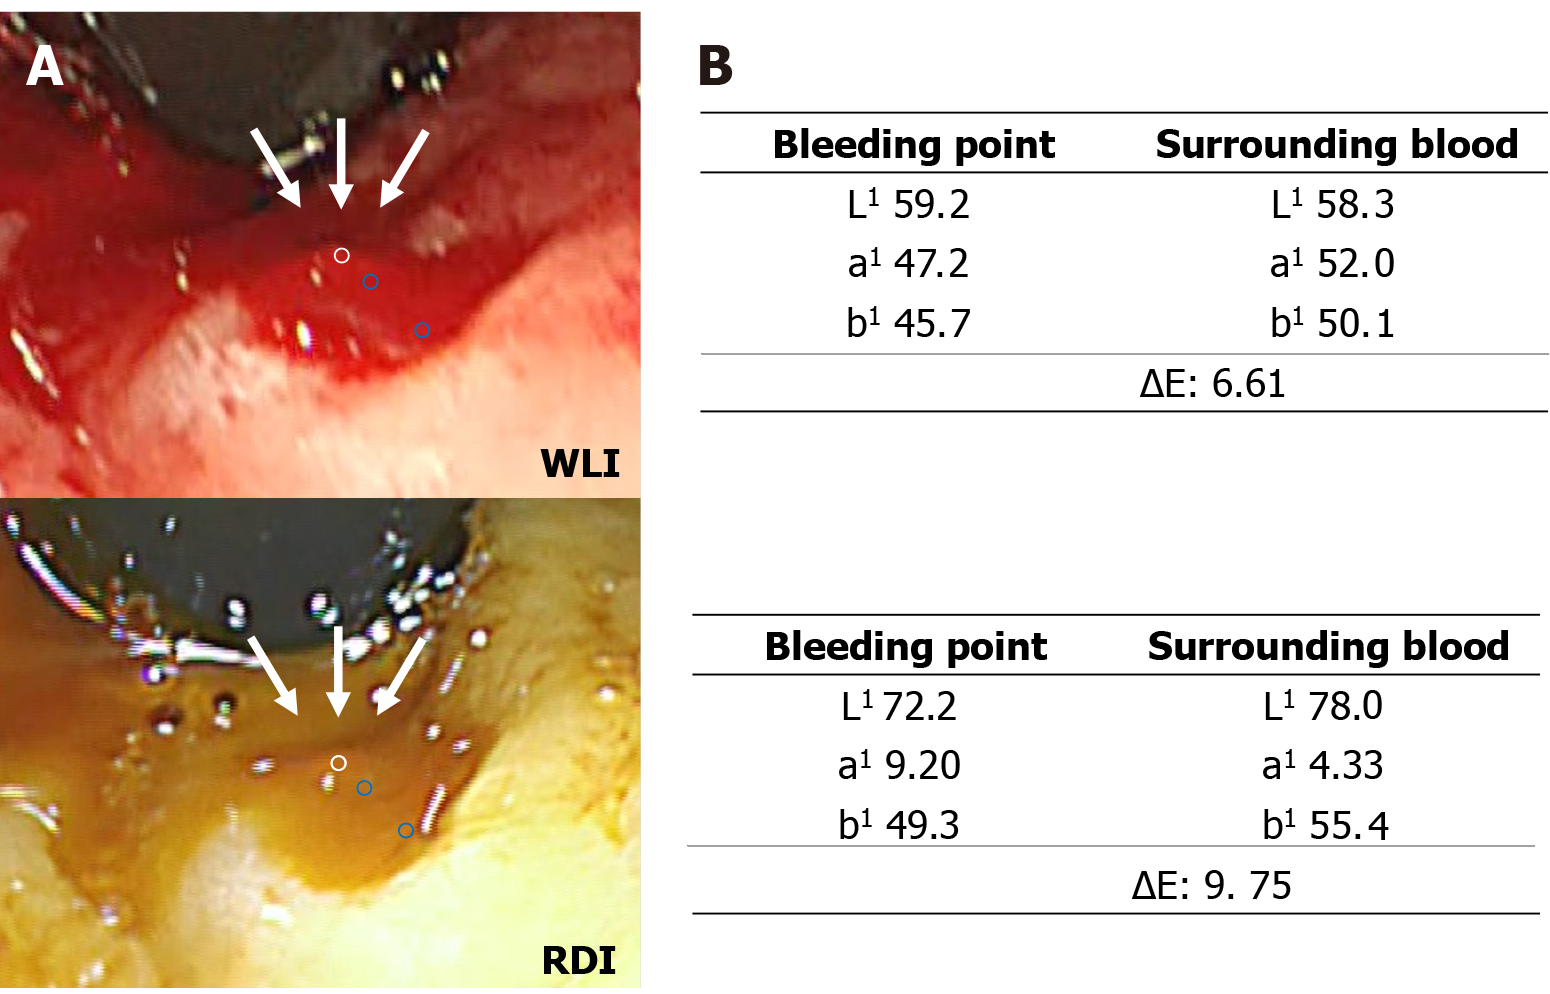
Figure 3 Color values and color differences between bleeding point and surrounding blood.
A: The regions of interests (ROIs) were located in the bleeding point and at two selected points in surrounding blood (one was just next to outside of the bleeding point and the other was just inside the surrounding blood), avoiding areas with halation. Each ROI was set approximately in the same region for white light imaging and red dichromatic imaging. The white and blue circles indicate the ROI of the bleeding point (white arrow) and surrounding blood, respectively. The color values were defined as the median color value in each ROI; and B: The ΔE based on color value change between the ROI of the bleeding point and surrounding blood. WLI: White light imaging; RDI: Red dichromatic imaging; ΔE: Color difference.
- Citation: Hirai Y, Kayashima A, Nakazato Y, Fujimoto A. Visibility of the bleeding point in acute rectal hemorrhagic ulcer using red dichromatic imaging: A case report. World J Gastrointest Endosc 2021; 13(7): 233-237
- URL: https://www.wjgnet.com/1948-5190/full/v13/i7/233.htm
- DOI: https://dx.doi.org/10.4253/wjge.v13.i7.233


