Copyright
©The Author(s) 2018.
World J Gastrointest Endosc. Oct 16, 2018; 10(10): 239-249
Published online Oct 16, 2018. doi: 10.4253/wjge.v10.i10.239
Published online Oct 16, 2018. doi: 10.4253/wjge.v10.i10.239
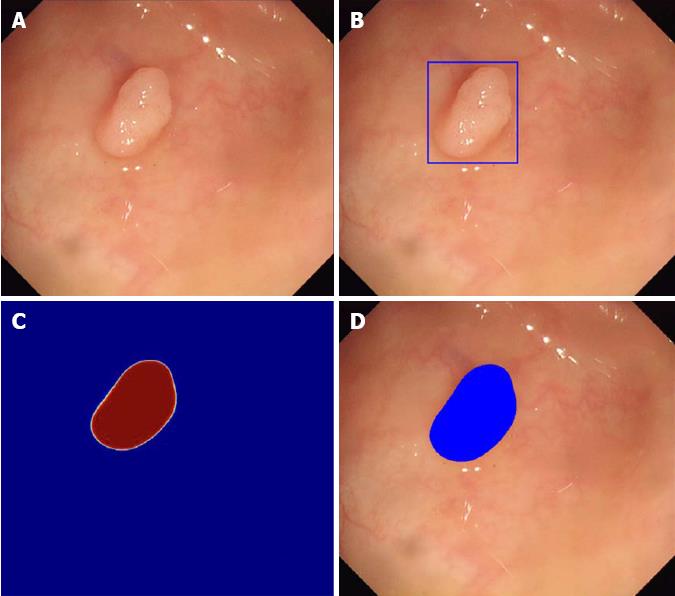
Figure 1 Automatic polyp detection by Wang et al[40].
A: Original image obtained during colonoscopy; B: Automatic detection by box method; C: Probability map whereby red indicates high probability of polyp and blue indicates low probability of polyp; D: Automatic detection by paint method whereby blue coloring indicates location of polyp.
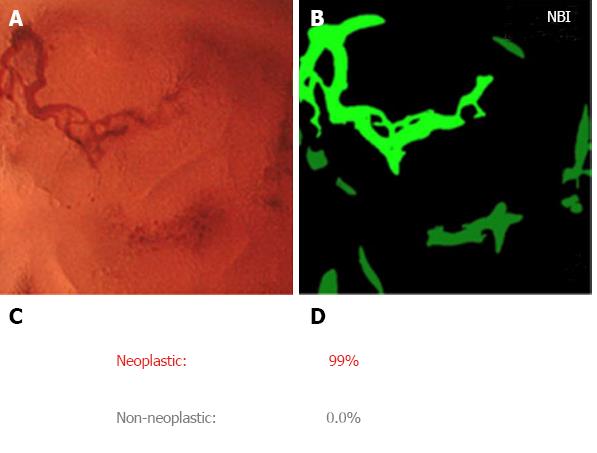
Figure 2 Output from artifical intelligence-assisted endocytoscopy system by Misawa et al[57].
A: Input from endocytoscopy with narrow band imaging; B: Extracted vessel image whereby green light represents extracted vessel image; C: System outputs diagnosis of neoplastic or non-neoplastic; D: Probability of diagnosis calculated by support vector machine classifier. NBI: narrow band imaging.
Figure 3 Automatic polyp classification system.
1: Input from narrow band imaging; 2: Computer diagnosis of NICE type 1 (hyperplastic) vs NICE type 2 (adenomatous); 3: Probability of diagnosis; 4: Computer determined confidence in diagnosis probability. Obtained with permission from Dr. Michael Byrne (Division of Gastroenterology at Vancouver General Hospital and UBC).
- Citation: Alagappan M, Brown JRG, Mori Y, Berzin TM. Artificial intelligence in gastrointestinal endoscopy: The future is almost here. World J Gastrointest Endosc 2018; 10(10): 239-249
- URL: https://www.wjgnet.com/1948-5190/full/v10/i10/239.htm
- DOI: https://dx.doi.org/10.4253/wjge.v10.i10.239


