Copyright
©The Author(s) 2016.
World J Hepatol. Mar 8, 2016; 8(7): 355-367
Published online Mar 8, 2016. doi: 10.4254/wjh.v8.i7.355
Published online Mar 8, 2016. doi: 10.4254/wjh.v8.i7.355
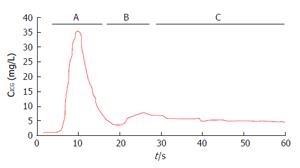
Figure 2 Indocyanine green dilution curve.
A: First peak; B: Second peak (re-circulation phase); C: Elimination phase (Modified from Vos et al[6], 2014). ICG: Indocyanine green; CICG: ICG blood concentration.
- Citation: De Gasperi A, Mazza E, Prosperi M. Indocyanine green kinetics to assess liver function: Ready for a clinical dynamic assessment in major liver surgery? World J Hepatol 2016; 8(7): 355-367
- URL: https://www.wjgnet.com/1948-5182/full/v8/i7/355.htm
- DOI: https://dx.doi.org/10.4254/wjh.v8.i7.355


