Copyright
©2012 Baishideng Publishing Group Co.
World J Hepatol. Dec 27, 2012; 4(12): 406-411
Published online Dec 27, 2012. doi: 10.4254/wjh.v4.i12.406
Published online Dec 27, 2012. doi: 10.4254/wjh.v4.i12.406
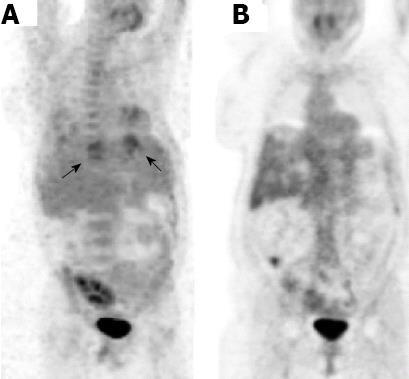
Figure 6 A positron emission tomography-computed tomography scan during the infection (A) and after treatment (B).
Picture A shows appearances consistent with multiple infectious cysts, with a medium intense, circular fluorodeoxyglucose-accumulation in the middle of the right liver.
- Citation: Macutkiewicz C, Plastow R, Chrispijn M, Filobbos R, Ammori BA, Sherlock DJ, Drenth JP, O'Reilly DA. Complications arising in simple and polycystic liver cysts. World J Hepatol 2012; 4(12): 406-411
- URL: https://www.wjgnet.com/1948-5182/full/v4/i12/406.htm
- DOI: https://dx.doi.org/10.4254/wjh.v4.i12.406


