Copyright
©The Author(s) 2017.
World J Hepatol. Feb 28, 2017; 9(6): 333-342
Published online Feb 28, 2017. doi: 10.4254/wjh.v9.i6.333
Published online Feb 28, 2017. doi: 10.4254/wjh.v9.i6.333
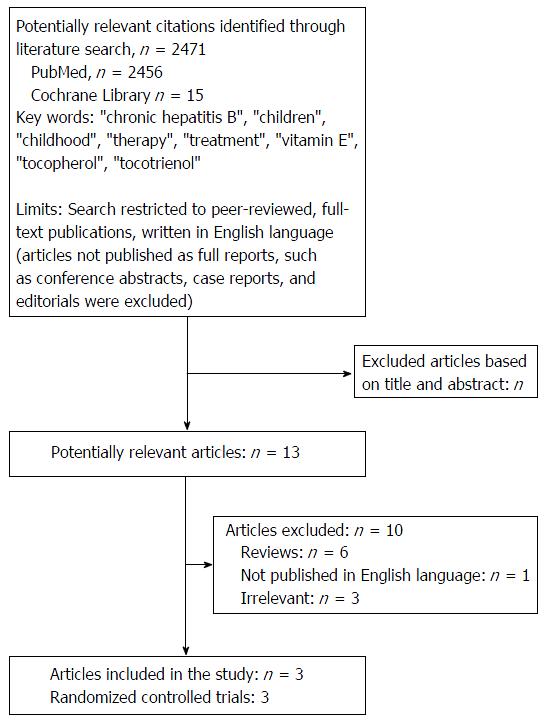
Figure 1 Study flow diagram concerning vitamin E use in children with hepatitis B e antigen positive chronic hepatitis.
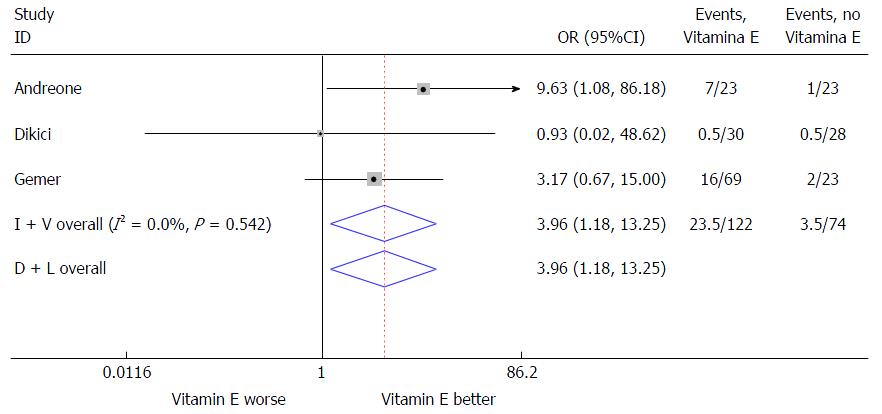
Figure 2 The relationship between vitamin E use and hepatitis B e antigen seroconversion in published studies.
The area of each black square is proportional to the statistical size and the centre of the square is placed at the point of estimate. Error bars indicate 95%CIs for the estimate for each study. I + V: Inverse variance method; D + L: DerSimonian and Laird method.
- Citation: Fiorino S, Bacchi-Reggiani ML, Leandri P, Loggi E, Andreone P. Vitamin E for the treatment of children with hepatitis B e antigen-positive chronic hepatitis: A systematic review and meta-analysis. World J Hepatol 2017; 9(6): 333-342
- URL: https://www.wjgnet.com/1948-5182/full/v9/i6/333.htm
- DOI: https://dx.doi.org/10.4254/wjh.v9.i6.333


