Copyright
©The Author(s) 2017.
World J Hepatol. Jan 28, 2017; 9(3): 147-154
Published online Jan 28, 2017. doi: 10.4254/wjh.v9.i3.147
Published online Jan 28, 2017. doi: 10.4254/wjh.v9.i3.147
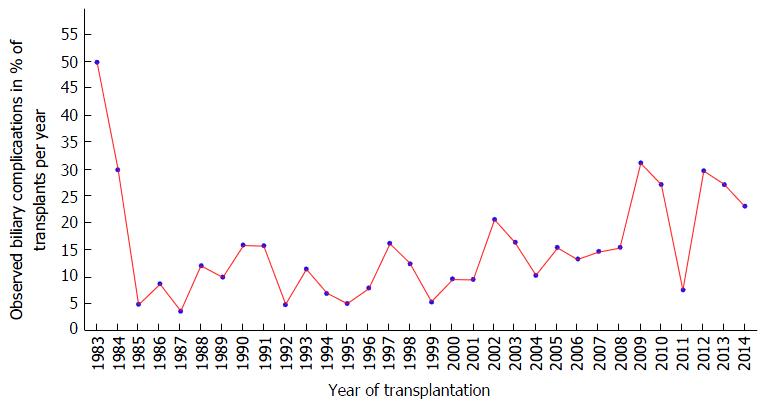
Figure 1 Observed biliary complications as a percent of transplant per year over 30 years.
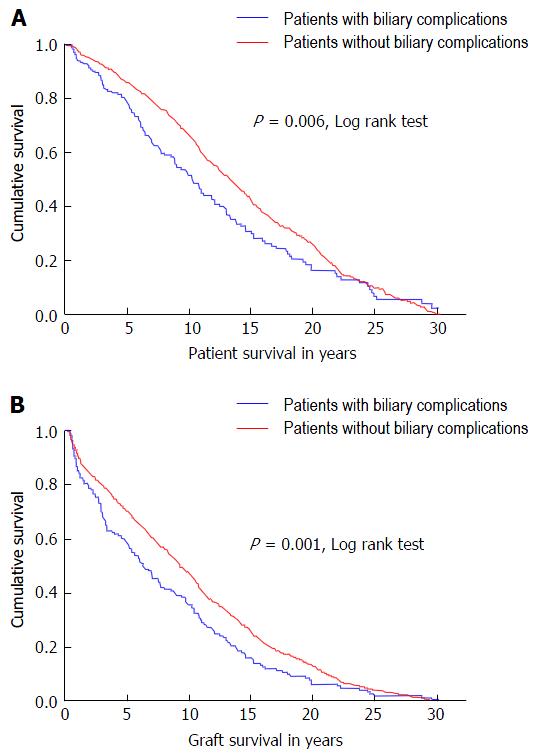
Figure 2 Kaplan Meier curve showing the cumulative survival of (A) patients with and without biliary complications (B) graft survival of both groups.
Figure 3 Different biliary complications in the Model of End-Stage Liver Disease era.
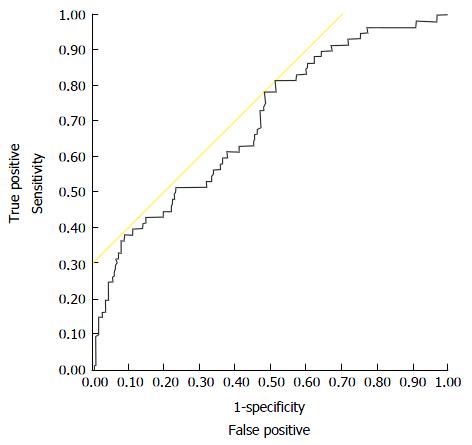
Figure 4 Receiver operating characteristic-curve of the developed prognostic model for the prediction of anastomotic biliary complications in the Model of End-Stage Liver Disease-era (n = 417 liver transplants).
The area under the receiver operating-curve is 0.702 indicating a useful and clinical applicable prognostic model.
- Citation: Kaltenborn A, Gutcke A, Gwiasda J, Klempnauer J, Schrem H. Biliary complications following liver transplantation: Single-center experience over three decades and recent risk factors. World J Hepatol 2017; 9(3): 147-154
- URL: https://www.wjgnet.com/1948-5182/full/v9/i3/147.htm
- DOI: https://dx.doi.org/10.4254/wjh.v9.i3.147


