Copyright
©The Author(s) 2017.
World J Hepatol. Jun 18, 2017; 9(17): 791-796
Published online Jun 18, 2017. doi: 10.4254/wjh.v9.i17.791
Published online Jun 18, 2017. doi: 10.4254/wjh.v9.i17.791
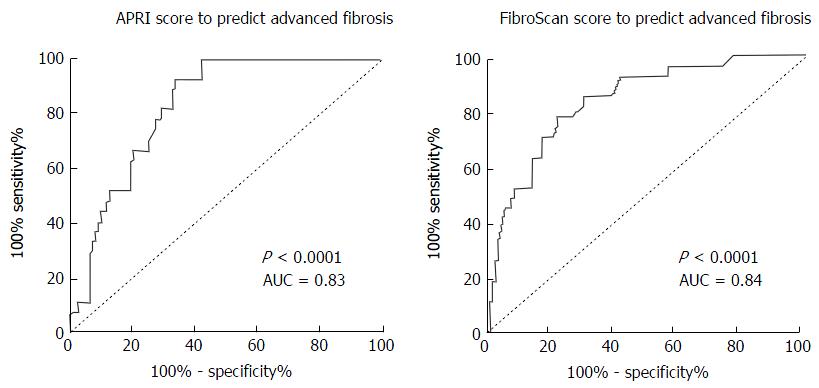
Figure 1 Area under the receiver operating curves depicting the performance of aspartate aminotransferase to platelet ratio score and FibroScan in the prediction of advanced fibrosis on liver biopsy.
APRI: Aspartate aminotransferase to platelet ratio; AUC: Area under curve.
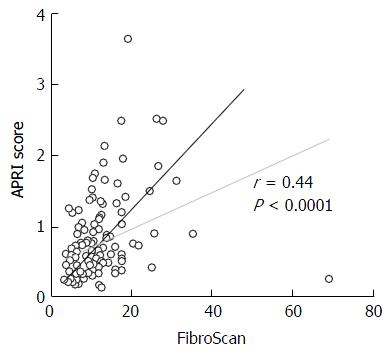
Figure 2 Correlation between aspartate aminotransferase to platelet ratio score and Z-score of FibroScan.
APRI: Aspartate aminotransferase to platelet ratio.
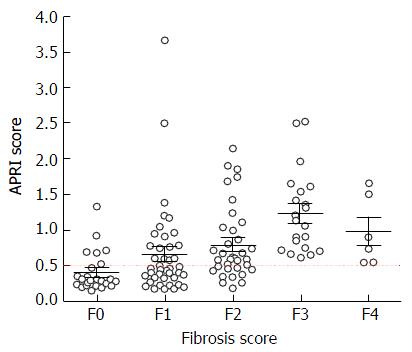
Figure 3 Plot diagram depicting the aspartate aminotransferase to platelet ratio scores in each category fibrosis scores rated on liver biopsy.
APRI: Aspartate aminotransferase to platelet ratio.
- Citation: Wong S, Huynh D, Zhang F, Nguyen NQ. Use of aspartate aminotransferase to platelet ratio to reduce the need for FibroScan in the evaluation of liver fibrosis. World J Hepatol 2017; 9(17): 791-796
- URL: https://www.wjgnet.com/1948-5182/full/v9/i17/791.htm
- DOI: https://dx.doi.org/10.4254/wjh.v9.i17.791


