Copyright
©The Author(s) 2017.
World J Hepatol. Jun 18, 2017; 9(17): 781-790
Published online Jun 18, 2017. doi: 10.4254/wjh.v9.i17.781
Published online Jun 18, 2017. doi: 10.4254/wjh.v9.i17.781
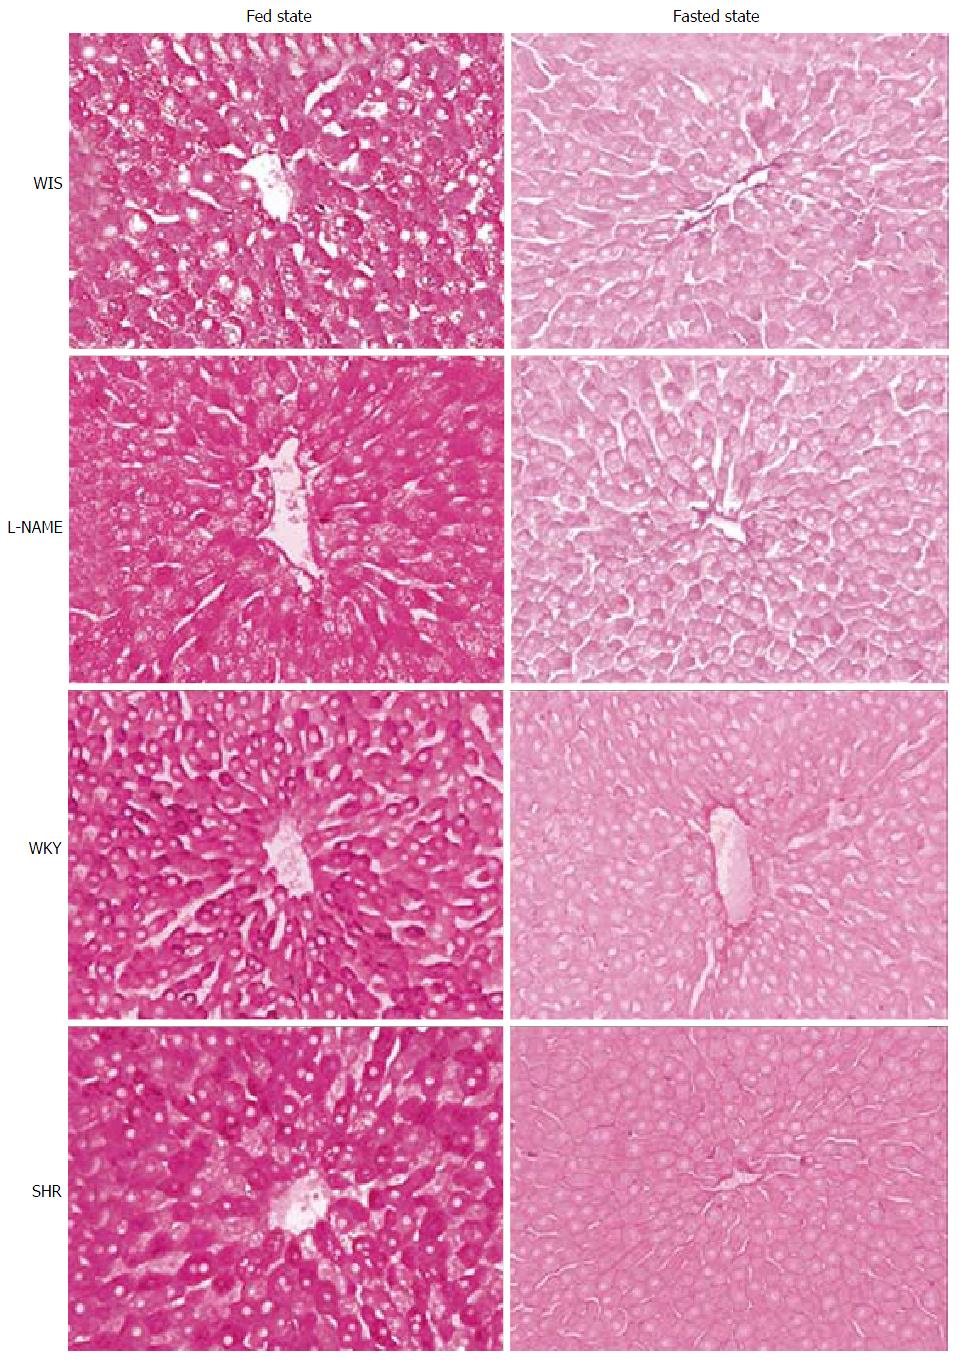
Figure 1 Hepatic glycogen.
Periodic acid Schiff’s staining of cross-section of perfused livers from fed or 12 h fasted rats. Fragments taken after 30 min of perfusion. Increase 200 ×. WIS: Similar to normal rats; SHR: Spontaneously hypertensive rat; WKY: Wistar Kyoto.
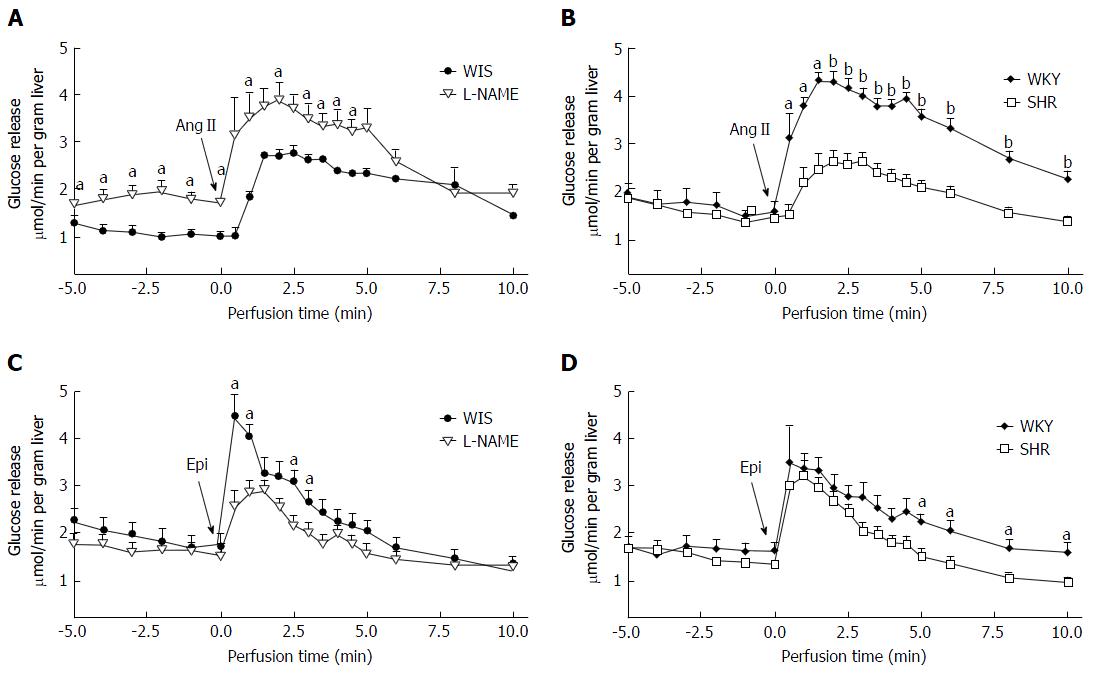
Figure 2 Glucose release induced by angiotensin II and epinephrine.
Livers were perfused with Krebs-Henseleit-bicarbonate buffer and after stabilization 2 nmol AngII (A, B) or 40 nmol Epi (C, D) was injected in bolus into afferent cannula and this moment was considered as time 0 min. Glucose release was determined in perfusate aliquots collected during all experiments. Student’s t-test; aP < 0.05 and bP < 0.0001 compared with respective controls for each time point. WIS: Similar to normal rats; SHR: Spontaneously hypertensive rat; WKY: Wistar Kyoto; Ang: Angiotensin; Epi: Epinephrine.
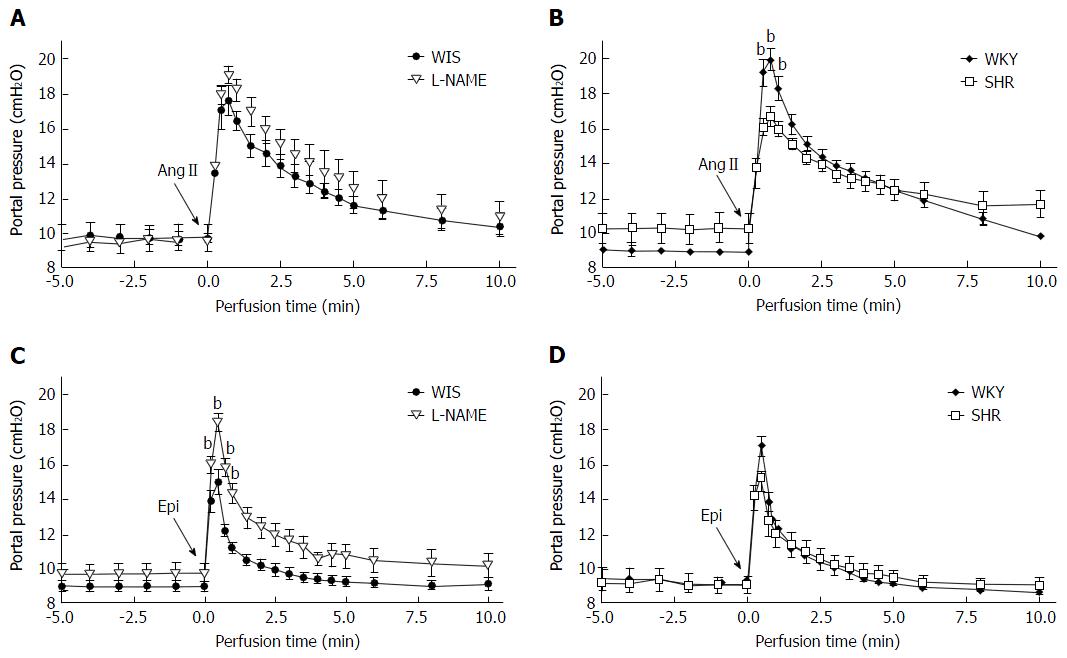
Figure 3 Portal pressure induced by angiotensin II or epinephrine.
Livers were perfused with Krebs-Henseleit-bicarbonate buffer and after 20 min stabilization, 2 nmol AngII (A, B) or 40 nmol epinephrine (C, D) was injected in bolus into afferent cannula and this moment was considered as time 0 min. The portal pressure was continuously monitored by water manometer attached to the circuit before the cannula. Student’s t-test; bP < 0.0001 compared with respective controls for each time point. WIS: Similar to normal rats; SHR: Spontaneously hypertensive rat; WKY: Wistar Kyoto; Ang: Angiotensin; Epi: Epinephrine.
- Citation: Kimura DC, Nagaoka MR, Borges DR, Kouyoumdjian M. Angiotensin II or epinephrine hemodynamic and metabolic responses in the liver of L-NAME induced hypertension and spontaneous hypertensive rats. World J Hepatol 2017; 9(17): 781-790
- URL: https://www.wjgnet.com/1948-5182/full/v9/i17/781.htm
- DOI: https://dx.doi.org/10.4254/wjh.v9.i17.781


