Copyright
©The Author(s) 2016.
World J Hepatol. Feb 28, 2016; 8(6): 322-330
Published online Feb 28, 2016. doi: 10.4254/wjh.v8.i6.322
Published online Feb 28, 2016. doi: 10.4254/wjh.v8.i6.322
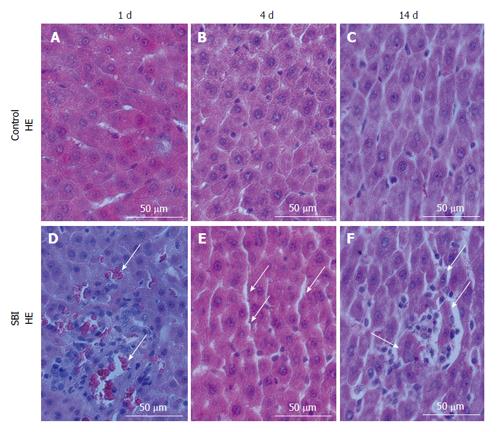
Figure 1 Sections of rat liver stained with hematoxylin and eosin; panels show groups control (A-C) and submitted to scald burn injury (D-F) evaluated in different periods.
A-C: Hepatocytes and sinusoidal cells with normal aspect; D: Sinusoidal space filled by erythrocytes (arrows) and inflammatory infiltrate; E: Sinusoidal space increased (arrows); F: Sinusoidal space increased and inflammatory cells rounding hepatocytes in degeneration process (arrows). SBI: Scald burn injury.
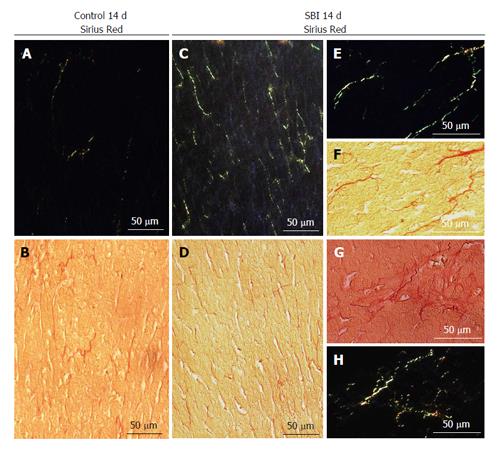
Figure 2 Liver sections stained with Sirius Red with normal (B, D, F and G) and polarized light (A, C, E and H).
Panels show control group 14 d after sham (A and B) or burn injury (C-H). Notes connective tissue was increased in SBI group when compared with Control. SBI: Scald burn injury.
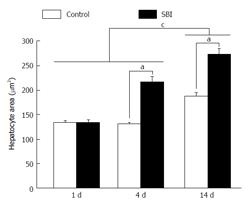
Figure 3 Mean + SD of hepatocyte area.
aP < 0.05 - hepatocyte area of SBI group increased than control; cP < 0.05 - animals with 14 d sham or post burn injury showed hepatocyte larger than other periods investigated. SBI: Scald burn injury.
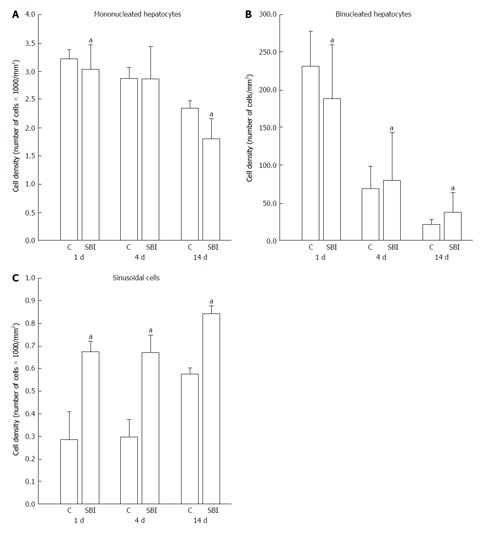
Figure 4 Mean + SD of cell density (number of cells/mm2).
Cell density of mononucleated hepatocytes (A), binucleated hepatocytes (B) and sinusoidal cells (C). aP < 0.05, SBI different from control. SBI: Scald burn injury; C: Control.
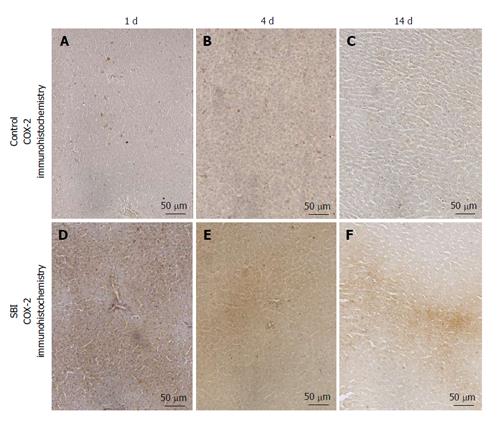
Figure 5 Liver ciclooxigenase-2 immunohistochemistry.
Control (A-C) and SBI (D-F) evaluated 1, 4 or 14 d after burn injury. Notes stronger cytoplasmic immunoexpression in SBI groups when compared with control. SBI: Scald burn injury; COX-2: Ciclooxigenase-2.
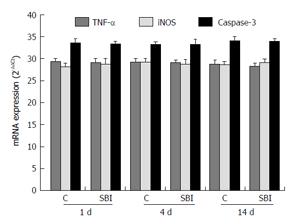
Figure 6 Mean + SD of liver tumor necrosis factor-α, inducible nitric oxide synthase and caspase-3 mRNA expression.
TNF-α: Tumor necrosis factor-α; iNOS: Inducible nitric oxide synthase; C: Control; SBI: Scald burn injury.
- Citation: Bortolin JA, Quintana HT, Tomé TC, Ribeiro FAP, Ribeiro DA, de Oliveira F. Burn injury induces histopathological changes and cell proliferation in liver of rats. World J Hepatol 2016; 8(6): 322-330
- URL: https://www.wjgnet.com/1948-5182/full/v8/i6/322.htm
- DOI: https://dx.doi.org/10.4254/wjh.v8.i6.322


