Copyright
©The Author(s) 2016.
World J Hepatol. Dec 28, 2016; 8(36): 1610-1616
Published online Dec 28, 2016. doi: 10.4254/wjh.v8.i36.1610
Published online Dec 28, 2016. doi: 10.4254/wjh.v8.i36.1610
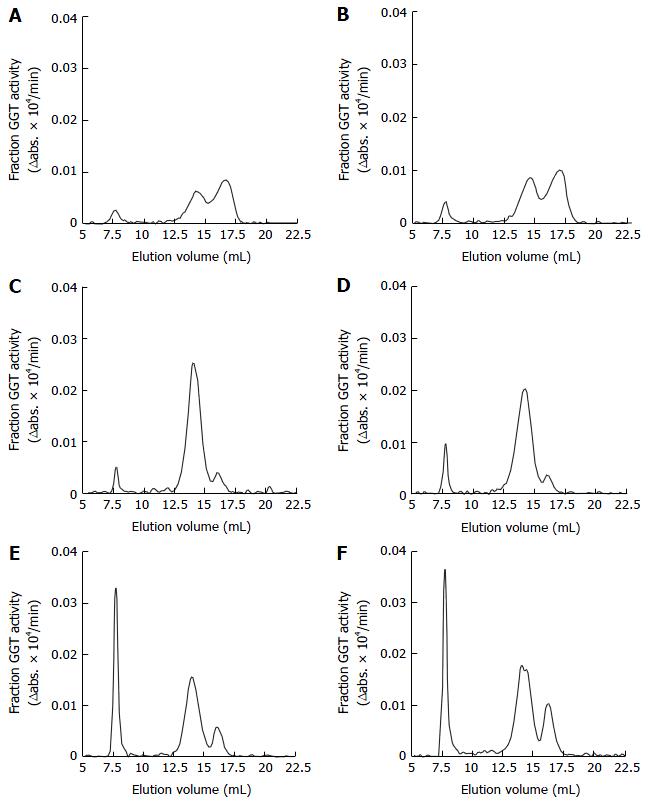
Figure 1 Gamma-glutamyltransferase-specific elution profiles of representative serum samples (two of each) obtained from the control group subjects (A and B), patients with alcoholic liver disease (C and D), and patients with non-alcoholic fatty liver disease (E and F).
On the basis of the molecular weight calibration curve (data not shown), these four peaks are equivalent to big-GGT (MW > 2000 kDa, eluted between 6.25-9.50 mL), medium GGT (MW 940 kDa, eluted between 9.5-12.25 mL), small GGT (MW 140 kDa, eluted between 12.25–15.5 mL) and free-GGT (MW 70 kDa, eluted between 15.5-20 mL), respectively. GGT: Gamma-glutamyltransferase.
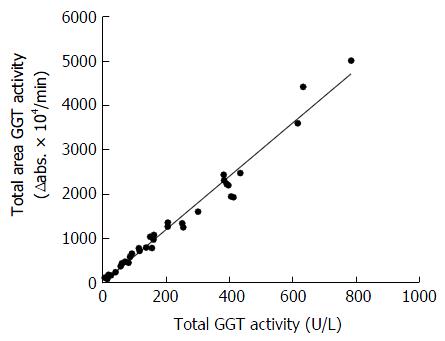
Figure 2 Linear correlation between the total area under the chromatograph curve multiplied by serum dilution factors and total serum gamma-glutamyltransferase activity.
Elution volume (between 12-38 mL). y = 5.9667x + 15.303; r = 0.988; P < 0.001; n = 49. GGT: Gamma-glutamyltransferase.
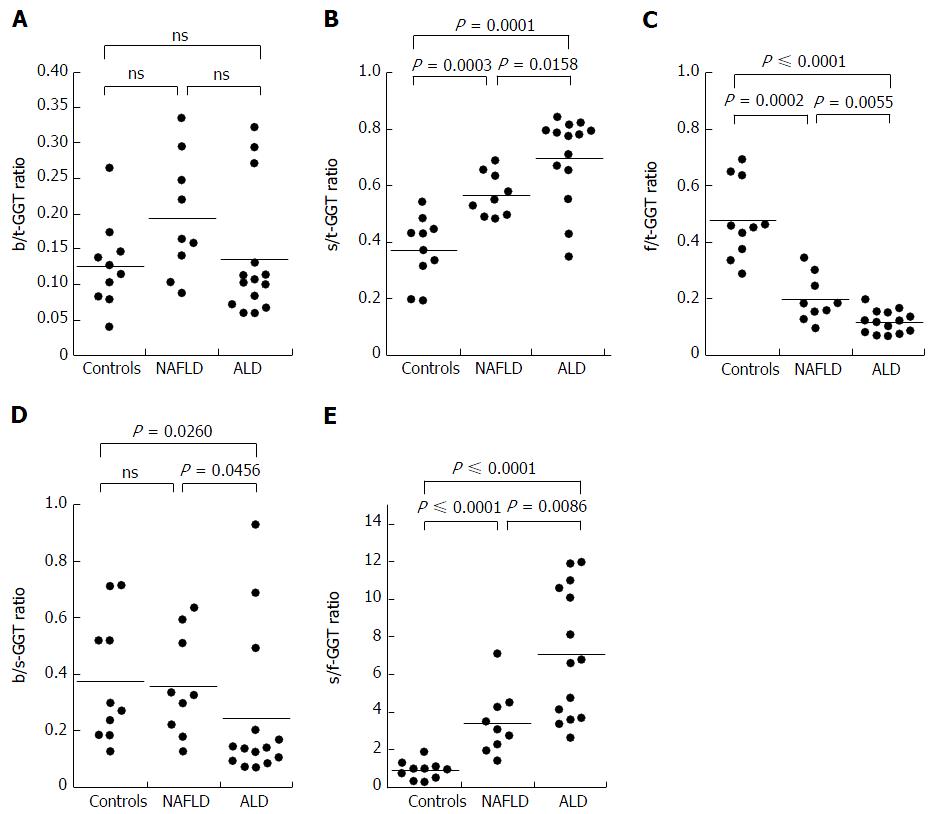
Figure 3 Serum b-GGT/t-GGT, s-GGT/t-GGT, f-GGT/t-GGT, b-GGT/s-GGT and s-GGT/f-GGT ratios in patients with biopsy-proven non-alcoholic fatty liver disease, biopsy-proven alcoholic liver disease and the controls group.
ALD: Alcoholic liver disease; NAFLD: Non-alcoholic fatty liver disease; GGT: Gamma-glutamyltransferase; b-GGT: Big-GGT; t-GGT: Total-GGT; s-GGT: Small-GGT; f-GGT: Free-GGT; ns: No significant differences.
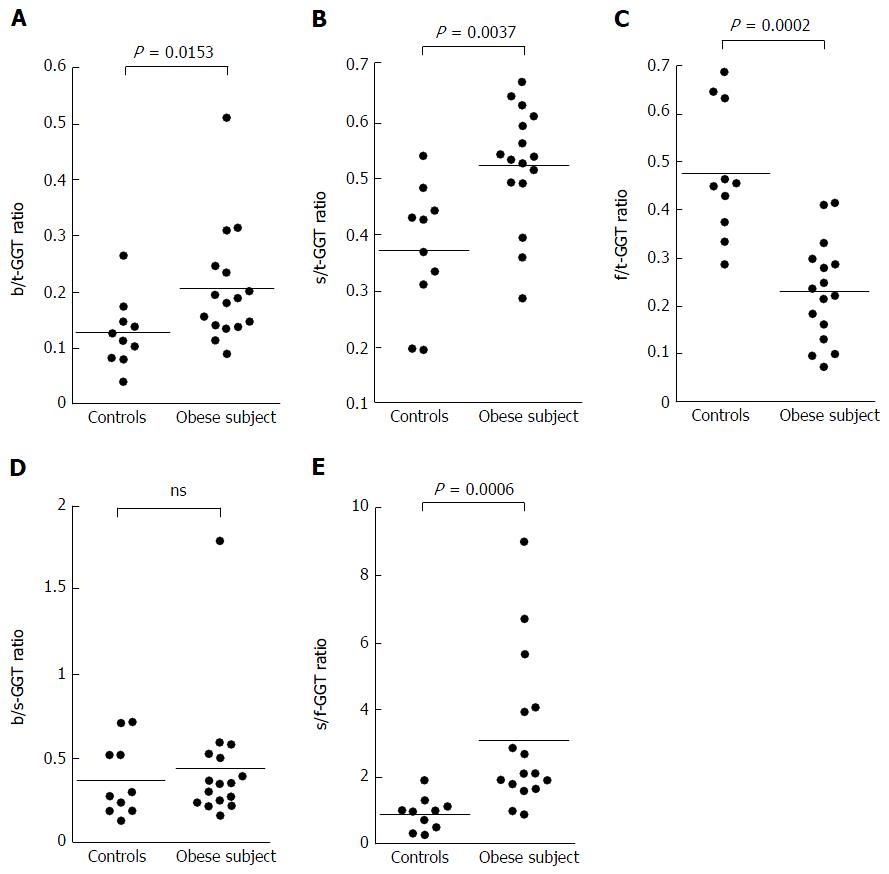
Figure 4 Serum b-GGT/t-GGT, s-GGT/t-GGT, f-GGT/t-GGT, b-GGT/s-GGT, and s-GGT/f-GGT ratios in patients with non-alcoholic fatty liver disease clinically diagnosed by ultrasonography.
GGT: Gamma-glutamyltransferase; b-GGT: Big-GGT; t-GGT: Total-GGT; s-GGT: Small-GGT; f-GGT: Free-GGT; ns: No significant differences.
- Citation: Sueyoshi S, Sawai S, Satoh M, Seimiya M, Sogawa K, Fukumura A, Tsutsumi M, Nomura F. Fractionation of gamma-glutamyltransferase in patients with nonalcoholic fatty liver disease and alcoholic liver disease. World J Hepatol 2016; 8(36): 1610-1616
- URL: https://www.wjgnet.com/1948-5182/full/v8/i36/1610.htm
- DOI: https://dx.doi.org/10.4254/wjh.v8.i36.1610


