Copyright
©The Author(s) 2016.
World J Hepatol. Dec 18, 2016; 8(35): 1547-1556
Published online Dec 18, 2016. doi: 10.4254/wjh.v8.i35.1547
Published online Dec 18, 2016. doi: 10.4254/wjh.v8.i35.1547
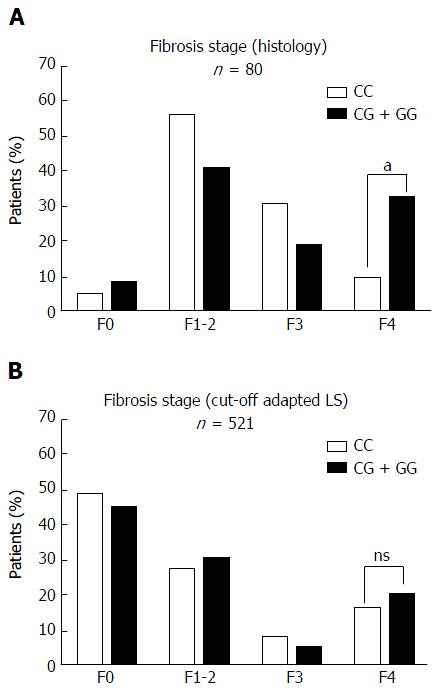
Figure 1 Distribution of fibrosis stages using (A) histology (Kleiner fibrosis score F0-4) or (B) non-invasive liver stiffness measurement (aspartate transaminase-adapted cut-off values).
aP < 0.05. ns: Not significantly; LS: Liver stiffness.
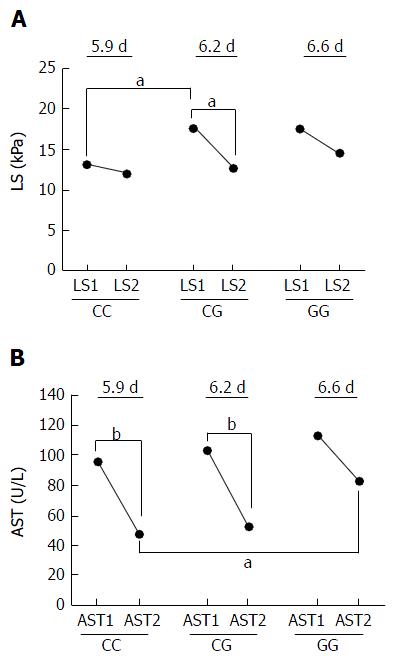
Figure 2 PNPLA3 carrier status and its effect on liver stiffness (A) and aspartate transaminase (B) levels prior and after alcohol detoxification (1 and 2).
Mean observation of detoxification periods in days are indicated for each genotype. aP < 0.05, bP < 0.01. AST: Aspartate transaminase; ALT: Alanine transaminase; LS: Liver stiffness.
- Citation: Rausch V, Peccerella T, Lackner C, Yagmur E, Seitz HK, Longerich T, Mueller S. Primary liver injury and delayed resolution of liver stiffness after alcohol detoxification in heavy drinkers with the PNPLA3 variant I148M. World J Hepatol 2016; 8(35): 1547-1556
- URL: https://www.wjgnet.com/1948-5182/full/v8/i35/1547.htm
- DOI: https://dx.doi.org/10.4254/wjh.v8.i35.1547


