Copyright
©The Author(s) 2016.
World J Hepatol. Nov 28, 2016; 8(33): 1459-1465
Published online Nov 28, 2016. doi: 10.4254/wjh.v8.i33.1459
Published online Nov 28, 2016. doi: 10.4254/wjh.v8.i33.1459
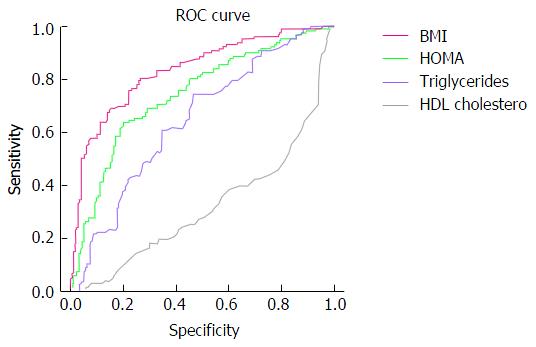
Figure 1 Receiver operating characteristic curves of body mass index, homoeostasis model insulin resistance, Triglycerides and high-density lipoprotein - cholesterol.
The performance of each measure in the prediction of NAFLD is evaluated by the receiver operating characteristic (ROC) curve. The area under the ROC curve (AUROC) and the 95%CI are used as indexes of accuracy. The optimal cutoff value is determined as the maximum sum of sensitivity and specificity. Accordingly, BMI displays the greater accuracy for predicting NAFLD in comparison of HOMA, Triglycerides and HDL-Cholesterol. The cutoffs are used as thresholds for the calculation of odds of NAFLD, as reported in Table 2. BMI: Body mass index; HOMA: Homoeostasis; HDL: High-density lipoprotein; NAFLD: Non-alcoholic-fatty-liver-disease.
- Citation: Trovato FM, Martines GF, Brischetto D, Trovato G, Catalano D. Neglected features of lifestyle: Their relevance in non-alcoholic fatty liver disease. World J Hepatol 2016; 8(33): 1459-1465
- URL: https://www.wjgnet.com/1948-5182/full/v8/i33/1459.htm
- DOI: https://dx.doi.org/10.4254/wjh.v8.i33.1459


