Copyright
©The Author(s) 2016.
World J Hepatol. Nov 18, 2016; 8(32): 1392-1401
Published online Nov 18, 2016. doi: 10.4254/wjh.v8.i32.1392
Published online Nov 18, 2016. doi: 10.4254/wjh.v8.i32.1392
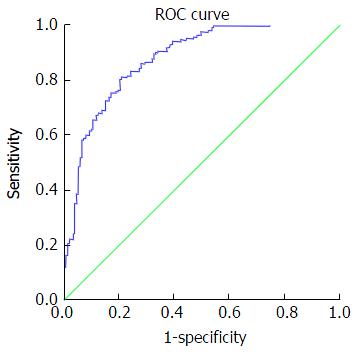
Figure 1 Receiving operating characteristic curve for discriminating mild fibrosis.
At cut off value: -0.31 or more negative: AUC 0.88, 95%CI: 0.84 -0.91, sensitivity 67.2%, specificity 6.3%, PPV 83.6%, NPV 69.5%, PLR 4.9 and NLR 0.38. AUC: Area under the curve; PPV: Positive predictive value; NPV: Negative predictive value; PLR: Positive likelihood ratio; NLR: Negative likelihood ratio; ROC: Receiving operating characteristic.
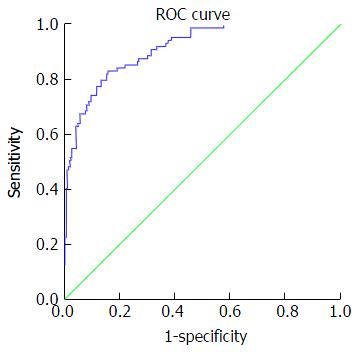
Figure 2 Receiving operating characteristic curve for discriminating advanced fibrosis.
At cut off value > 0.86: AUC 0.91, 95%CI: 0.88-0.94, sensitivity 73%, specificity 90.9%, PPV 74.4%, NPV 90.1%, PLR 8.0 and NLR 0.3. PPV: Positive predictive value; NPV: Negative predictive value; PLR: Positive likelihood ratio; NLR: Negative likelihood ratio; ROC: Receiving operating characteristic.
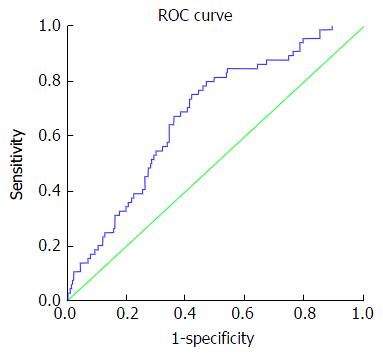
Figure 3 Receiving operating characteristic curve for discriminating moderate fibrosis.
At cut off value > -0.31 up to +0.86: AUC 0.64, 95%CI: 0.61-0.74, sensitivity 53.1%, specificity 74.1%, PPV 33%, NPV 86.8%, PLR 2.0 and NLR 0.63. AUC: Area under the curve; PPV: Positive predictive value; NPV: Negative predictive value; PLR: Positive likelihood ratio; NLR: Negative likelihood ratio; ROC: Receiving operating characteristic.
- Citation: Khattab M, Sakr MA, Fattah MA, Mousa Y, Soliman E, Breedy A, Fathi M, Gaber S, Altaweil A, Osman A, Hassouna A, Motawea I. Novel non-invasive biological predictive index for liver fibrosis in hepatitis C virus genotype 4 patients. World J Hepatol 2016; 8(32): 1392-1401
- URL: https://www.wjgnet.com/1948-5182/full/v8/i32/1392.htm
- DOI: https://dx.doi.org/10.4254/wjh.v8.i32.1392


