Copyright
©The Author(s) 2016.
World J Hepatol. Nov 18, 2016; 8(32): 1370-1383
Published online Nov 18, 2016. doi: 10.4254/wjh.v8.i32.1370
Published online Nov 18, 2016. doi: 10.4254/wjh.v8.i32.1370
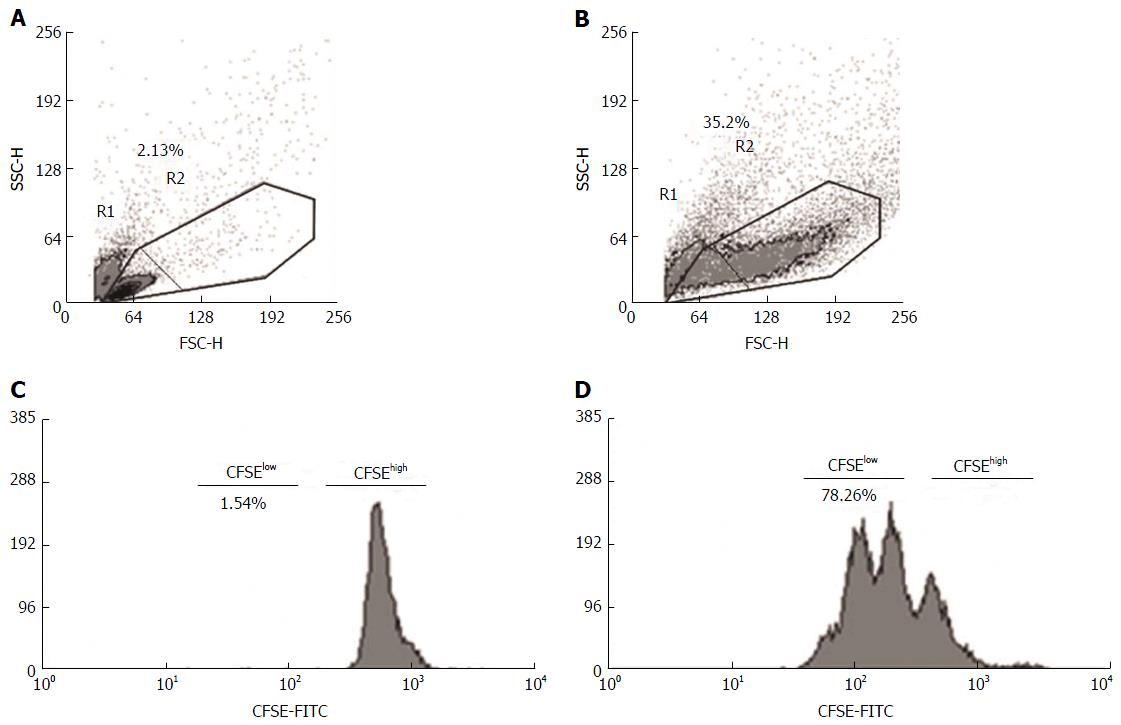
Figure 1 Flow cytometry analysis of proliferating mononuclear cells in antigenic stimulation.
Mononuclear cell populations were gated using forward (FSC) and side (SSC) scatter, and the dot plot identifies the total cells (R1 + R2), resting cells (R1) and blasts (R2). Peripheral blood mononuclear cells, either unstimulated (A and C) or stimulated with antigens (PHA, LPS or HAV Ag) (B and D), were labeled with CFSE. The histograms show the proportion of total (CFSElow + CFSEhigh), resting (CFSEhigh) and proliferating cells (CFSElow) observed using the Cyan flow cytometer and analyzed using the off-line software Summit version 6.0. CFSE: Carboxyfluorescein succinimidyl ester; PHA: Phytohemagglutinin; LPS: Lipopolysaccharide.
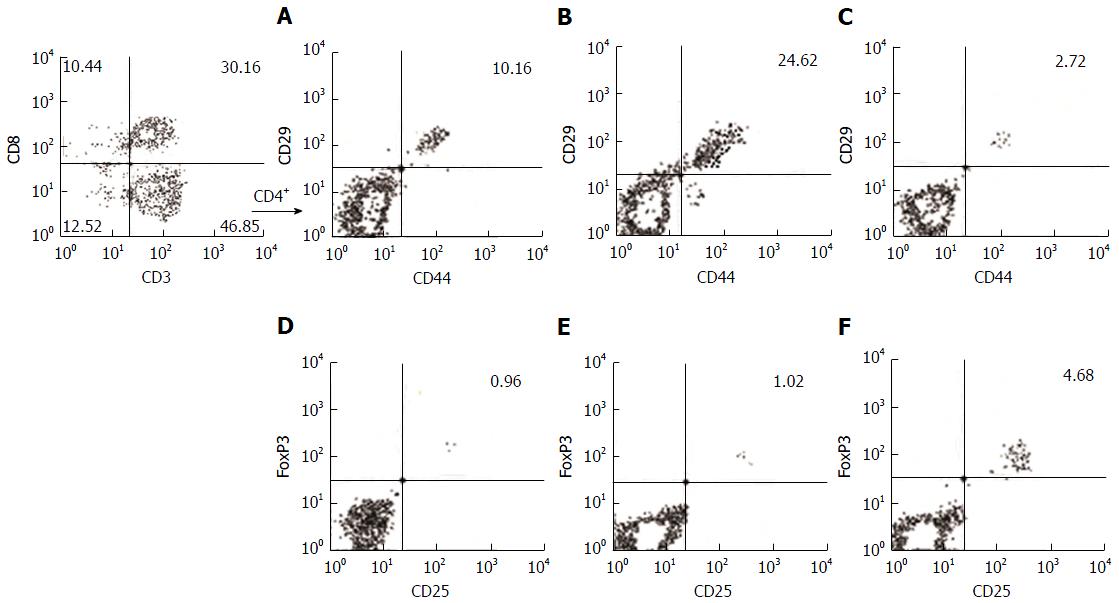
Figure 2 Hepatitis A virus Ag-activated CD4+ T cells in acute liver disease caused by hepatitis A virus.
The data from three subjects selected from our study groups were used to represent the gating strategy to select CD29+CD44+ and CD25+FoxP3+ on CD4+ cells (CD3+CD8-). Representative contour plots of the frequency of migratory T helper cells (%) in HAV Ag-activated mononuclear cells from healthy subjects (A), patients with acute hepatitis A (B), patients with acute liver failure with HAV infection (C) and in HAV Ag-activated regulatory T cells from healthy subjects (D), patients with acute hepatitis (E), and patients with acute liver failure (F). HAV: Hepatitis A virus.
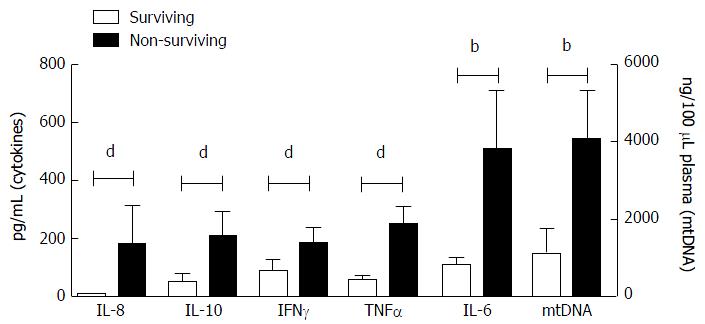
Figure 3 Differences in inflammatory cytokines (interleukin 6, 8 and 10, interferon gamma, and tumor necrosis factor α) and hepatocyte damage (mitochondrial DNA) parameters between the surviving and non-surviving patients.
bP < 0.01; dP < 0.001. IL-6: Interleukin 6; IFNγ: Interferon gamma; TNFα: Tumor necrosis factor alpha; mtDNA: Mitochondrial DNA.
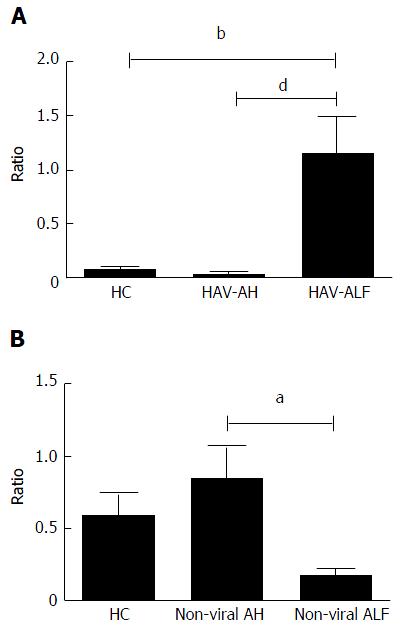
Figure 4 Imbalance between peripheral CD4+ regulatory T cells and migratory T helper cells in viral and non-viral acute hepatitis cases.
A: Comparison of the ratio of CD4+ TReg-to-Thelper in HAV-induced acute liver disease (ALF and AH) and healthy controls (HC); B: Comparison of the ratio of CD4+ TReg-to-Thelper cells in non-viral-induced acute liver disease (ALF and AH). aP < 0.05, bP < 0.01; dP < 0.001. HAV: Hepatitis A virus; AH: Acute hepatitis; ALF: Acute liver failure.
- Citation: Melgaço JG, Soriani FM, Sucupira PHF, Pinheiro LA, Vieira YR, de Oliveira JM, Lewis-Ximenez LL, Araújo CCV, Pacheco-Moreira LF, Menezes GB, Cruz OG, Vitral CL, Pinto MA. Changes in cellular proliferation and plasma products are associated with liver failure. World J Hepatol 2016; 8(32): 1370-1383
- URL: https://www.wjgnet.com/1948-5182/full/v8/i32/1370.htm
- DOI: https://dx.doi.org/10.4254/wjh.v8.i32.1370


