Copyright
©The Author(s) 2016.
World J Hepatol. Oct 28, 2016; 8(30): 1262-1268
Published online Oct 28, 2016. doi: 10.4254/wjh.v8.i30.1262
Published online Oct 28, 2016. doi: 10.4254/wjh.v8.i30.1262
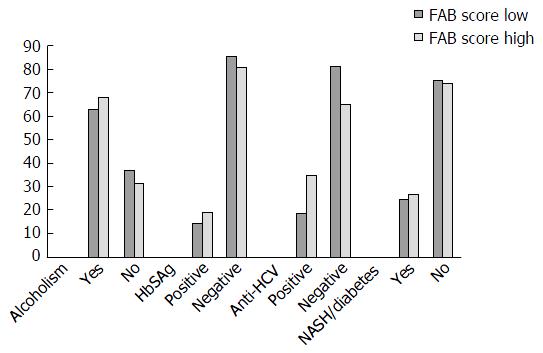
Figure 1 Percent distribution of the frontal assessment battery score, categorized as high or low, of the investigated patients (cases and controls) compared according to the cause of liver cirrhosis (Fisher’s exact test).
FAB: Frontal assessment battery; HbSAg: Hepatitis B virus surface antigen; HCV: Hepatitis C virus; NASH: Non-alcoholic steatohepatitis.
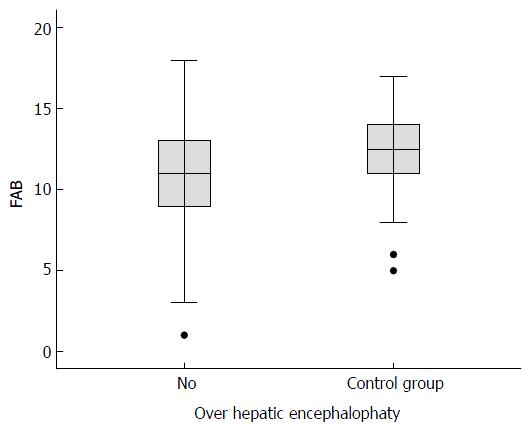
Figure 2 Median (interquartile range) total scores on the frontal assessment battery for cirrhotic patients with overt hepatic encephalopathy (n = 16) vs cirrhotic patients without overt hepatic encephalopathy (n = 71) (Student’s t-test) and the control group (non-cirrhotic patients, n = 40) vs the case group (cirrhotic patients with and without overt hepatic encephalopathy, n = 87) (Mann-Whitney test).
FAB: Frontal assessment battery.
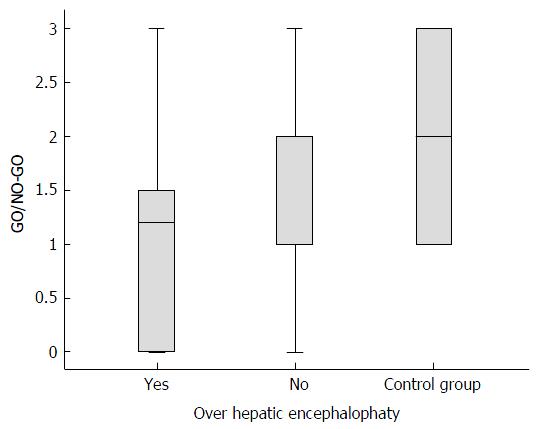
Figure 3 Median (interquartile range) total scores on the inhibitory control subtest (GO/NO-GO) for cirrhotic patients with overt hepatic encephalopathy (n = 16) vs cirrhotic patients without overt hepatic encephalopathy (n = 71) (Student’s t-test) and the control group (non-cirrhotic patients, n = 40) vs the case group (cirrhotic patients with and without overt hepatic encephalopathy, n = 87) (Mann-Whitney test).
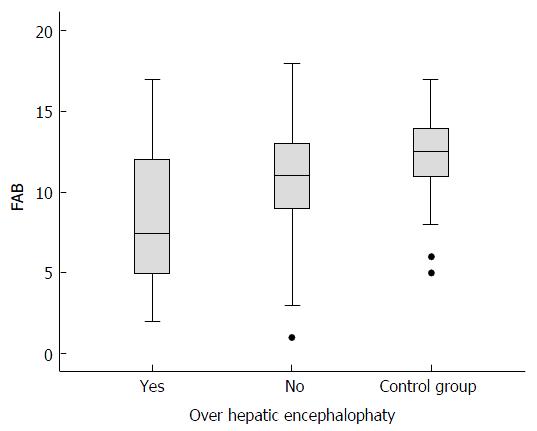
Figure 4 Median (interquartile range) total scores on the frontal assessment battery for cirrhotic patients without overt hepatic encephalopathy vs the control group (non-cirrhotic patients) (Mann-Whitney test).
FAB: Frontal assessment battery.
- Citation: de Souza KZ, Zago-Gomes MP. Frontal assessment battery: A tool for screening minimal hepatic encephalopathy? World J Hepatol 2016; 8(30): 1262-1268
- URL: https://www.wjgnet.com/1948-5182/full/v8/i30/1262.htm
- DOI: https://dx.doi.org/10.4254/wjh.v8.i30.1262


