Copyright
©The Author(s) 2016.
World J Hepatol. Jun 8, 2016; 8(16): 685-690
Published online Jun 8, 2016. doi: 10.4254/wjh.v8.i16.685
Published online Jun 8, 2016. doi: 10.4254/wjh.v8.i16.685
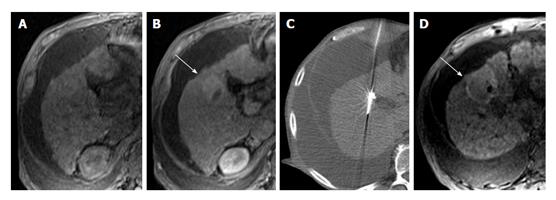
Figure 1 Treatment-related signal alterations on T1-weighted images.
A 59-year-old man with HCV cirrhosis and a segment V LI-RADS 5B lesion measuring up to 3.6 cm. Fat-saturated T1-weighted precontrast (A) and arterial-phase (B) images demonstrate a 3.6 cm enhancing focus of viable tumor (B, arrow) within an area previously treated with TACE. Mass could not be visualized upon selective angiography so repeat TACE was not performed. Non-contrast CT from a radiofrequency ablation procedure (C) demonstrates an electrode positioned within the tumor. One month later a fat-saturated T1-weighted precontrast image (D) demonstrates peripheral high signal related to hemorrhage from coagulative necrosis (D, arrow). LI-RADS: Liver imaging reporting and data system; TACE: Transarterial chemoembolization; HCV: Hepatitis C virus.
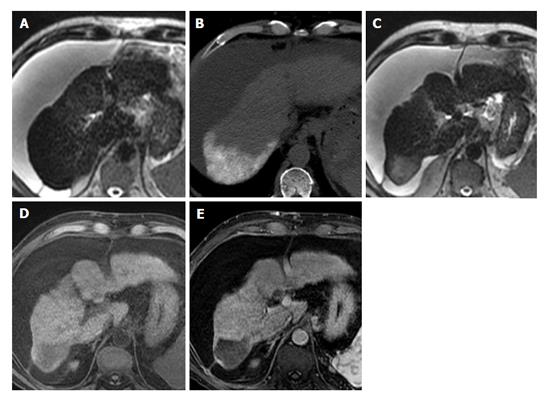
Figure 2 Treatment-related signal alterations on T2-weighted images.
A 63-year-old man with HCV/EtOH cirrhosis and a segment VII LI-RADS 5B lesion measuring 2.4 cm × 1.8 cm. T2-weighted image (A) just superior to the segment VI lesion before treatment demonstrates a cirrhotic liver with homogeneous low signal intensity. Non-contrast CT (B) performed immediately after a TACE procedure shows high attenuation Lipiodol® in segment VII confirming that the appropriate segment was treated. T2-weighted image (C) from an MRI performed one month later shows high signal intensity in the area that was treated due to fibrotic change. Precontrast (D) and arterial-phase images (E) from that exam demonstrate that the treated area is completely necrotic. LI-RADS: Liver imaging reporting and data system; TACE: Transarterial chemoembolization; HCV: Hepatitis C virus; CT: Computed tomography; MRI: Magnetic resonance imaging.
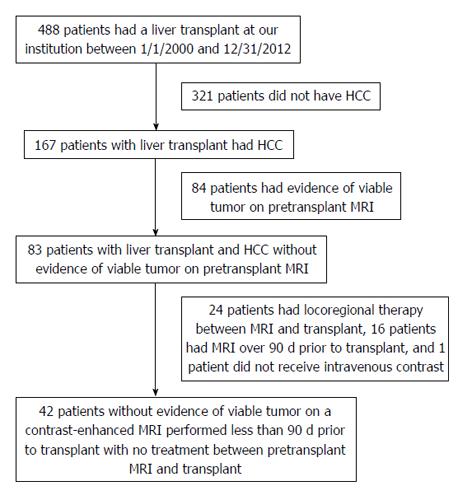
Figure 3 Patient accrual flowchart.
HCC: Hepatocellular carcinoma; MRI: Magnetic resonance imaging.
- Citation: Becker-Weidman D, Civan JM, Deshmukh SP, Roth CG, Herrine SK, Parker L, Mitchell DG. Hepatocellular carcinoma after locoregional therapy: Magnetic resonance imaging findings in falsely negative exams. World J Hepatol 2016; 8(16): 685-690
- URL: https://www.wjgnet.com/1948-5182/full/v8/i16/685.htm
- DOI: https://dx.doi.org/10.4254/wjh.v8.i16.685


