Copyright
©The Author(s) 2015.
World J Hepatol. Dec 28, 2015; 7(30): 2940-2954
Published online Dec 28, 2015. doi: 10.4254/wjh.v7.i30.2940
Published online Dec 28, 2015. doi: 10.4254/wjh.v7.i30.2940
Figure 1 Bland-Altman analysis and scatter graph of fat mass percentages obtained from 50 cirrhotic patients with hepatic encephalopathy.
Despite the correlation obtained between the two methods, the differences were also significant. DEXA: Dual-energy X-ray absorptiometry; BIA: Bioelectrical impedance analysis.
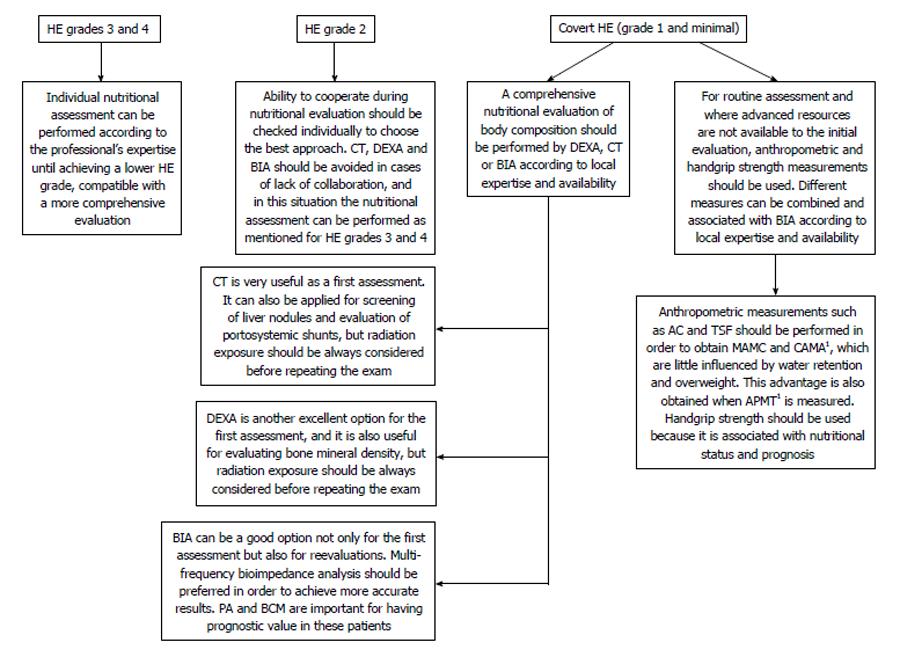
Figure 2 Proposal for choosing the best approaches during nutritional assessment of cirrhotic patients with hepatic encephalopathy.
1APMT and CAMA are also associated with nutritional status in many conditions, but were not well evaluated in patients with cirrhosis and HE. AC: Arm circumference; APMT: Adductor pollicis muscle thickness; BCM: Body cell mass; BIA: Bioelectrical impedance analysis; CAMA: Corrected arm muscle area; CT: Computed tomography scan; DEXA: Dual-energy X-ray absorptiometry; HE: Hepatic encephalopathy; MAMC: Mid-arm muscle circumference; PA: Phase angle; TSF: Triceps skinfold.
- Citation: Romeiro FG, Augusti L. Nutritional assessment in cirrhotic patients with hepatic encephalopathy. World J Hepatol 2015; 7(30): 2940-2954
- URL: https://www.wjgnet.com/1948-5182/full/v7/i30/2940.htm
- DOI: https://dx.doi.org/10.4254/wjh.v7.i30.2940


