Copyright
©The Author(s) 2015.
World J Hepatol. Mar 27, 2015; 7(3): 507-520
Published online Mar 27, 2015. doi: 10.4254/wjh.v7.i3.507
Published online Mar 27, 2015. doi: 10.4254/wjh.v7.i3.507
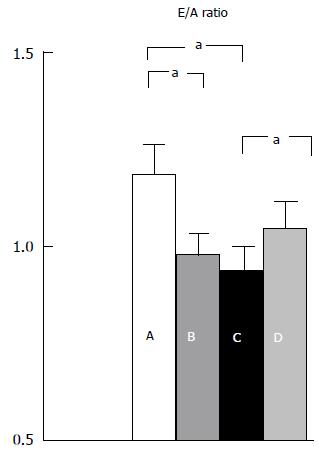
Figure 1 Left ventricular diastolic function in normal subjects (A); cirrhosis (B); cirrhosis with tense ascites (C); cirrhosis with ascites after paracentesis (D).
aP < 0.05, E/A ratio: (early peak: late peak filling velocities). Ratio declines with worsening LVDD. Pozzi et al[24].
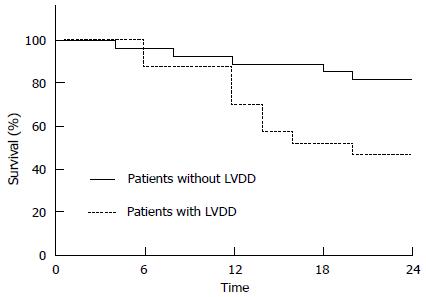
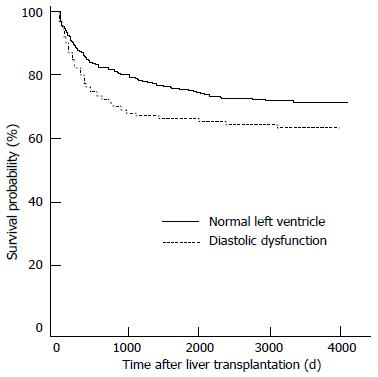
Figure 2 Differences in survival of patients according to the presence of left ventricular diastolic dysfunction.
LVDD: Left ventricular diastolic dysfunction. Karagiannakis et al[22].
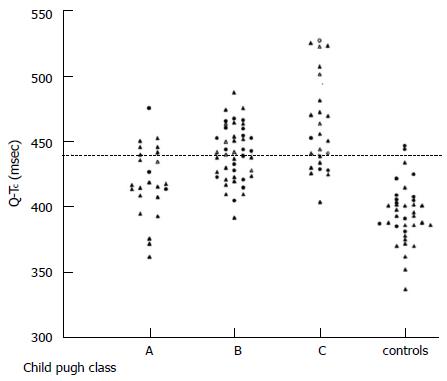
Figure 3 Individual values of QTc interval in patients with cirrhosis (divided according to Child-Pugh classes) and controls.
Bernardi et al[26].
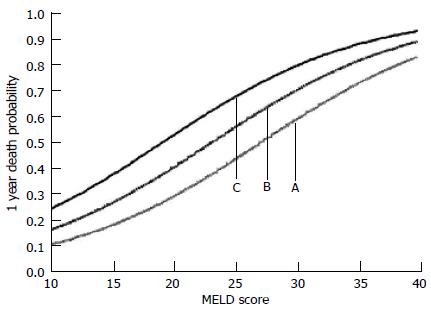
Figure 4 Estimated 1 year probability of dying as a function of: (A) MELD score alone; (B) MELD score and hs-TnT of 4-8 ng/L; and (C) MELD score and hs-TnT of > 8 ng/L.
Taken from Wiese et al[64].
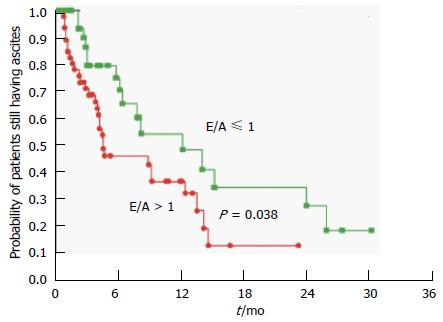
Figure 5 Probability of patients still having ascites after transjugular intrahepatic portosystemic shunts insertion in the group with diastolic dysfunction (E/A ≤ 1) and the group without (E/A > 1).
Rabie et al[45].
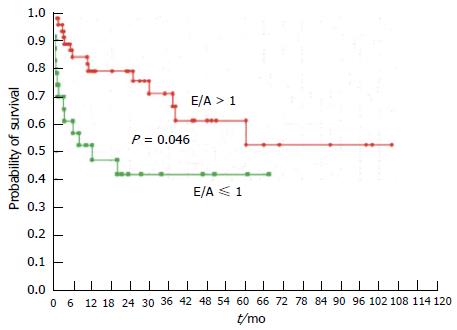
Figure 6 Probability of survival in patients with (E/A ≤ 1) or without (E/A > 1) diastolic dysfunction.
Rabie et al[45].
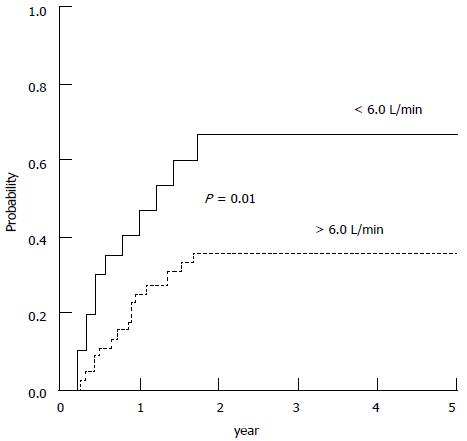
Figure 7 Probability of developing hepatorenal syndrome during follow-up in patients with baseline cardiac output higher and lower than 6 L/min.
Ruiz-del-Arbol et al[71].
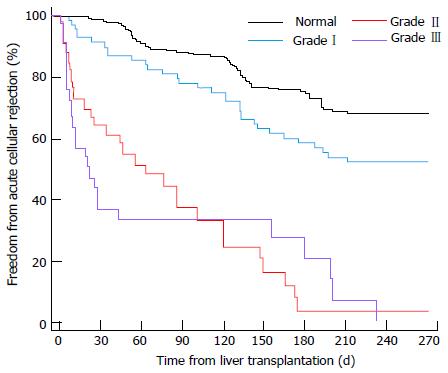
Figure 8 Time to acute rejection for various grades of left ventricular diastolic dysfunction.
Mittal et al[74].
Figure 9 Survival analysis for patients with left ventricular diastolic dysfunction vs patients without.
Mittal et al[74].
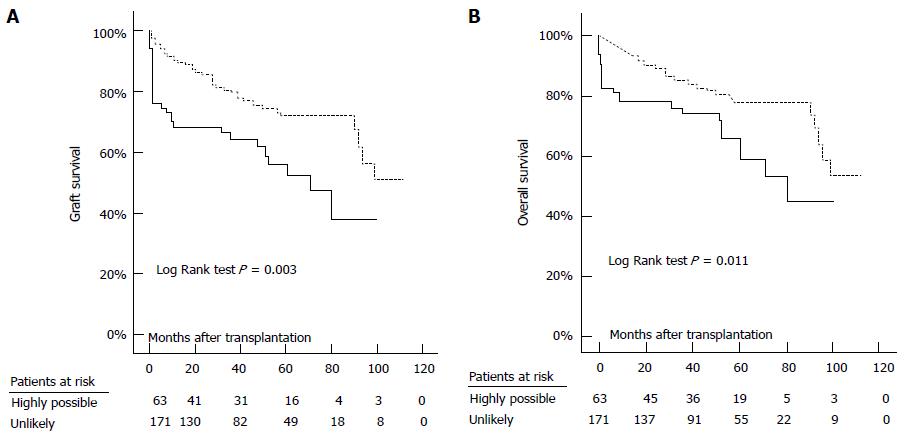
Figure 10 Graft (A) and overall (B) survival in patients with highly possible (continuous line) and those with unlikely (dashed line) peri-transplant heart failure.
Josefsson et al[25].
- Citation: Rahman S, Mallett SV. Cirrhotic cardiomyopathy: Implications for the perioperative management of liver transplant patients. World J Hepatol 2015; 7(3): 507-520
- URL: https://www.wjgnet.com/1948-5182/full/v7/i3/507.htm
- DOI: https://dx.doi.org/10.4254/wjh.v7.i3.507


