Copyright
©The Author(s) 2015.
World J Hepatol. Nov 18, 2015; 7(26): 2688-2695
Published online Nov 18, 2015. doi: 10.4254/wjh.v7.i26.2688
Published online Nov 18, 2015. doi: 10.4254/wjh.v7.i26.2688
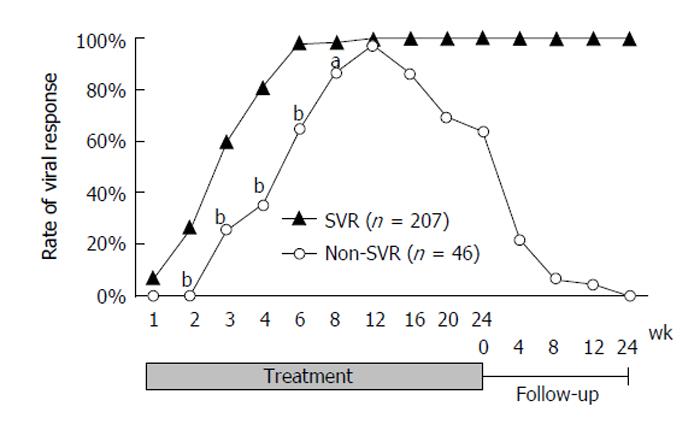
Figure 1 Transition of the virological response rate by sustained virological response status.
The virological response (VR) rates were significantly higher in the sustained VR (SVR) than the non-SVR group between weeks 2 and 8 (26.9% vs 0.0%, 59.8% vs 25.6%, 81.6% vs 35.0%, 98.5% vs 65.0% and 98.5% vs 86.5% at weeks 2, 3, 4, 6 and 8, respectively. P < 0.0001 at weeks 2, 3, 4 and 6. P = 0.0027 at week 8), although there was no statistical difference at week 1 or 12 (7.3% vs 0.0% and 100% vs 97.3%, respectively). aP < 0.01, bP < 0.0001, vs SVR group.
- Citation: Hiramine S, Furusyo N, Ogawa E, Nakamuta M, Kajiwara E, Nomura H, Dohmen K, Takahashi K, Satoh T, Azuma K, Kawano A, Koyanagi T, Kotoh K, Shimoda S, Hayashi J. Importance of virological response in the early stage of telaprevir-based triple therapy for hepatitis C. World J Hepatol 2015; 7(26): 2688-2695
- URL: https://www.wjgnet.com/1948-5182/full/v7/i26/2688.htm
- DOI: https://dx.doi.org/10.4254/wjh.v7.i26.2688


