Copyright
©2013 Baishideng Publishing Group Co.
World J Hepatol. Dec 27, 2013; 5(12): 685-691
Published online Dec 27, 2013. doi: 10.4254/wjh.v5.i12.685
Published online Dec 27, 2013. doi: 10.4254/wjh.v5.i12.685
Figure 1 Overall survival of 33 patients with hepatorenal syndrome.
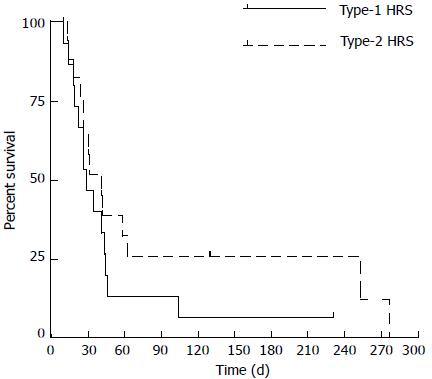
Figure 2 Overall survival of patients according to type-1 and type-2 hepatorenal syndrome (P = 0.
2 by Log-rank test). HRS: Hepatorenal syndrome.
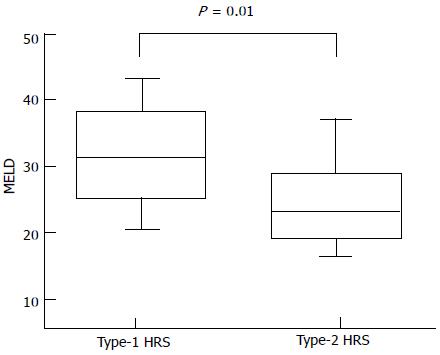
Figure 3 Box plot of distribution of model for end-stage liver disease scores in patients with type-1 and type-2 hepatorenal syndrome at diagnosis.
HRS: Hepatorenal syndrome; MELD: Model for end stage liver disease.
- Citation: Licata A, Maida M, Bonaccorso A, Macaluso FS, Cappello M, Craxì A, Almasio PL. Clinical course and prognostic factors of hepatorenal syndrome: A retrospective single-center cohort study. World J Hepatol 2013; 5(12): 685-691
- URL: https://www.wjgnet.com/1948-5182/full/v5/i12/685.htm
- DOI: https://dx.doi.org/10.4254/wjh.v5.i12.685


