Copyright
©2012 Baishideng Publishing Group Co.
World J Hepatol. Jul 27, 2012; 4(7): 209-217
Published online Jul 27, 2012. doi: 10.4254/wjh.v4.i7.209
Published online Jul 27, 2012. doi: 10.4254/wjh.v4.i7.209
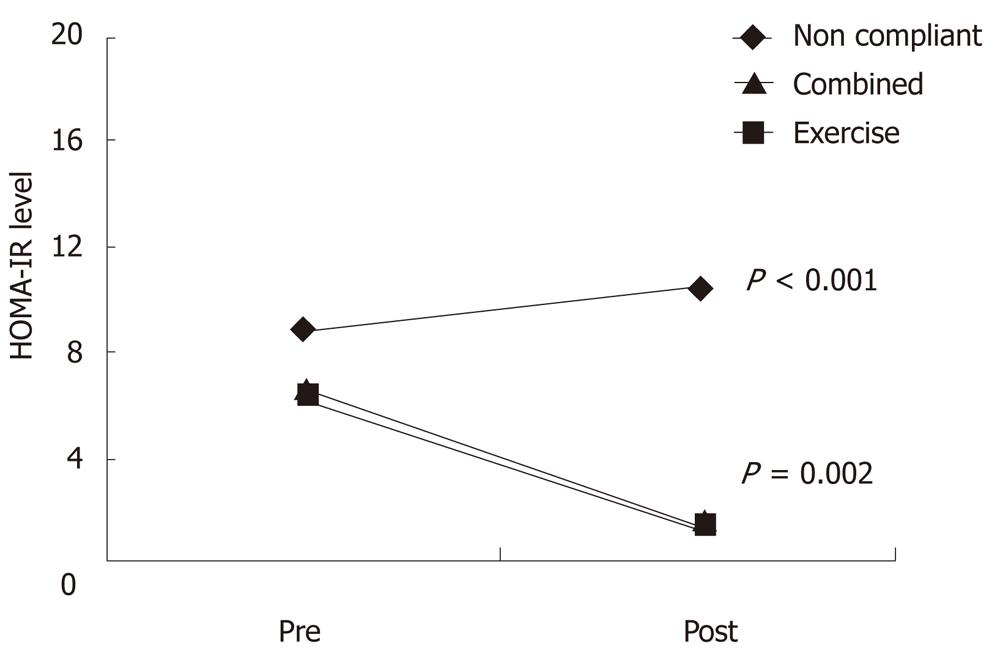
Figure 1 Diagrammatic representation of homeostasis model assessment-estimated insulin resistance levels of all the patients in the 3 groups before and after exercise.
HOMA-IR: Homeostasis model assessment-estimated insulin resistance.
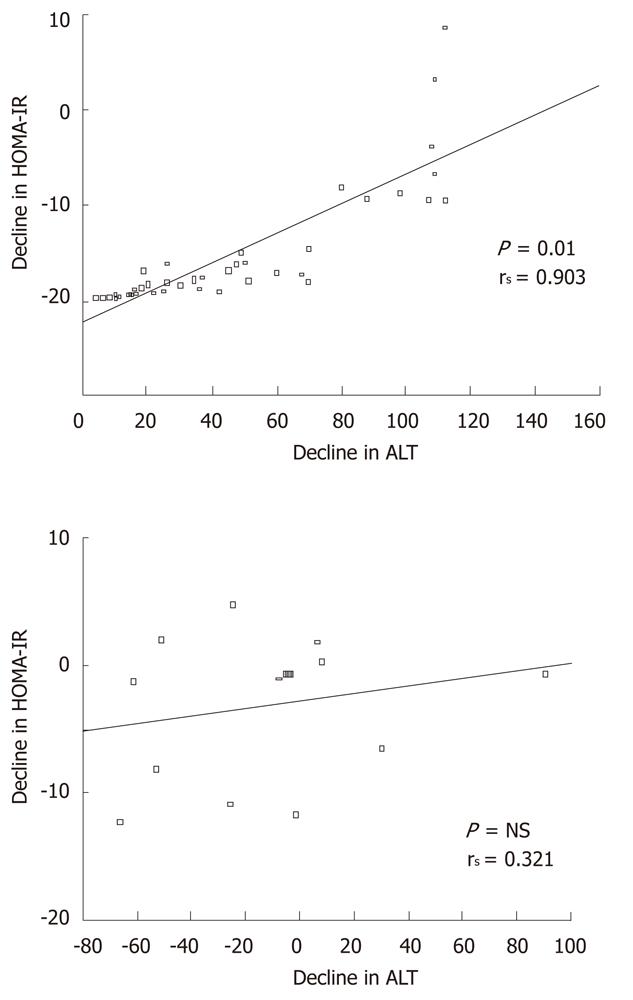
Figure 2 Correlation of decline in homeostasis model assessment-estimated insulin resistance levels to serum alanine aminotransferase in the compliant and non-compliant group using Spearman’s test.
NS: Not significant.
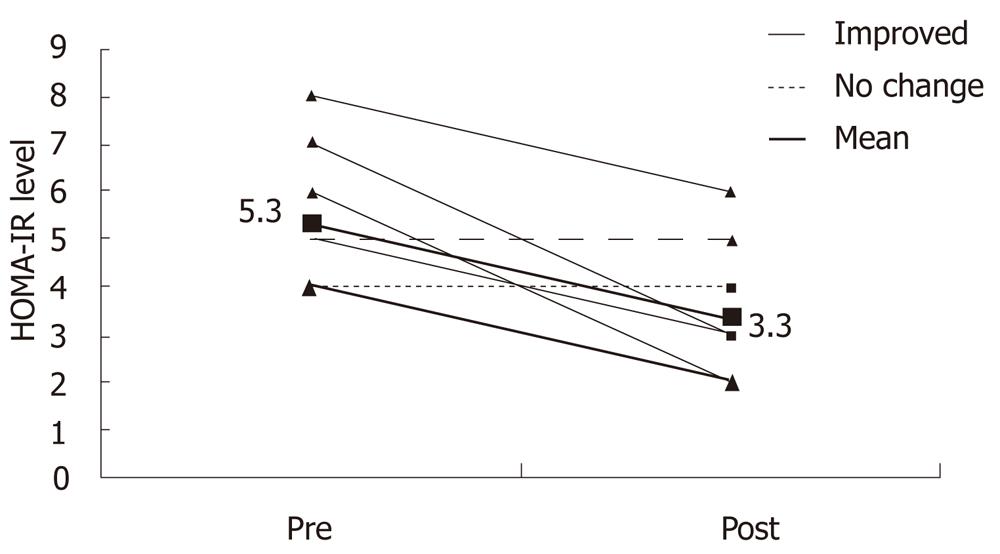
Figure 3 Change in nonalcoholic steatohepatitis score pre and post intervention (n = 8).
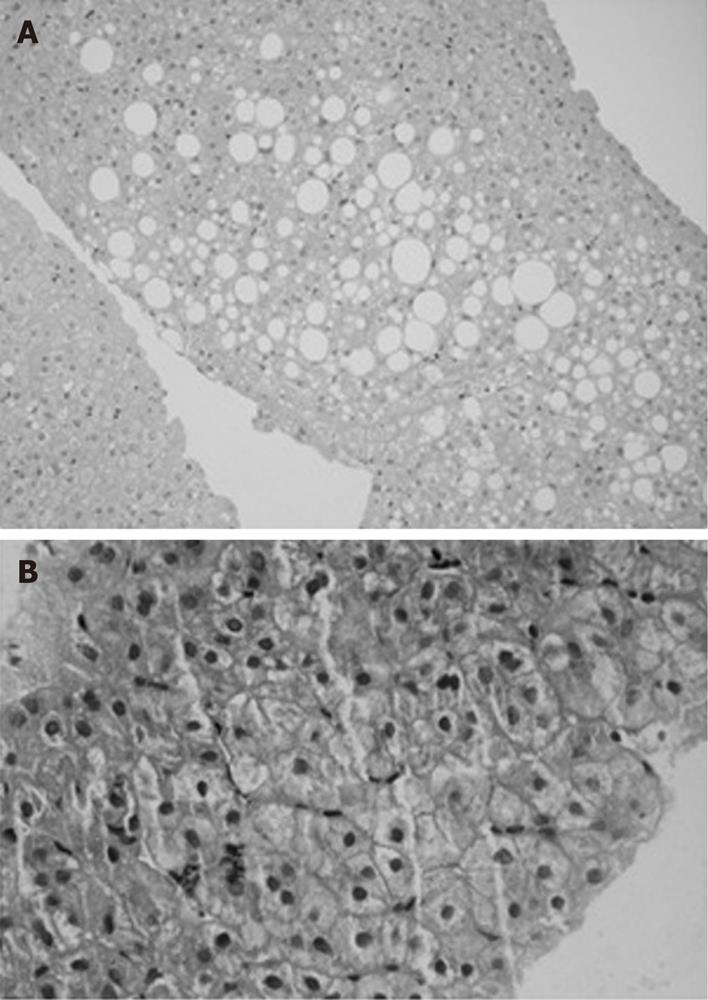
Figure 4 Liver histology pre (A) and post (B) intervention in compliant group.
- Citation: Bhat G, Baba CS, Pandey A, Kumari N, Choudhuri G. Life style modification improves insulin resistance and liver histology in patients with non-alcoholic fatty liver disease. World J Hepatol 2012; 4(7): 209-217
- URL: https://www.wjgnet.com/1948-5182/full/v4/i7/209.htm
- DOI: https://dx.doi.org/10.4254/wjh.v4.i7.209


