Copyright
©2012 Baishideng Publishing Group Co.
World J Hepatol. May 27, 2012; 4(5): 176-183
Published online May 27, 2012. doi: 10.4254/wjh.v4.i5.176
Published online May 27, 2012. doi: 10.4254/wjh.v4.i5.176
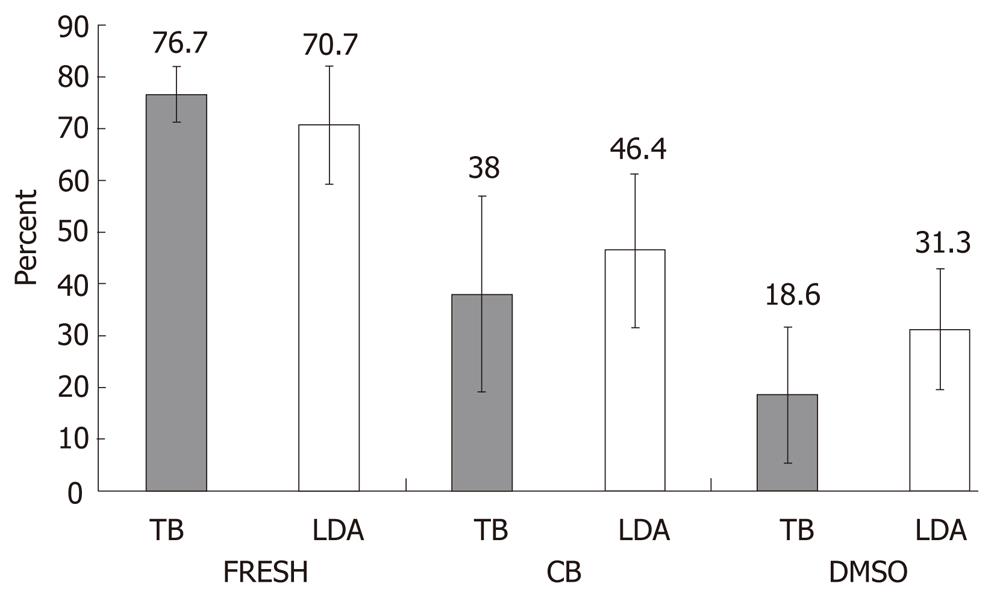
Figure 1 Hepatocyte viability before and after freezing.
Viability in the three groups: fresh hepatocytes (FRESH) and hepatocytes frozen using either the STEM-CELLBANKER protocol (CB) or the standard dimethylsulfoxide in the University-of-Wisconsin solution (DMSO-UW) protocol using both the trypan blue exclusion and the Live/Dead Assay (LDA) methods. There was a significant difference in viability between CB and DMSO using the two-way analysis of variance test (P < 0.05). TB: Trypan blue.
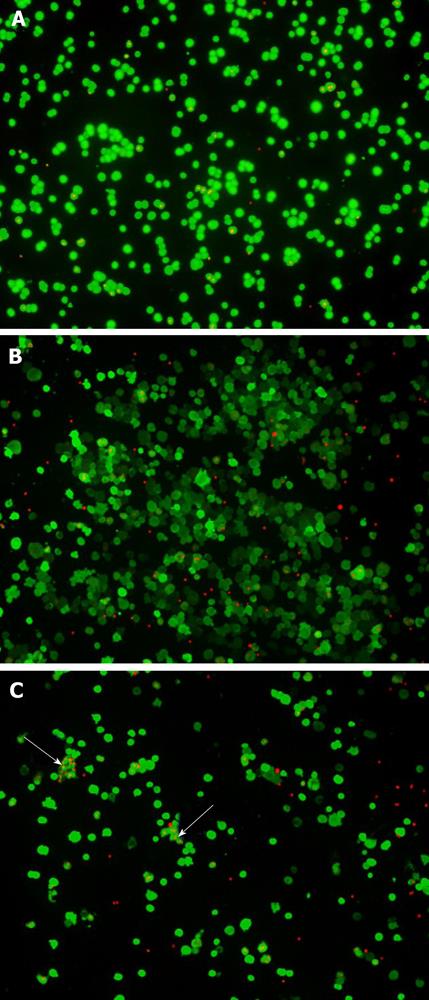
Figure 2 LIVE/DEAD Assay for hepatocytes.
Fluorescence staining of the live and dead hepatocytes in fresh hepatocytes (A) and freshly thawed hepatocytes cryopreserved using either the STEM-CELLBANKER protocol (B) or the dimethylsulfoxide in the University-of-Wisconsin solution (DMSO-UW) protocol (C). Live hepatocytes showed ‘‘green’’ fluorescence in their cytoplasm upon their active uptake and conversion of calcein AM to calcein. Ethidium-1 entered dead hepatocytes through their damaged cell membranes and bound nucleic acids showing ‘‘red’’ fluorescence in their nuclei. It was not uncommon to see hepatocytes cryopreserved in DMSO sticking together in clumps (arrows).
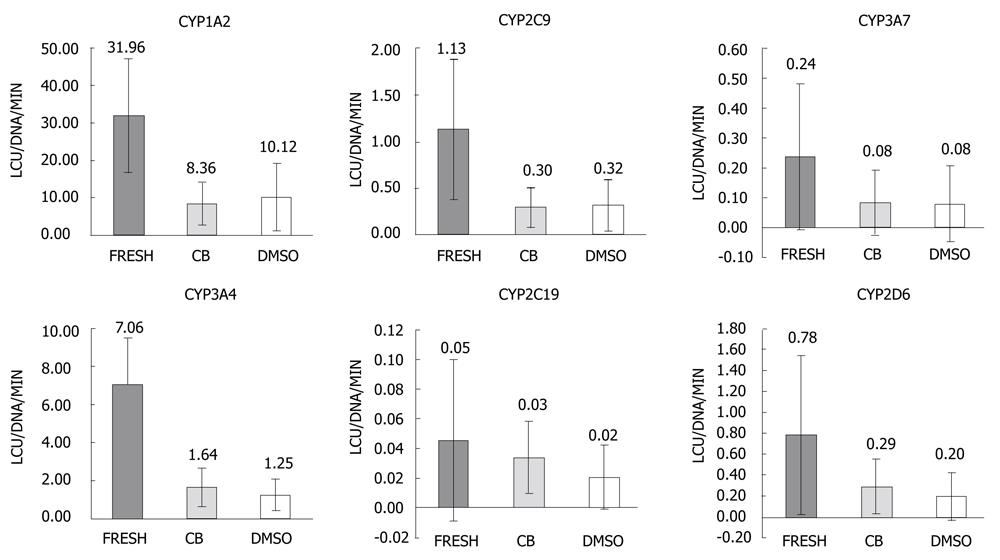
Figure 3 Hepatocyte functionality before and after freezing.
Activity of the major cytochrome P450 enzymes; CYP1A2, CYP2C9, CYP3A7, CYP3A4, CYP2C19, CYP2D6 for the fresh hepatocytes (FRESH) compared to hepatocytes cryopreserved using either the STEM-CELLBANKER protocol (CB) or the standard dimethylsulfoxide in the University-of-Wisconsin solution protocol. The standard deviation exceeded the mean in many cases, illustrating the high within-groups variability. Data is presented as luminescence (LCU) per minute per DNA in nanograms. CYPs: Cytochrome P450 enzymes.
- Citation: Saliem M, Holm F, Tengzelius RB, Jorns C, Nilsson LM, Ericzon BG, Ellis E, Hovatta O. Improved cryopreservation of human hepatocytes using a new xeno free cryoprotectant solution. World J Hepatol 2012; 4(5): 176-183
- URL: https://www.wjgnet.com/1948-5182/full/v4/i5/176.htm
- DOI: https://dx.doi.org/10.4254/wjh.v4.i5.176


