Copyright
©2012 Baishideng Publishing Group Co.
World J Hepatol. Oct 27, 2012; 4(10): 274-283
Published online Oct 27, 2012. doi: 10.4254/wjh.v4.i10.274
Published online Oct 27, 2012. doi: 10.4254/wjh.v4.i10.274
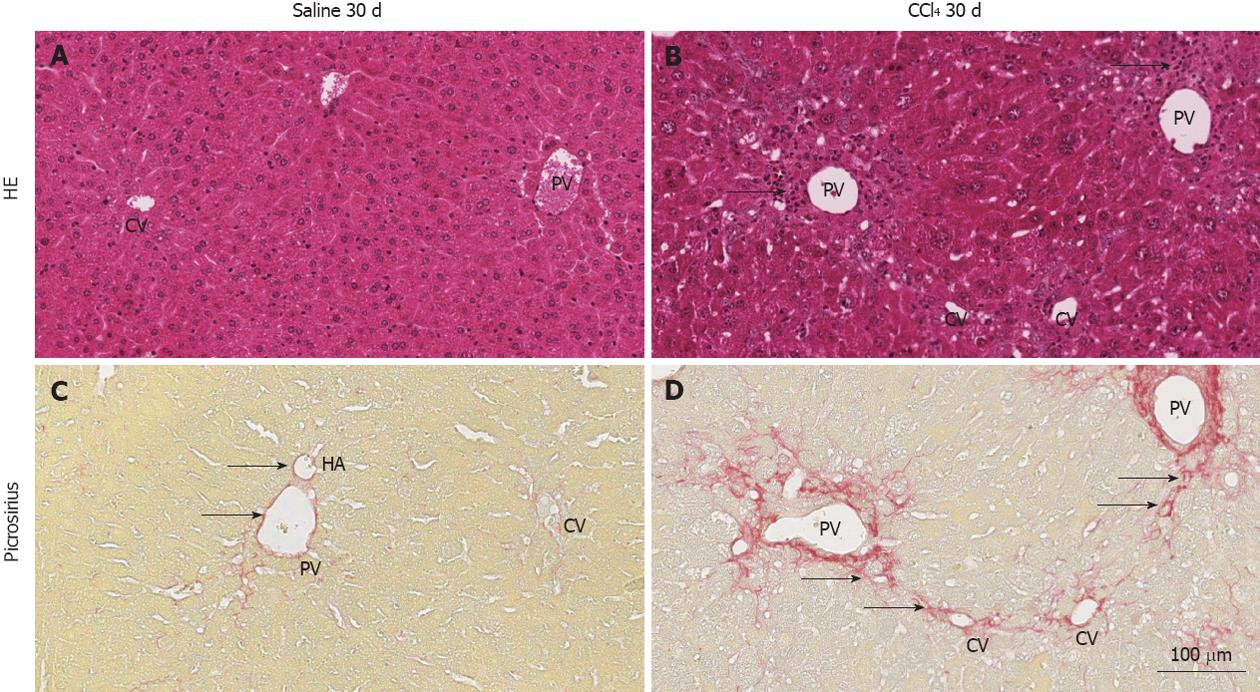
Figure 1 Representative images of histological sections of livers of normal and chimeric animals stained with hematoxylin and eosin or picrosirius.
A: hematoxylin and eosin (HE): shows the central vein (CV), portal vein (PV) and regular hepatocyte plates, representing normal architecture of the liver; B: The PV and CV present inflammatory infiltrate (arrows) due to injury of hepatocytes in this region by CCl4; C: Picrosirius: collagen (red) is present only in the perivascular region of the PV, hepatic artery (HA) (arrows) and lightly present surrounding the VC; D: a high deposition of collagen surrounding the PV and radiating fibers to the CV, indicating initiation of collagen septa (arrows) formation 30 d after injury induction.
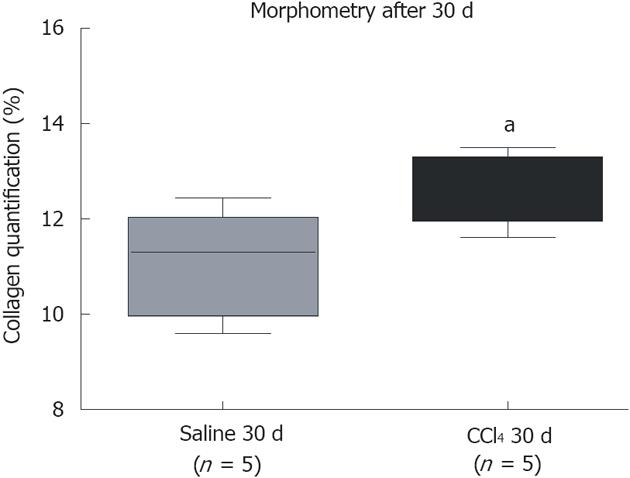
Figure 2 Quantification of collagen by morphometric analysis.
A significant increase in collagen between the group that received CCl4 compared to the group that received saline. The groups are represented by box–whisker diagrams in which the values in the boxes represent the medians of collagen content (n = 5) and the bars the 25%-75% range. The Mann-Whitney post-test was used to test for significance. aP = 0.0329 vs the Saline 30 d group.
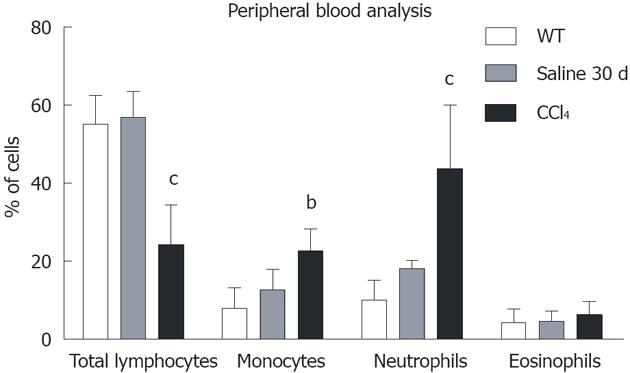
Figure 3 Graphical analysis of subpopulations of peripheral blood of the WT, Saline 30 d and CCl4 30 d groups by flow cytometry.
Only the animals in CCl4 30 d group showed significant differences from wild-type (WT): Total lymphocytes (WT = 55.2% ± 7.4%; Saline 30 d = 56.9% ± 6.6%; CCl4 30 d = 24.3% ± 10.2%); Monocytes (WT = 8.1% ± 5.3%; Saline 30 d = 12.7% ± 5.3%; CCl4 30 d = 22.7% ± 5.6%); Neutrophils (WT = 10.1% ± 5.0%; Saline 30 d = 18.2% ± 2.1%, CCl4 30 d = 43.8% ± 16.3%). One-way analysis of variance (ANOVA) followed by Dunnett’s test for multiple comparisons was used. bP < 0.01, cP < 0.001 vs WT.
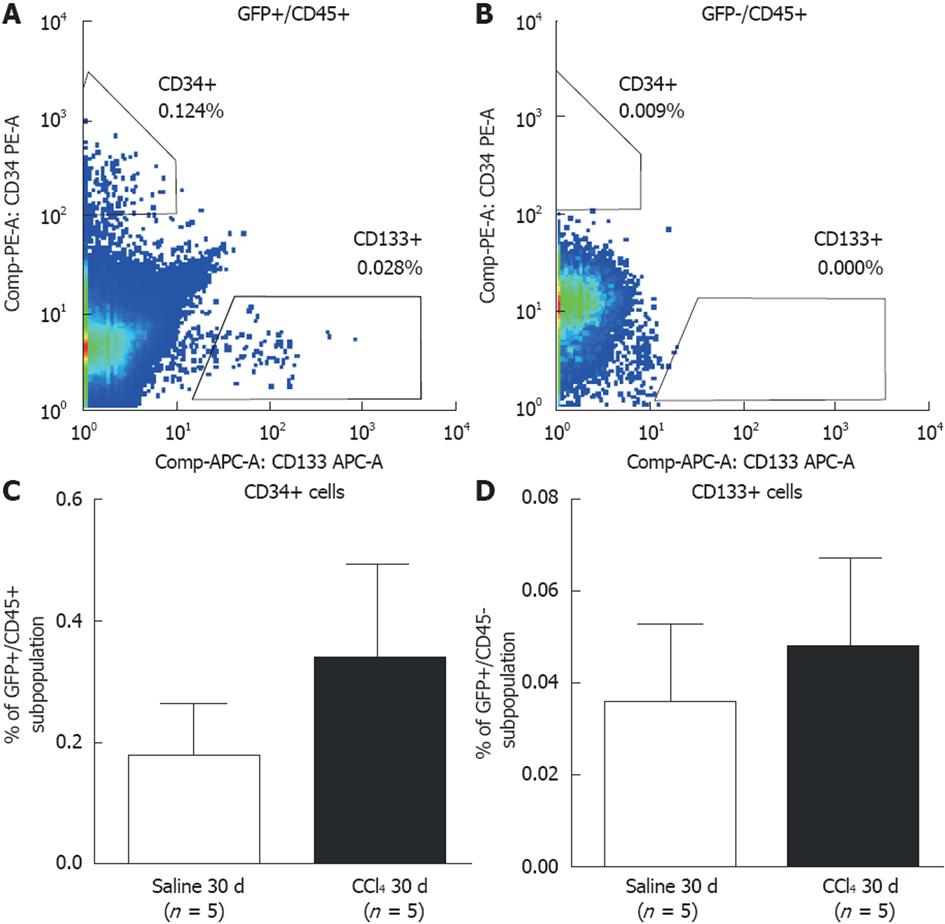
Figure 4 Flow cytometric analysis of subpopulations of hematopoietic and endothelial progenitor cells in bone marrow of chimeric mice.
A: Representative results showing green fluorescent protein (GFP)+ precursor cells in both the Saline 30 d and CCl4 30 d groups (side bar = ancestry gating). CD45+/CD34+ (hematopoietic) and CD45+/CD133+ (endothelial) cells were identified; B: Representative results showing GFP-subpopulation precursor cells in the Saline 30 d and CCl4 30 d groups (side bar = ancestry gating). No progenitor cells were found in the GFP-subpopulation; C: Graphic of the percentage of GFP+/CD45+/CD34+ cells (hematopoietic progenitor cells); D: GFP+/CD45+/CD133+ (endothelial progenitor cells) in peripheral blood of the Saline 30 d and CCl4 30 d groups. No significant difference was detected between the groups by Student’s t test.
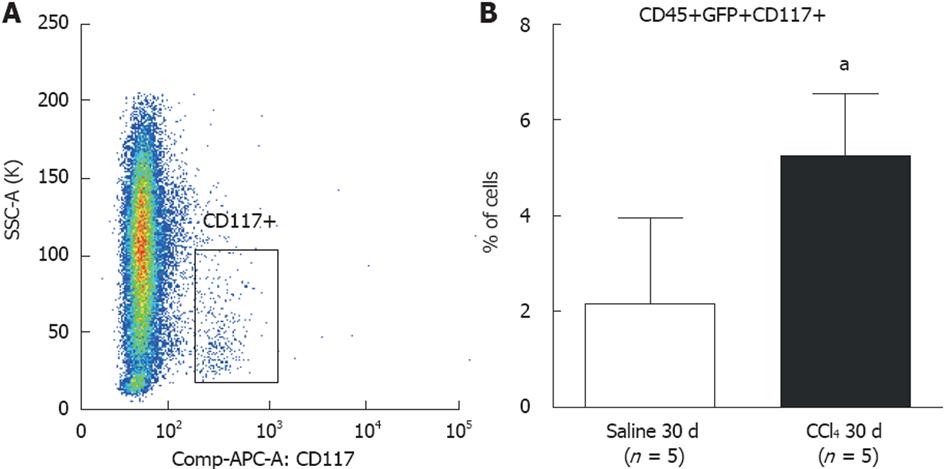
Figure 5 Flow cytometric analysis of subpopulations of CD117+ precursor cells in bone marrow of chimeric mice.
A: Dot-plot analysis of CD117+ cells found in bone marrow. Side-bar dot-plots represent ancestry gating; B: A significantly greater population of CD117+ cells was observed in liver tissue from the CCl4 30 d group compared to the Saline 30 d group (30 d saline = 2.6 ± 1.3%; CCl4 30 d = 5.6 ± 1.8%) (aP = 0.0142). GFP: green fluorescent protein.
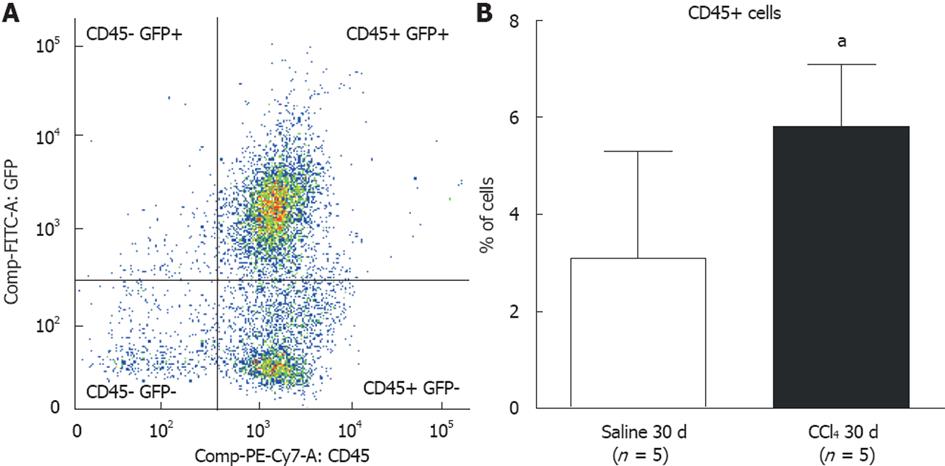
Figure 6 Flow cytometric analysis of bone marrow subpopulations in the liver of chimeric mice.
A: Dot-plot analysis of cell populations in the liver; B: A significantly greater population of CD45+ cells was observed in liver tissue of animals from the CCl4 30 d group compared to the Saline 30 d group (30 d saline = 3.1% ± 2.2%; CCl4 30 d = 5.8% ± 1.3%) (aP = 0.0458). GFP: green fluorescent protein.
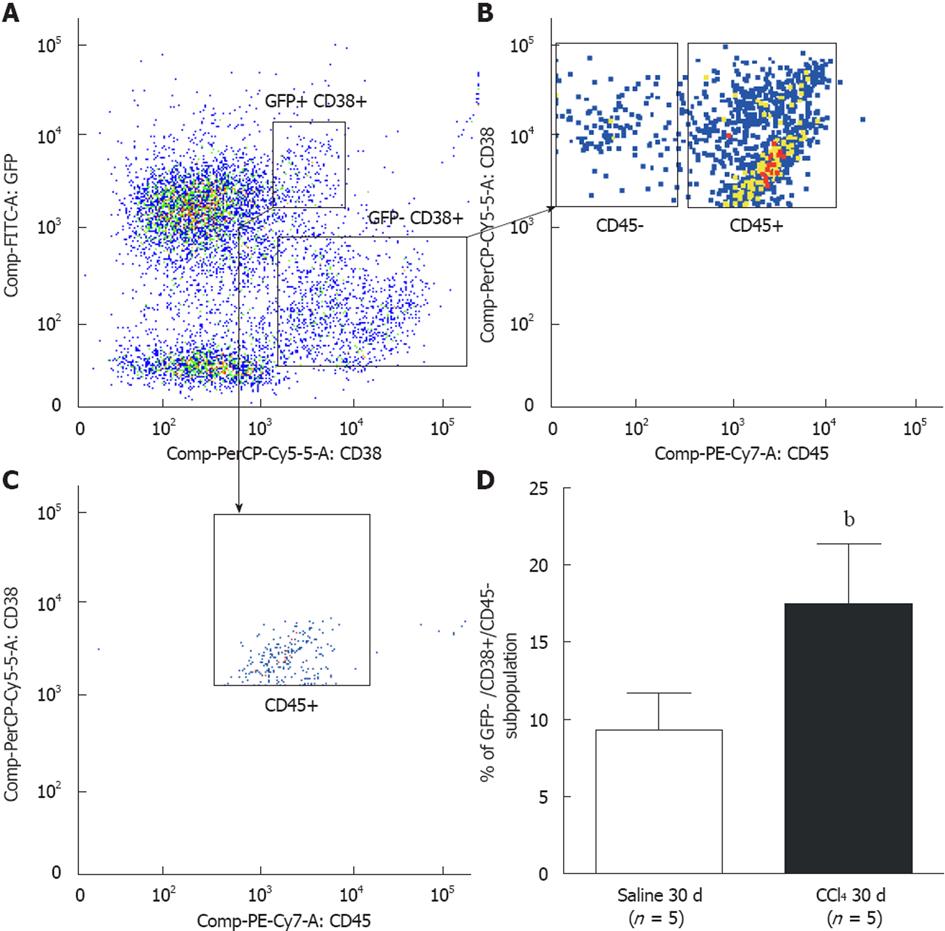
Figure 7 Representative analysis of CD38+ hepatic stellate cell subpopulations by flow cytometry.
A: Two CD38+ subpopulations were observed: green fluorescent protein (GFP)+/CD38+ and GFP-/CD38+; B: Two subpopulations among GFP-/CD38+ cells were observed: GFP-/CD38+/CD45+ that identifies B lymphocytes, and GFP-/CD38+/CD45 that identifies hepatic stellate cells; C: Analysis of GFP+/CD38+ cells showed that all cells were of hematopoietic origin (CD45+); D: A significant increase of cells GFP/CD38+/CD45- was observed in liver tissue of the CCl4 30 d group when compared to the Saline 30 d group (Saline 30 d = 9.3% ± 2.4%; CCl4 30 d = 17.5% ± 3.9%, bP = 0.004). The statistical test used was Student’s t test.
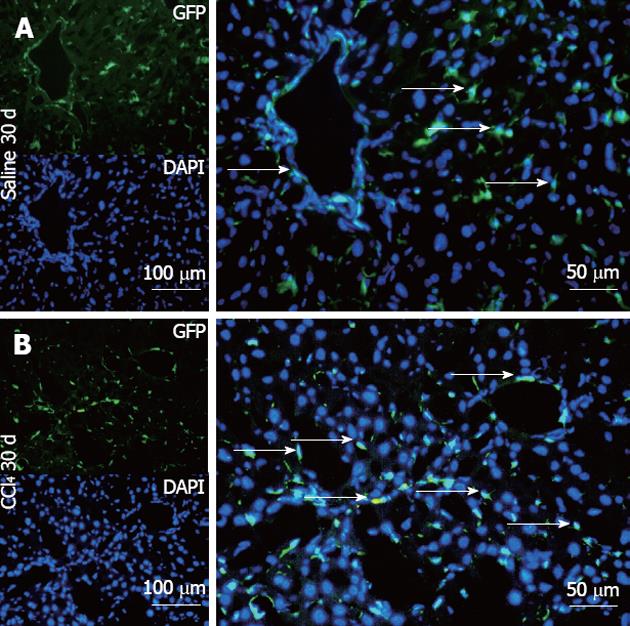
Figure 8 Representative direct fluorescence images of hepatic sections of chimeric animals after transplantation.
Liver samples of chimeric animals after transplantation of green fluorescent protein (GFP)+ bone marrow- mononuclear cell, chimeric animals that received saline (Saline 30 d) and chimeric animals that received CCl4 (CCl4 30 d). In panel A (Salina 30 d), the GFP channel shows the presence of green fluorescence; in the 4, 6-diamino-2-phenylindole panel, nuclei are stained blue in the same field above; the merge panel superposes the two images, where GFP+ cells (arrows) can be seen distributed in major hepatic parenchyma and with fusiform morphology. In panel B (CCl4 30 d), GFP+ cells can be seen with greater distribution in the hepatic parenchyma, some fusiform morphology (white arrows) and others with rounded morphology. DAPI: 4,6-diamino-2-phenyl indole.
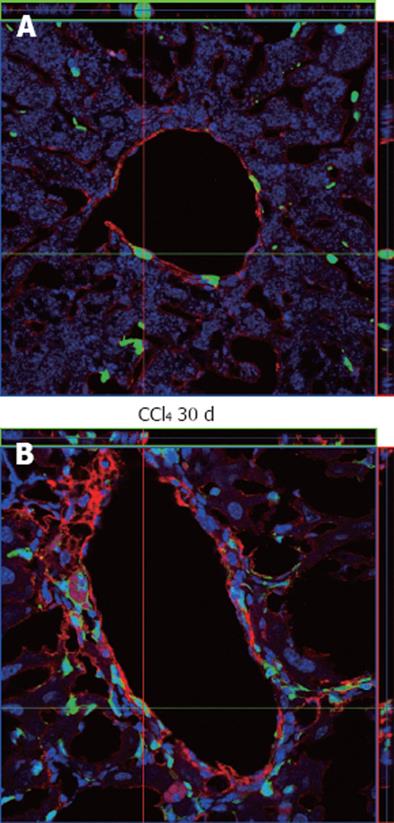
Figure 9 Immunostaining analysis of α-smooth muscle actin in liver samples from chimeric animals by confocal microscopy.
A: α-smooth muscle actin (α-SMA)+ cells in the perivascular region were observed where green fluorescent protein (GFP)+ cells could also be seen, but the two cell types do not co-localize, as can be seen by the orientation of the red and green bars; B: An increase in reactivity against α-SMA around the perivascular region was observed, also with augmentation of GFP+ cells, but again these cell types do not co-localize. In both images the nuclei were stained with TO-PRO3 (blue).
- Citation: Paredes BD, Faccioli LAP, Quintanilha LF, Asensi KD, Valle CZD, Canary PC, Takiya CM, Carvalho ACC, Goldenberg RCDS. Bone marrow progenitor cells do not contribute to liver fibrogenic cells. World J Hepatol 2012; 4(10): 274-283
- URL: https://www.wjgnet.com/1948-5182/full/v4/i10/274.htm
- DOI: https://dx.doi.org/10.4254/wjh.v4.i10.274


