Copyright
©2011 Baishideng Publishing Group Co.
World J Hepatol. Sep 27, 2011; 3(9): 250-255
Published online Sep 27, 2011. doi: 10.4254/wjh.v3.i9.250
Published online Sep 27, 2011. doi: 10.4254/wjh.v3.i9.250
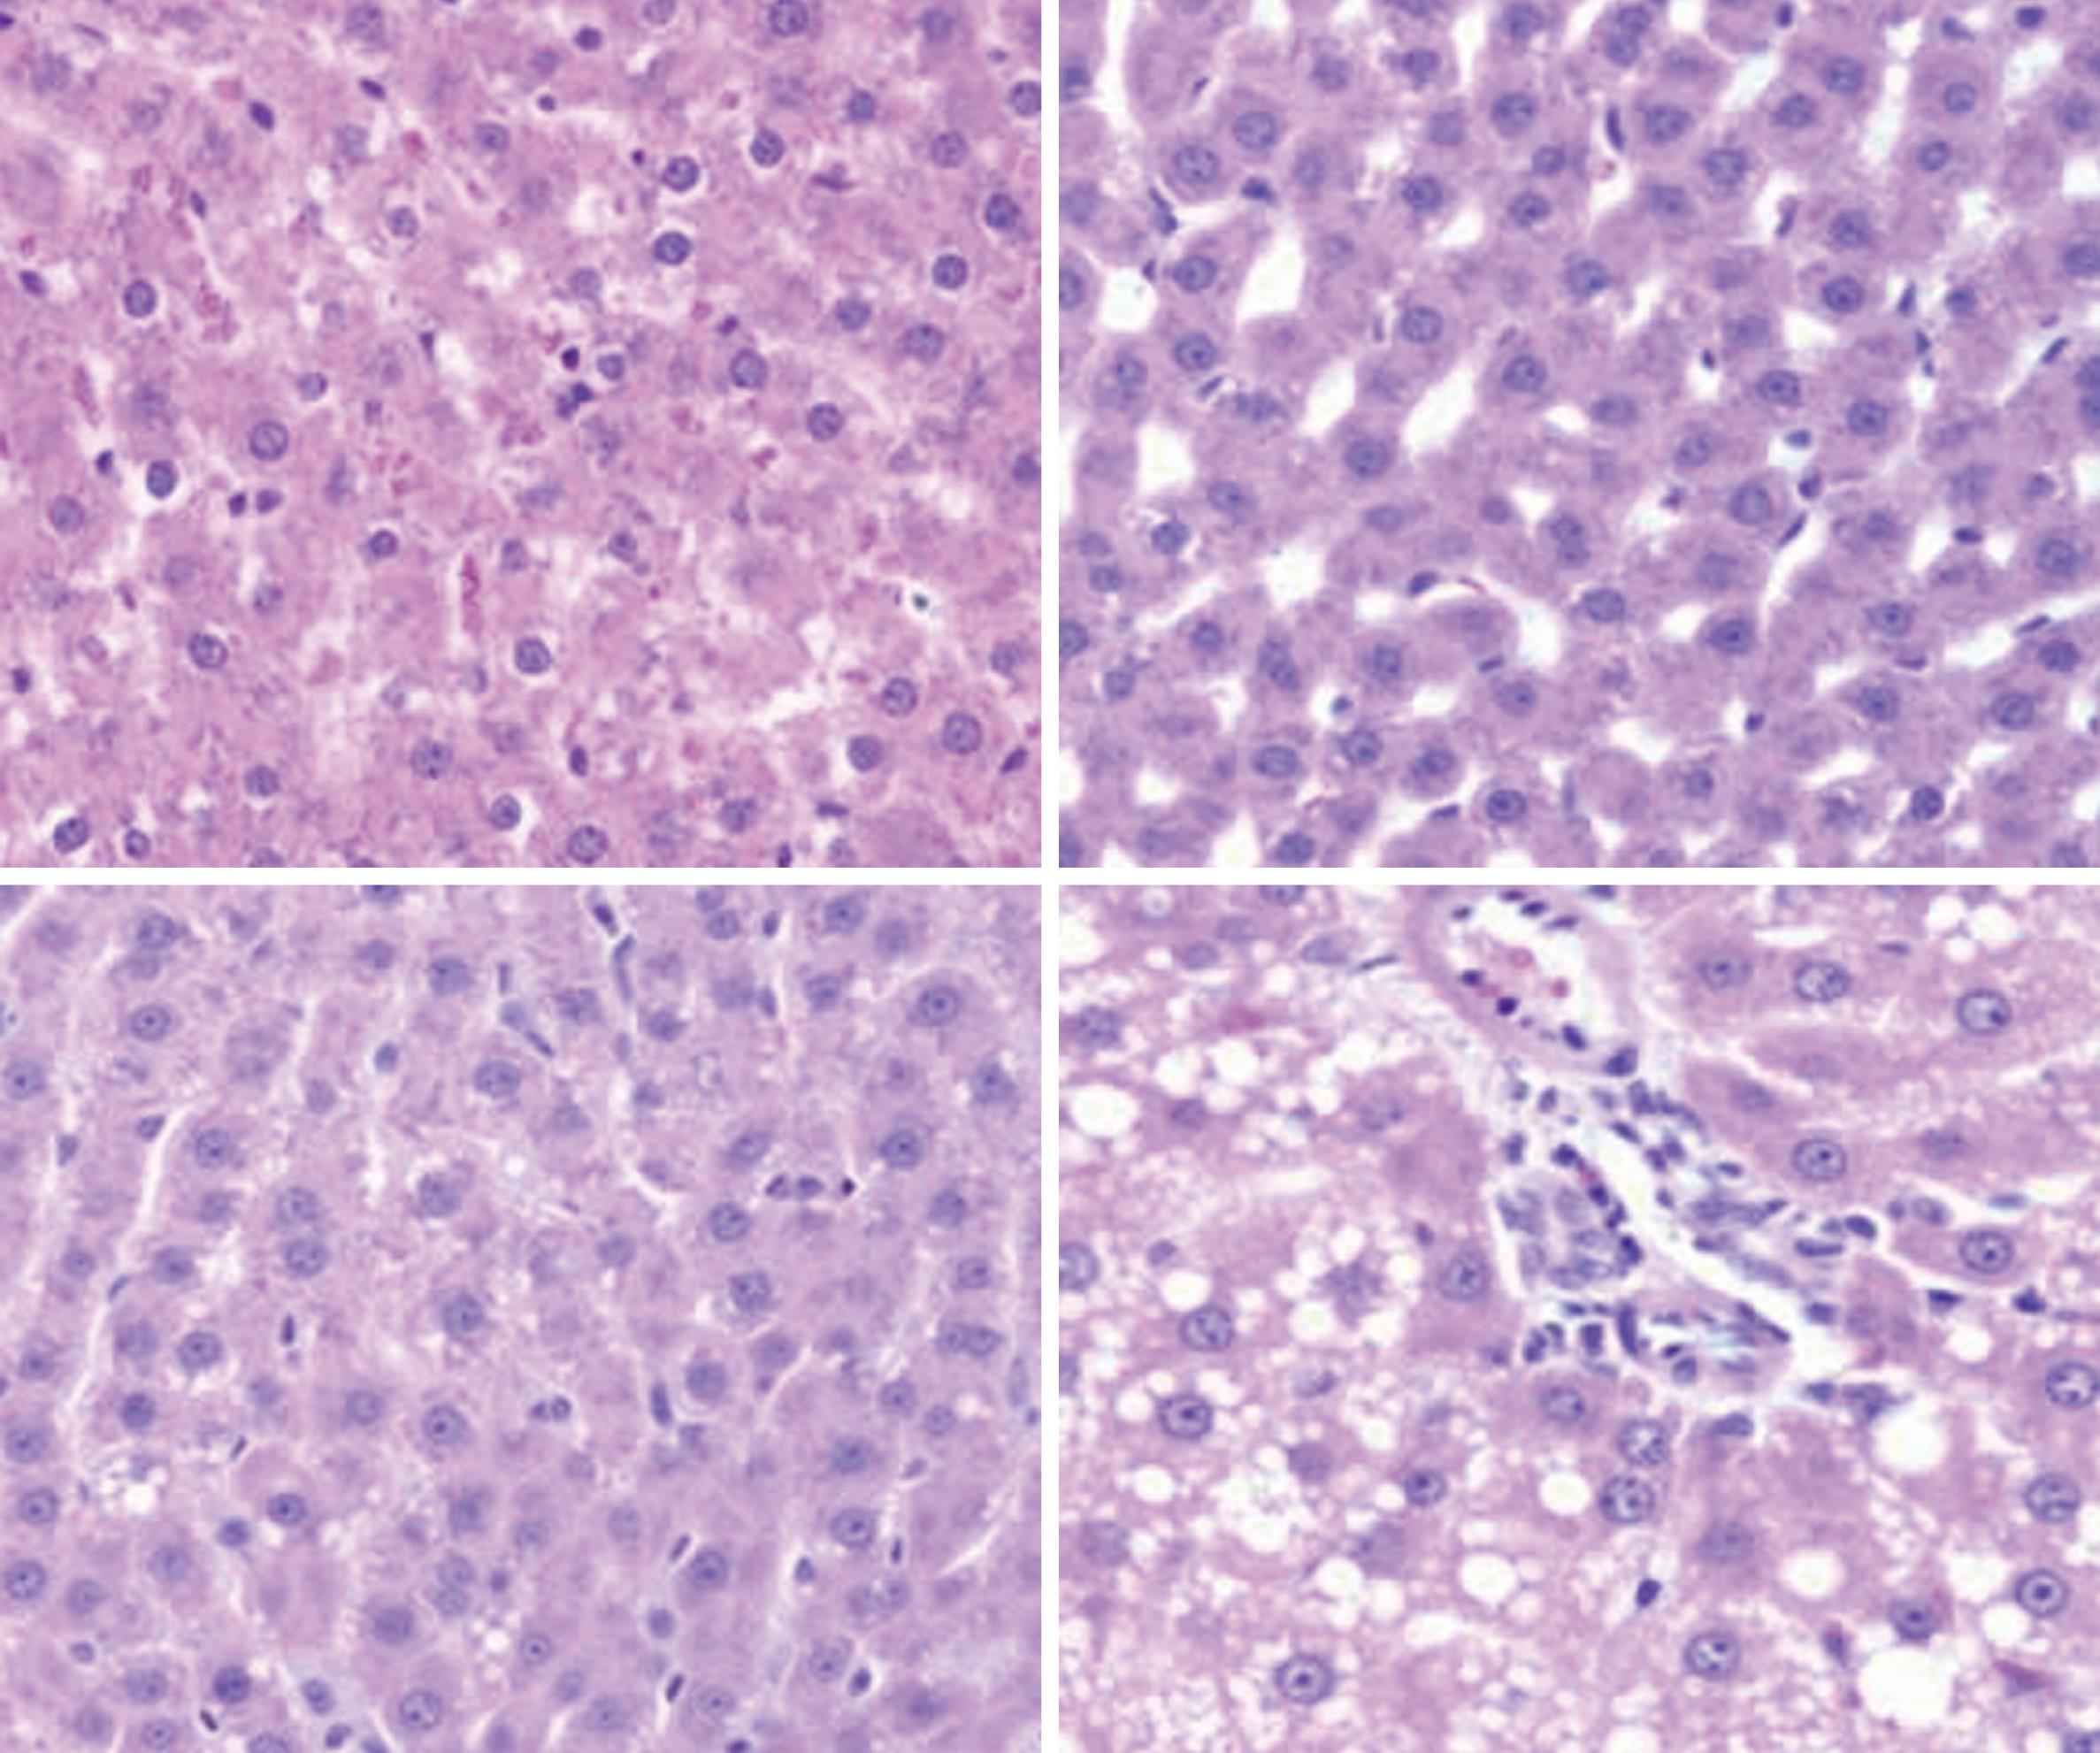
Figure 1 Histology of chronic and chronic ethanol-single binge liver samples.
Rats were fed ethanol in liquid diet chronically for 4 wk and then given a single ethanol binge dose (5 mg/kg, 4 h). Sections of liver samples were stained with hematoxylin and eosin. Control -water represents pair-fed animals given water for binge control.
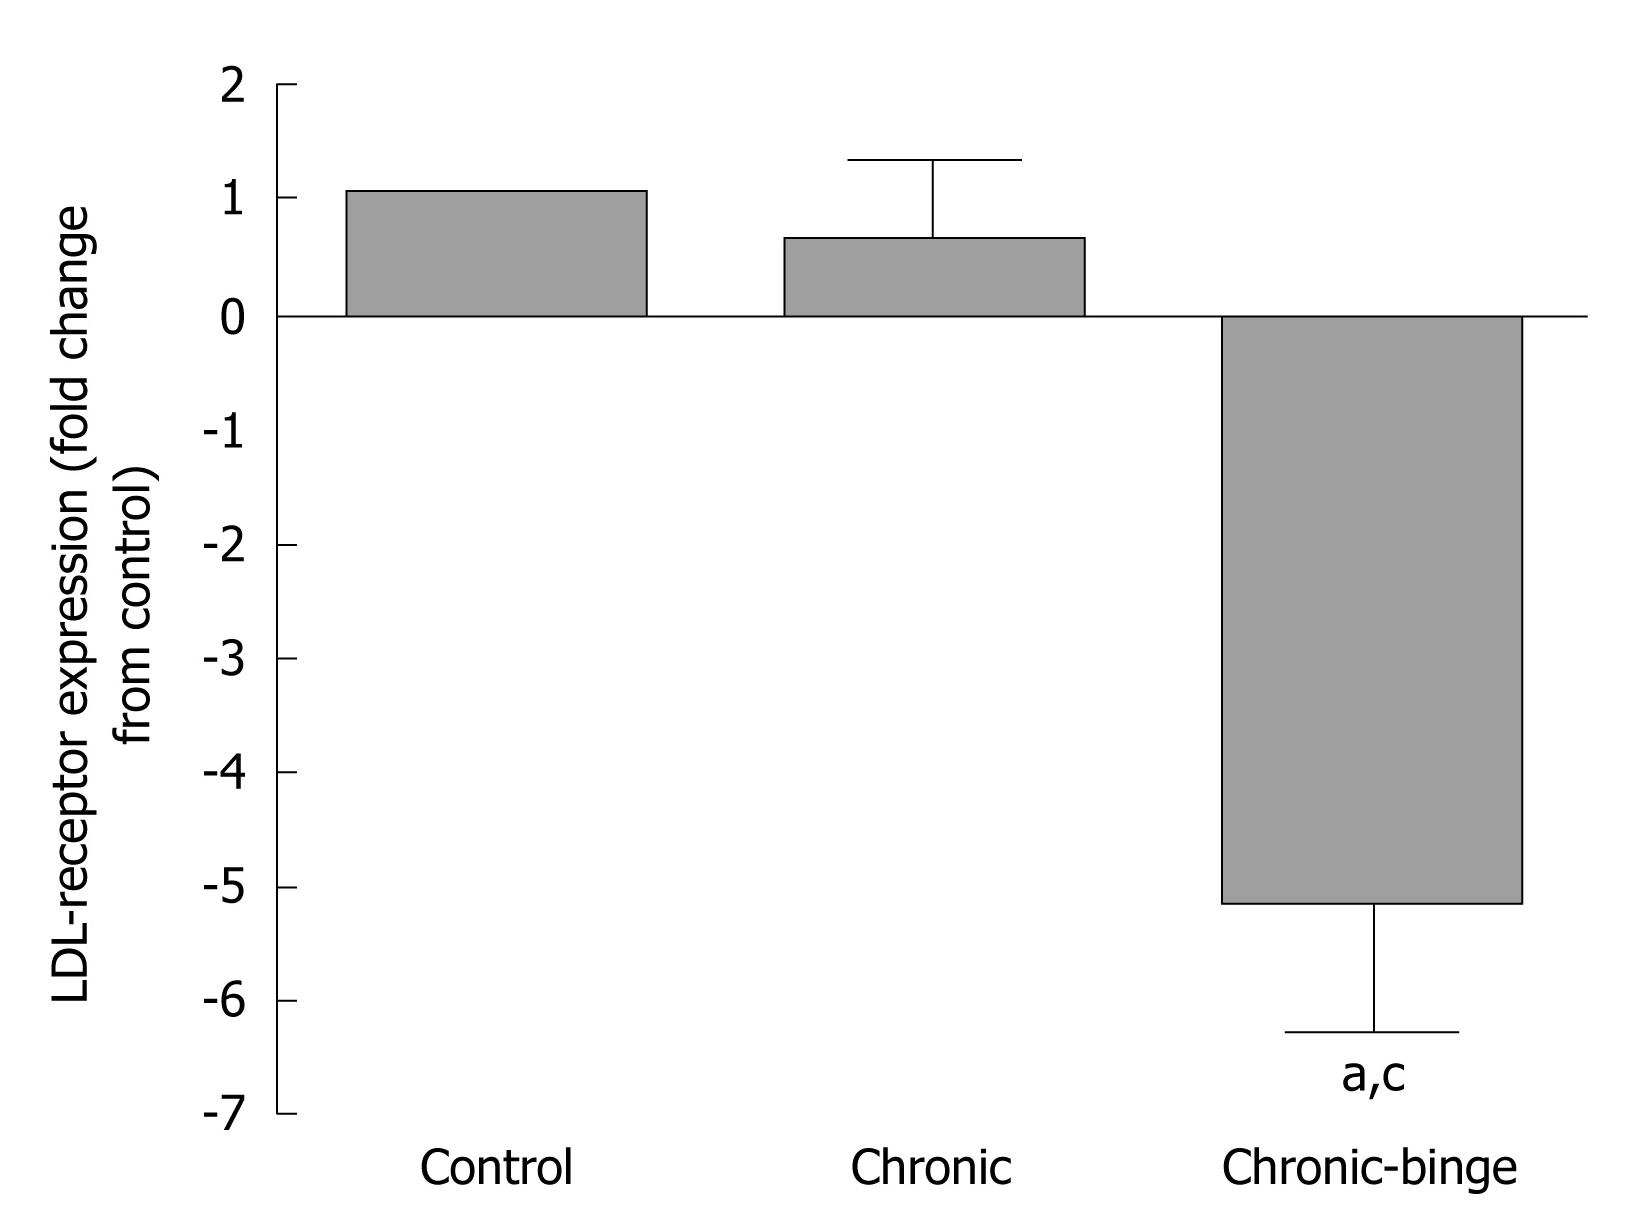
Figure 2 Low-density lipoprotein-receptor mRNA expression in chronic and chronic-binge treated rats.
After 4 wk of chronic ethanol feeding, binge was administered as in Figure 1. Total RNA was isolated from liver and reverse transcribed to cDNA. Aliquots of the cDNA preparations were amplified by real time QT-PCR. The fold increase in gene expression was determined after normalizing the differences in level of GAPDH mRNA. Values are mean ± SD (n = 4). aP < 0.05 vs control; cP < 0.05 vs chronic ethanol group.
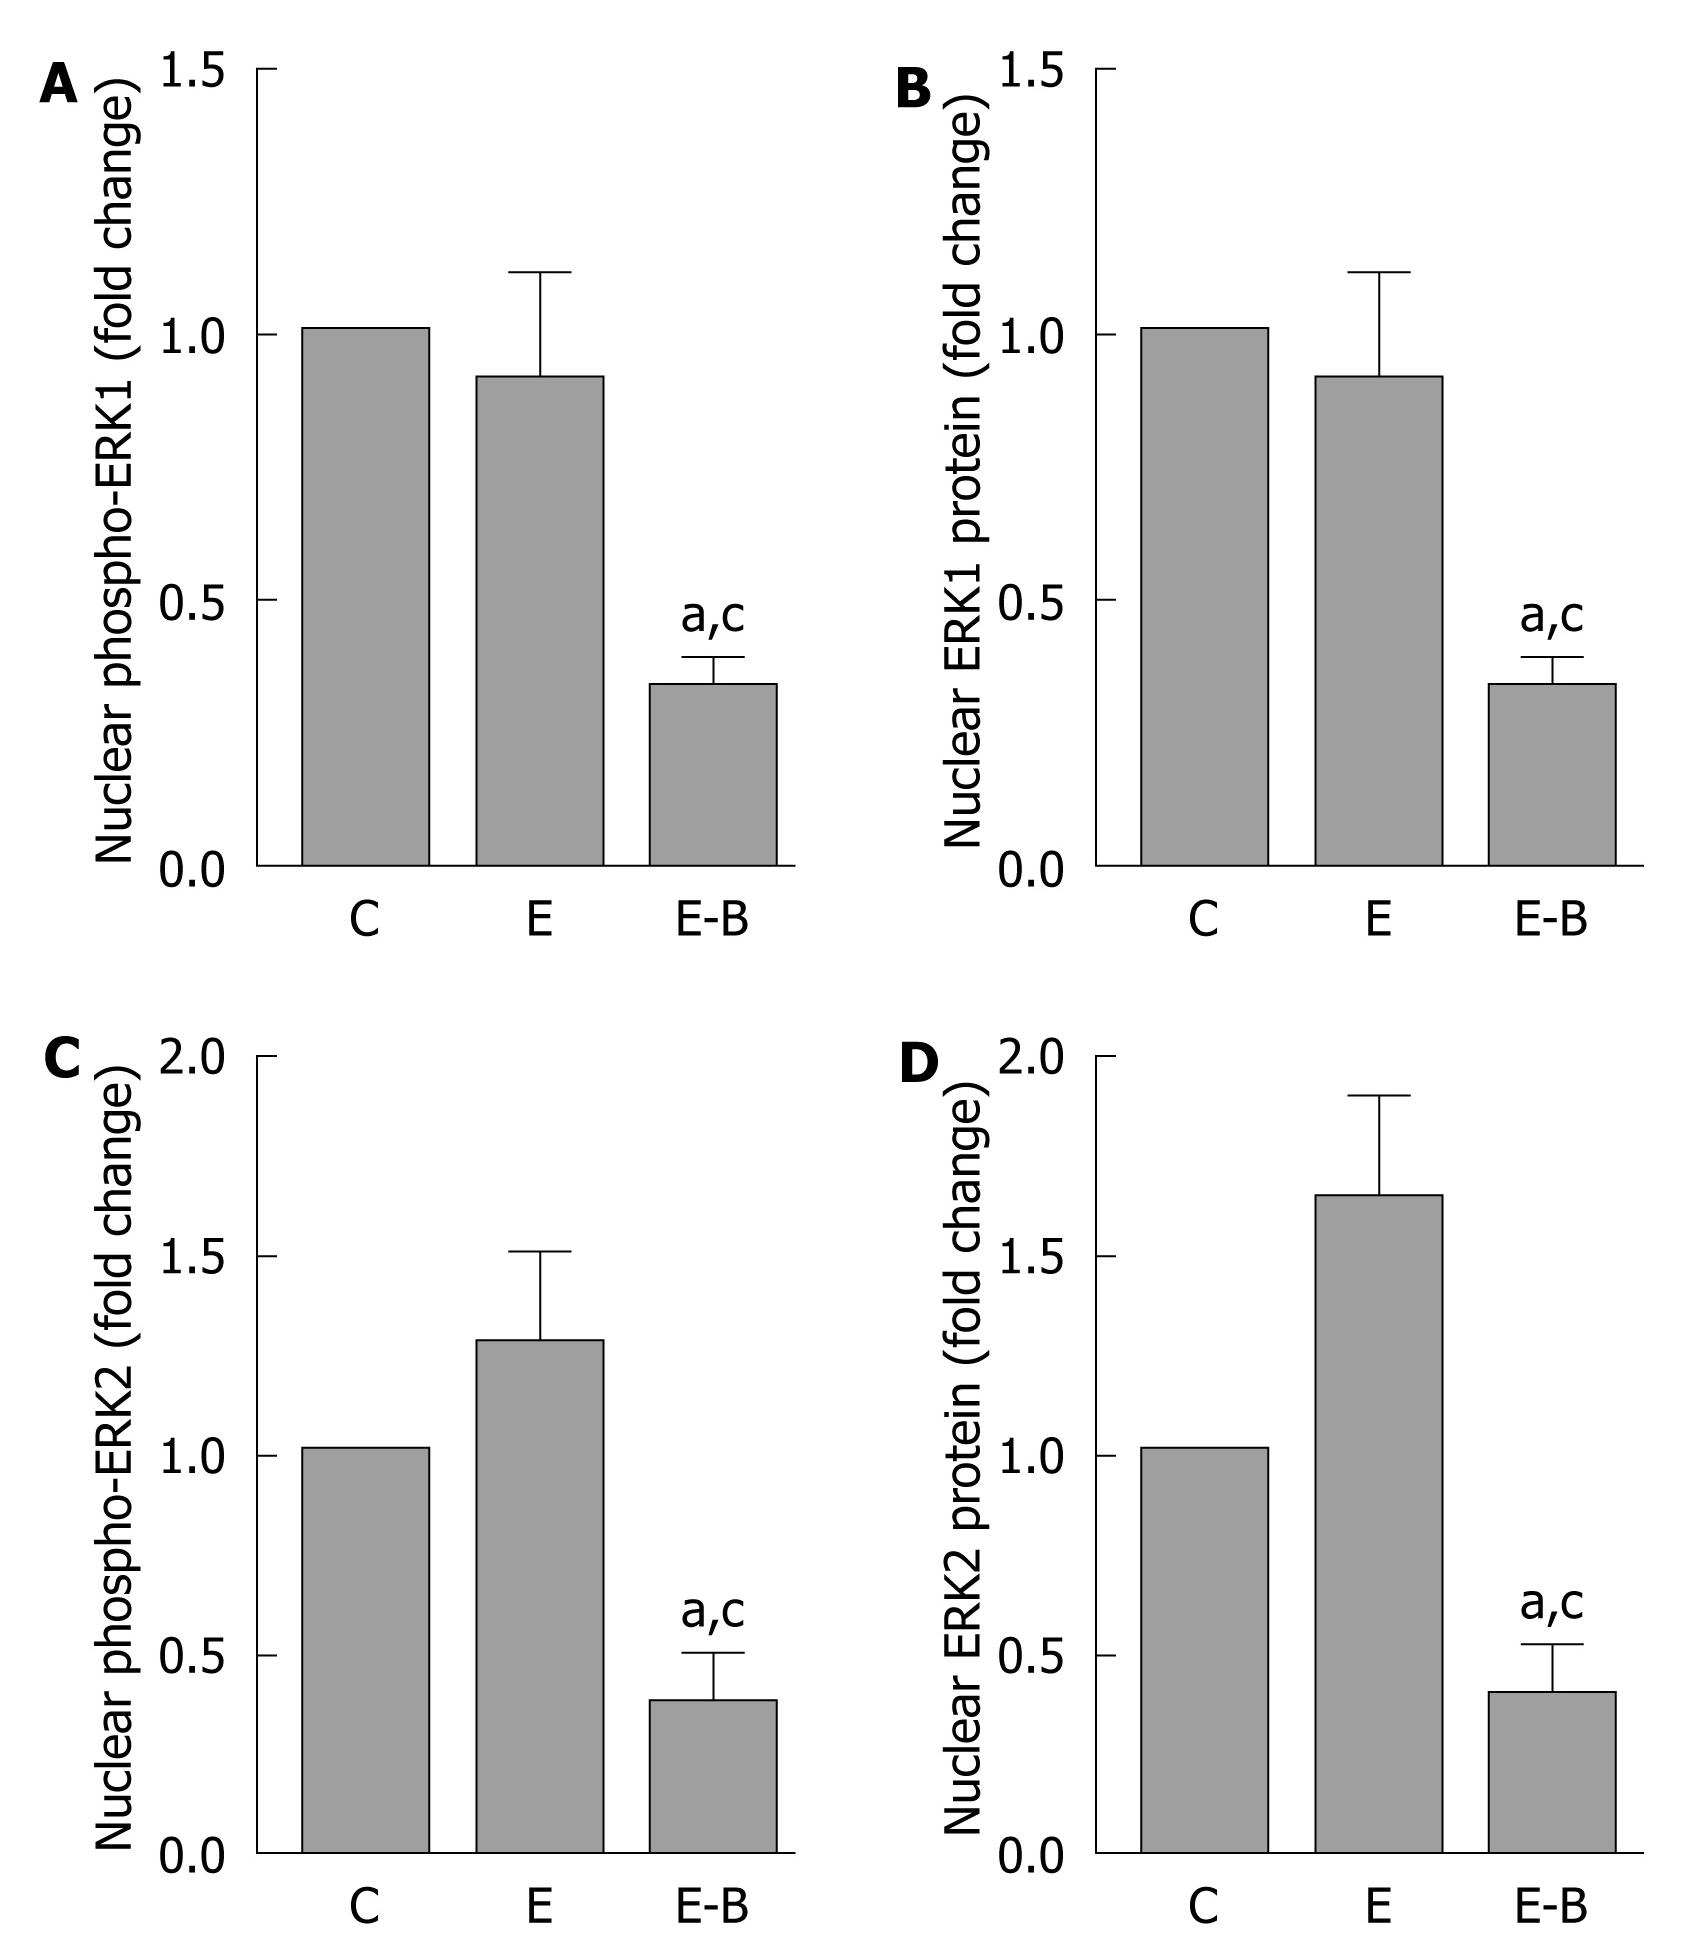
Figure 3 Levels of phosphorylated ERK1/2 (A/C) and ERK1/2 (B/D) protein in nuclear extracts in chronic and chronic-binge treated rats.
The chronic ethanol feeding (4 wk) and binge (single) treatment was as in Figure 1. The nuclear extracts from liver were subjected to western blotting with respective antibodies, followed by densitometry of bands (see methods). Values are mean ± SD (n = 4). aP < 0.05 vs control; cP < 0.05 vs chronic ethanol group. C: Control (pair fed); E: Chronic ethanol; E-B: Chronic-ethanol binge.
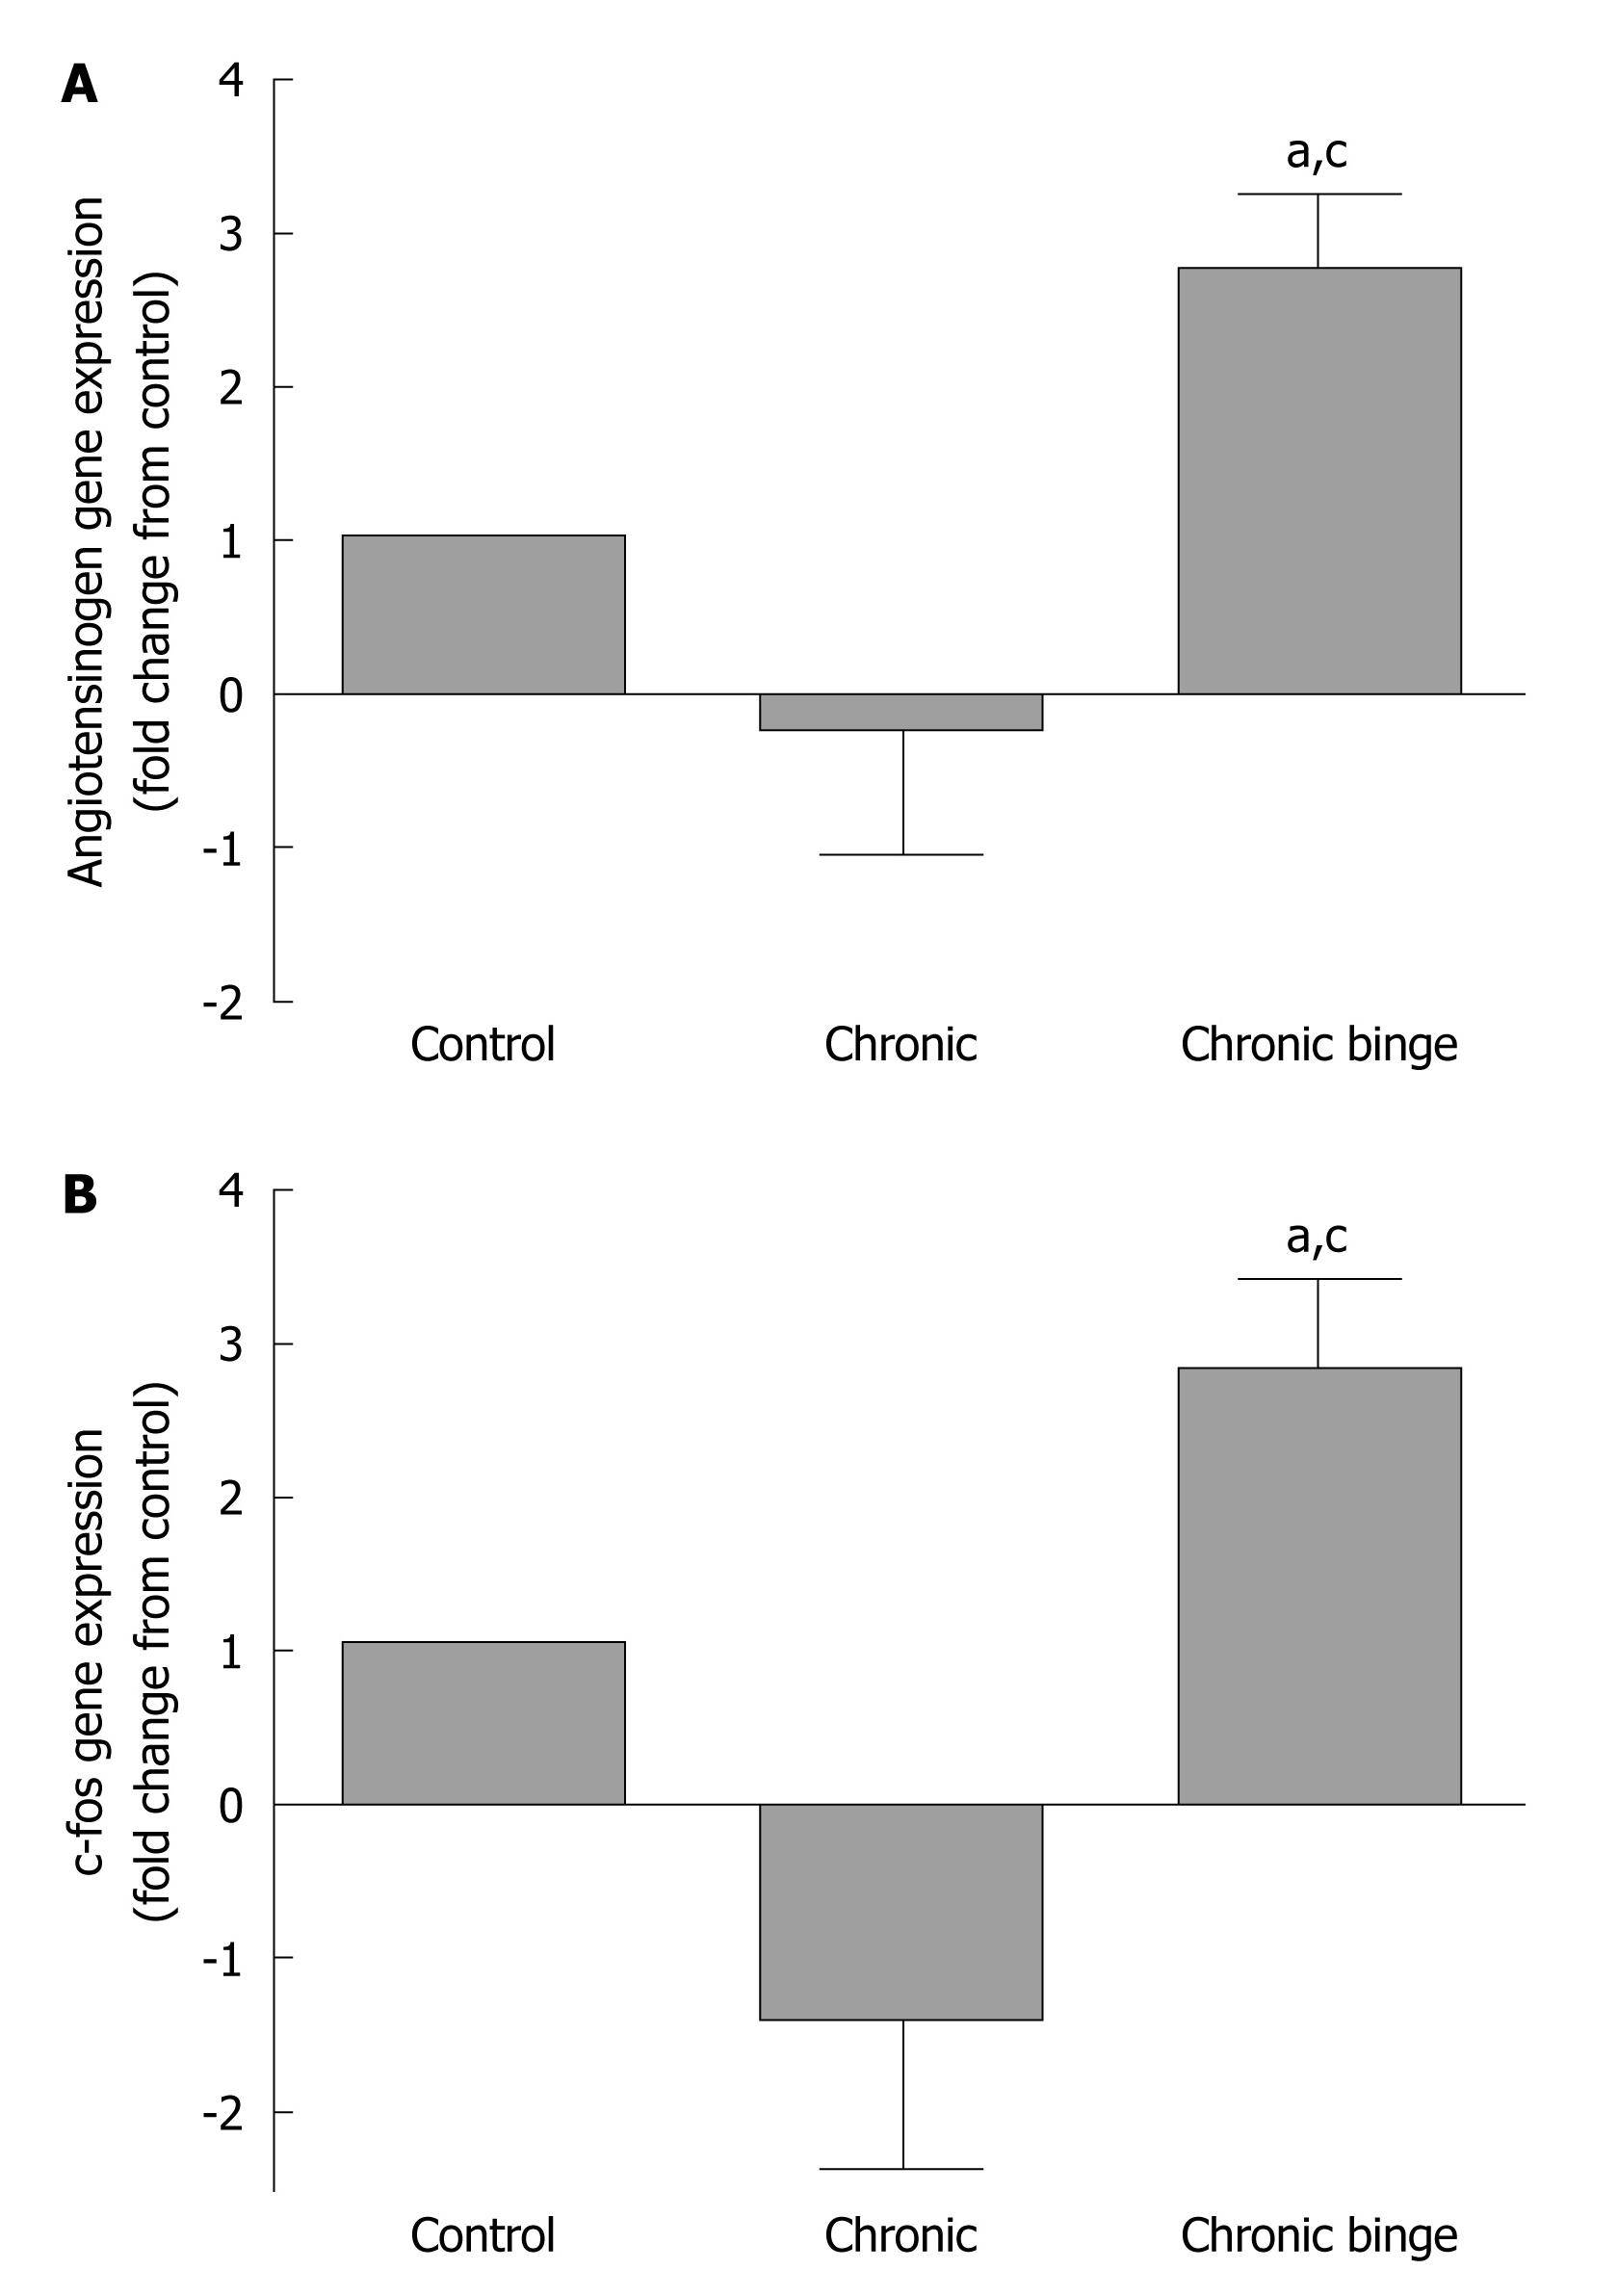
Figure 4 Angiotensionogen (A) and c-fos mRNA (B) expression in chronic and chronic-binge treated rats.
After 4 wk of chronic ethanol feeding, single binge was administered as in Figure 1. Total RNA was isolated from liver and reverse transcribed to cDNA. Aliquots of the cDNA preparations were amplified by real time QT-PCR. The fold increase in gene expression was determined after normalizing the differences in level of GAPDH mRNA. Values are mean ± SD (n = 4). aP < 0.05 vs control; cP < 0.05 vs chronic ethanol group.
- Citation: Aroor AR, Shukla SD. Binge ethanol intake in chronically exposed rat liver decreases LDL-receptor and increases angiotensinogen gene expression. World J Hepatol 2011; 3(9): 250-255
- URL: https://www.wjgnet.com/1948-5182/full/v3/i9/250.htm
- DOI: https://dx.doi.org/10.4254/wjh.v3.i9.250


