Copyright
©The Author(s) 2025.
World J Hepatol. Jun 27, 2025; 17(6): 106481
Published online Jun 27, 2025. doi: 10.4254/wjh.v17.i6.106481
Published online Jun 27, 2025. doi: 10.4254/wjh.v17.i6.106481
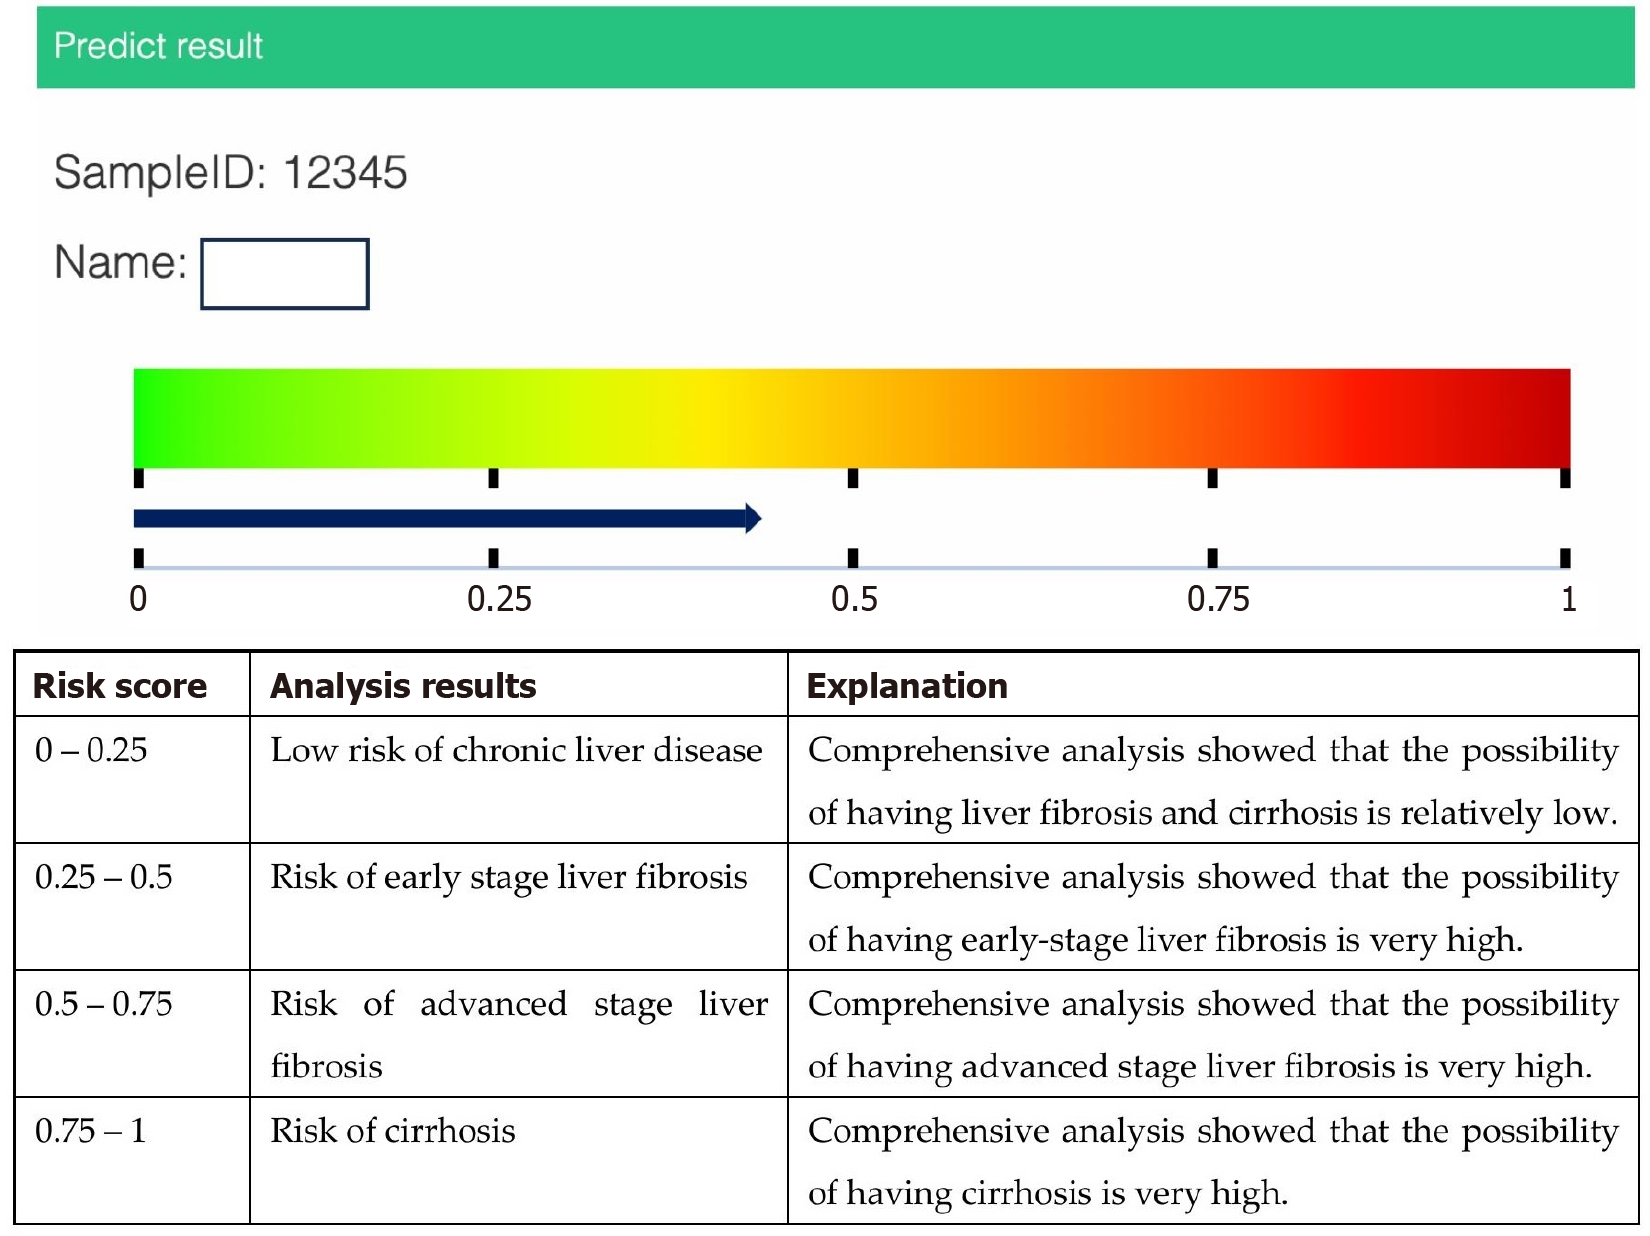
Figure 1 Risk analysis for liver disease.
A comprehensive risk score is calculated using the levels of 5 biomarkers [serum L-tyrosine, taurocholic acid (by Liver FibraChek Dx©), alanine aminotransferase, aspartate aminotransferase, and platelet count] (by standard laboratory hematological assessments), and patient age. Risk scores are categorized into 4 quartile groups, with 0.0 indicating low risk of hepatic disease and 1.0 indicating maximum risk of serious liver disease.
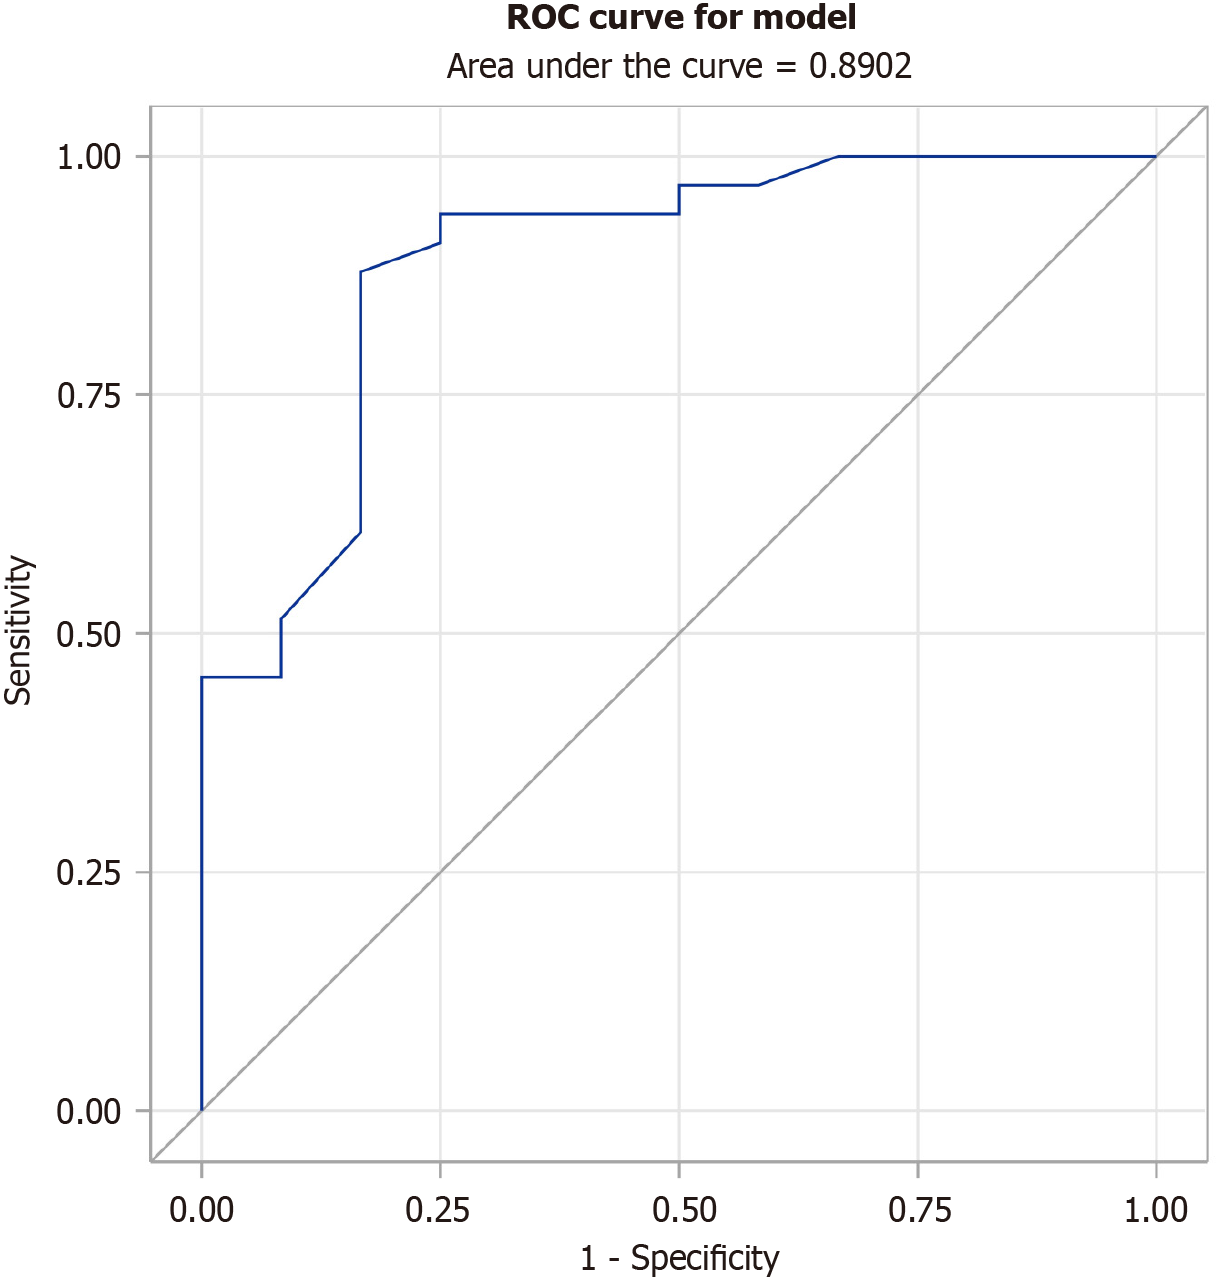
Figure 2 Liver assay receiver operating curve characteristics.
The high likelihood of identifying metabolic dysfunction-associated steatotic liver disease using the Liver FibraChek Dx© + algorithm combination was demonstrated by an area under the receiver operating curve of 0.890 (95%CI: 0.776-1.000). The Liver FibraChek Dx© + algorithm combination. ROC: Receiver operating curve.
- Citation: Siguencia F, Matsuda M, Pandyarajan V, Tanaka S, Smith SM, Bresee C, Seki E, Rosser CJ, Furuya H. Diagnostic performance of Liver FibraChek Dx©, a blood-based test for the non-invasive detection of liver cirrhosis and cancer. World J Hepatol 2025; 17(6): 106481
- URL: https://www.wjgnet.com/1948-5182/full/v17/i6/106481.htm
- DOI: https://dx.doi.org/10.4254/wjh.v17.i6.106481


