Copyright
©The Author(s) 2025.
World J Hepatol. Jun 27, 2025; 17(6): 106418
Published online Jun 27, 2025. doi: 10.4254/wjh.v17.i6.106418
Published online Jun 27, 2025. doi: 10.4254/wjh.v17.i6.106418
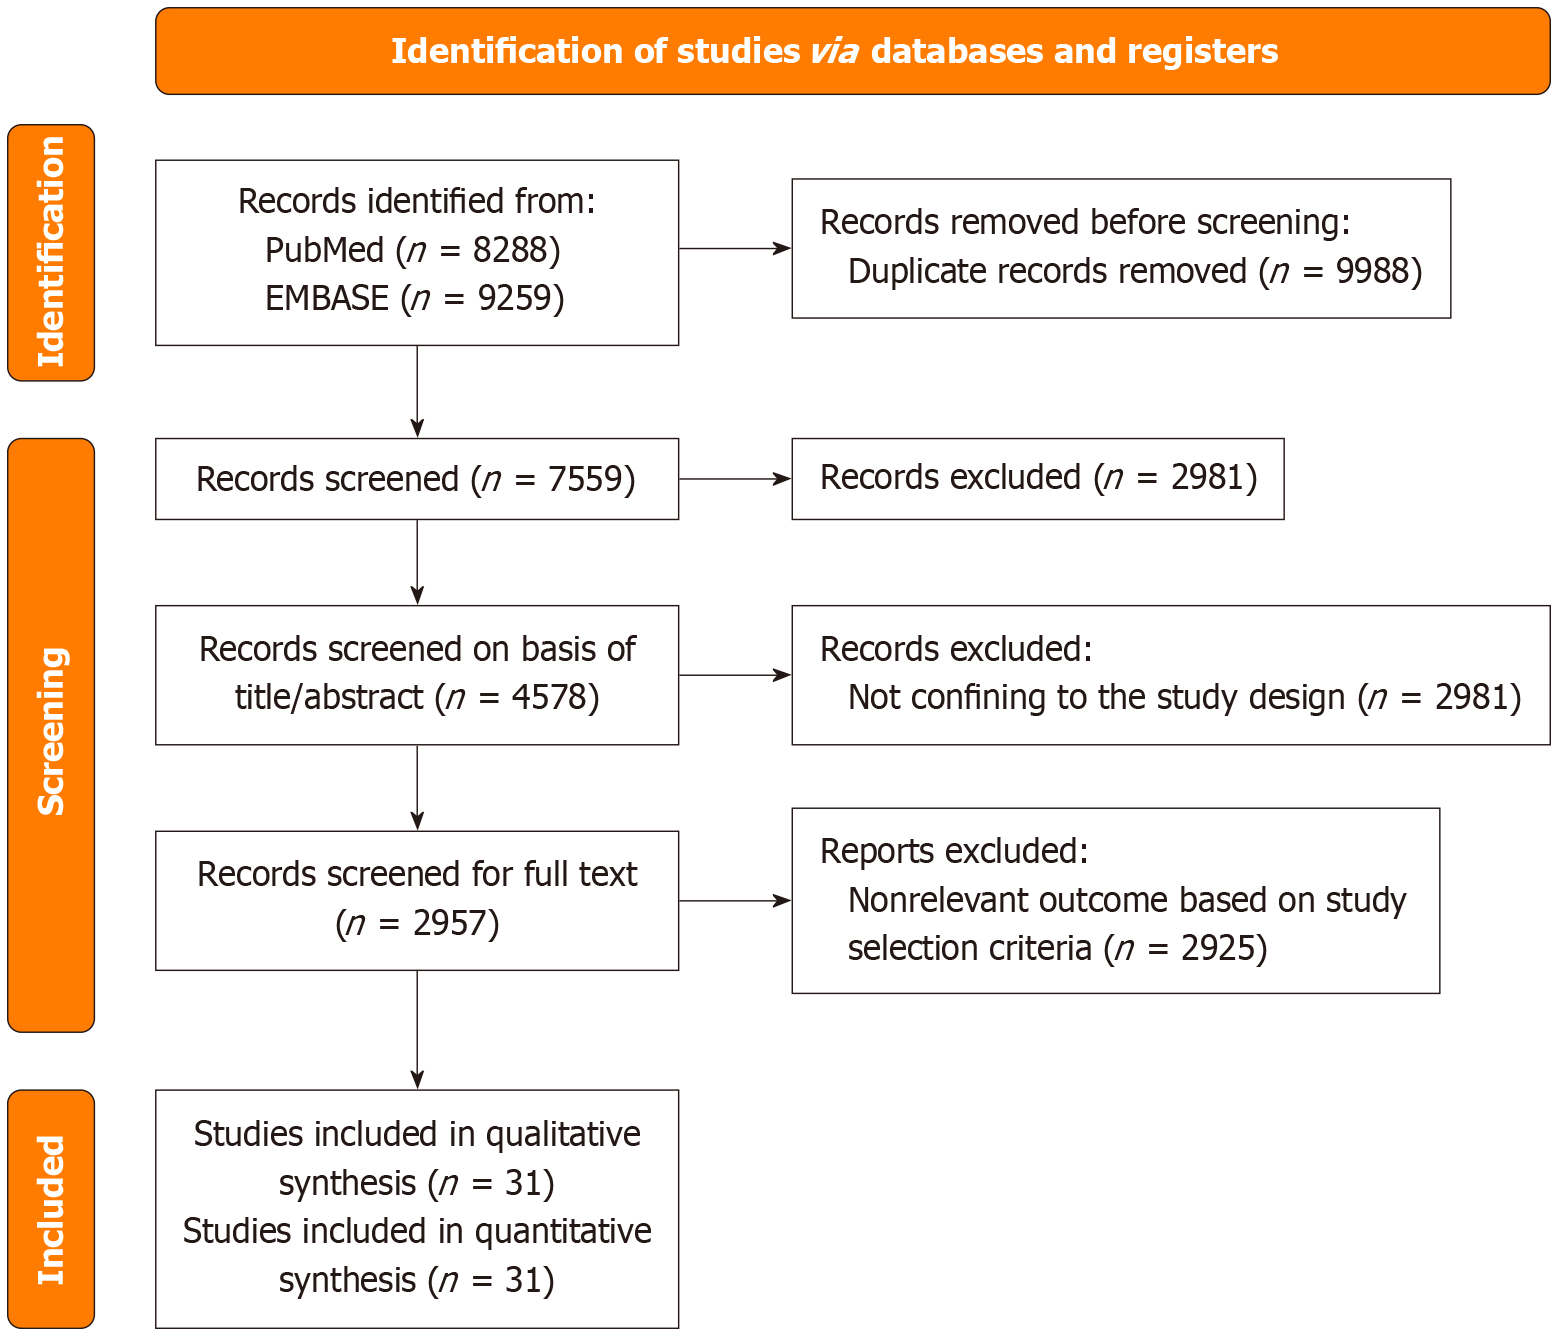
Figure 1 PRISMA flow diagram of this study.
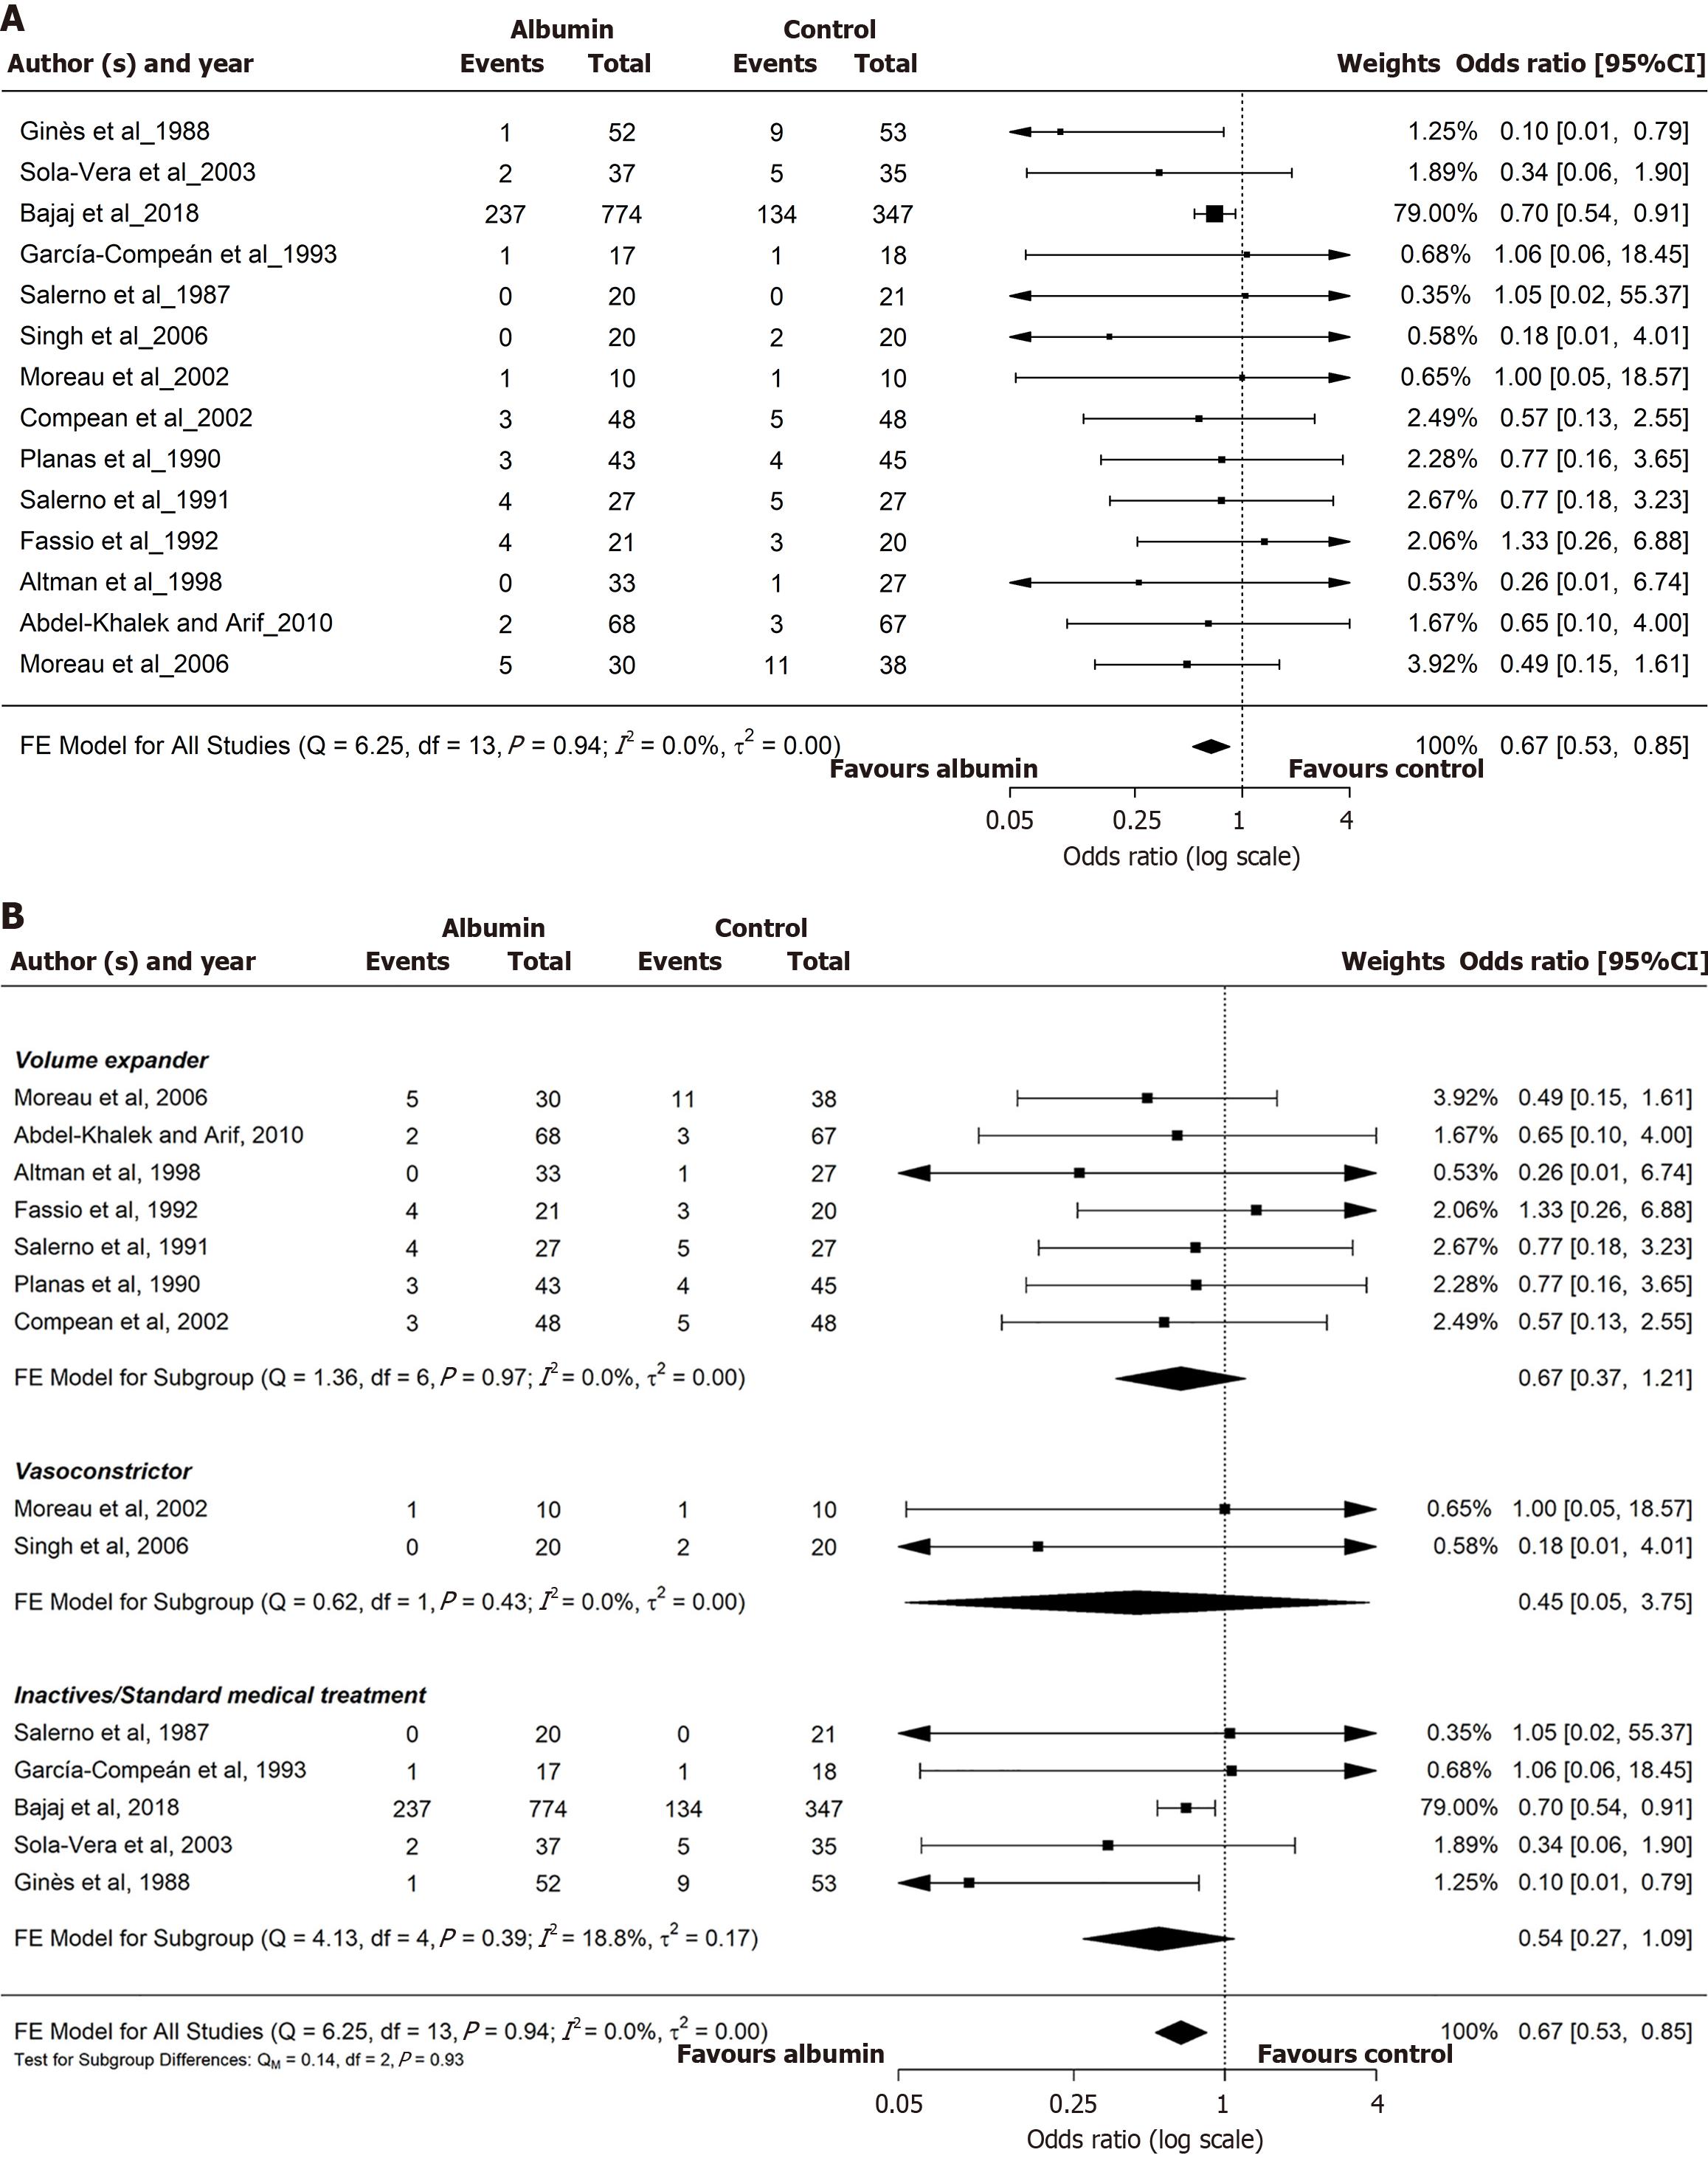
Figure 2 Forest plot for hyponatremia outcome comparing albumin with control and hyponatremia comparing albumin and control across other treatment groups.
A: Hyponatremia outcome comparing albumin with control; B: Hyponatremia comparing albumin and control across other treatment groups. 95%CI: 95% confidence interval; df: Degrees of freedom; FE: Fixed effect.
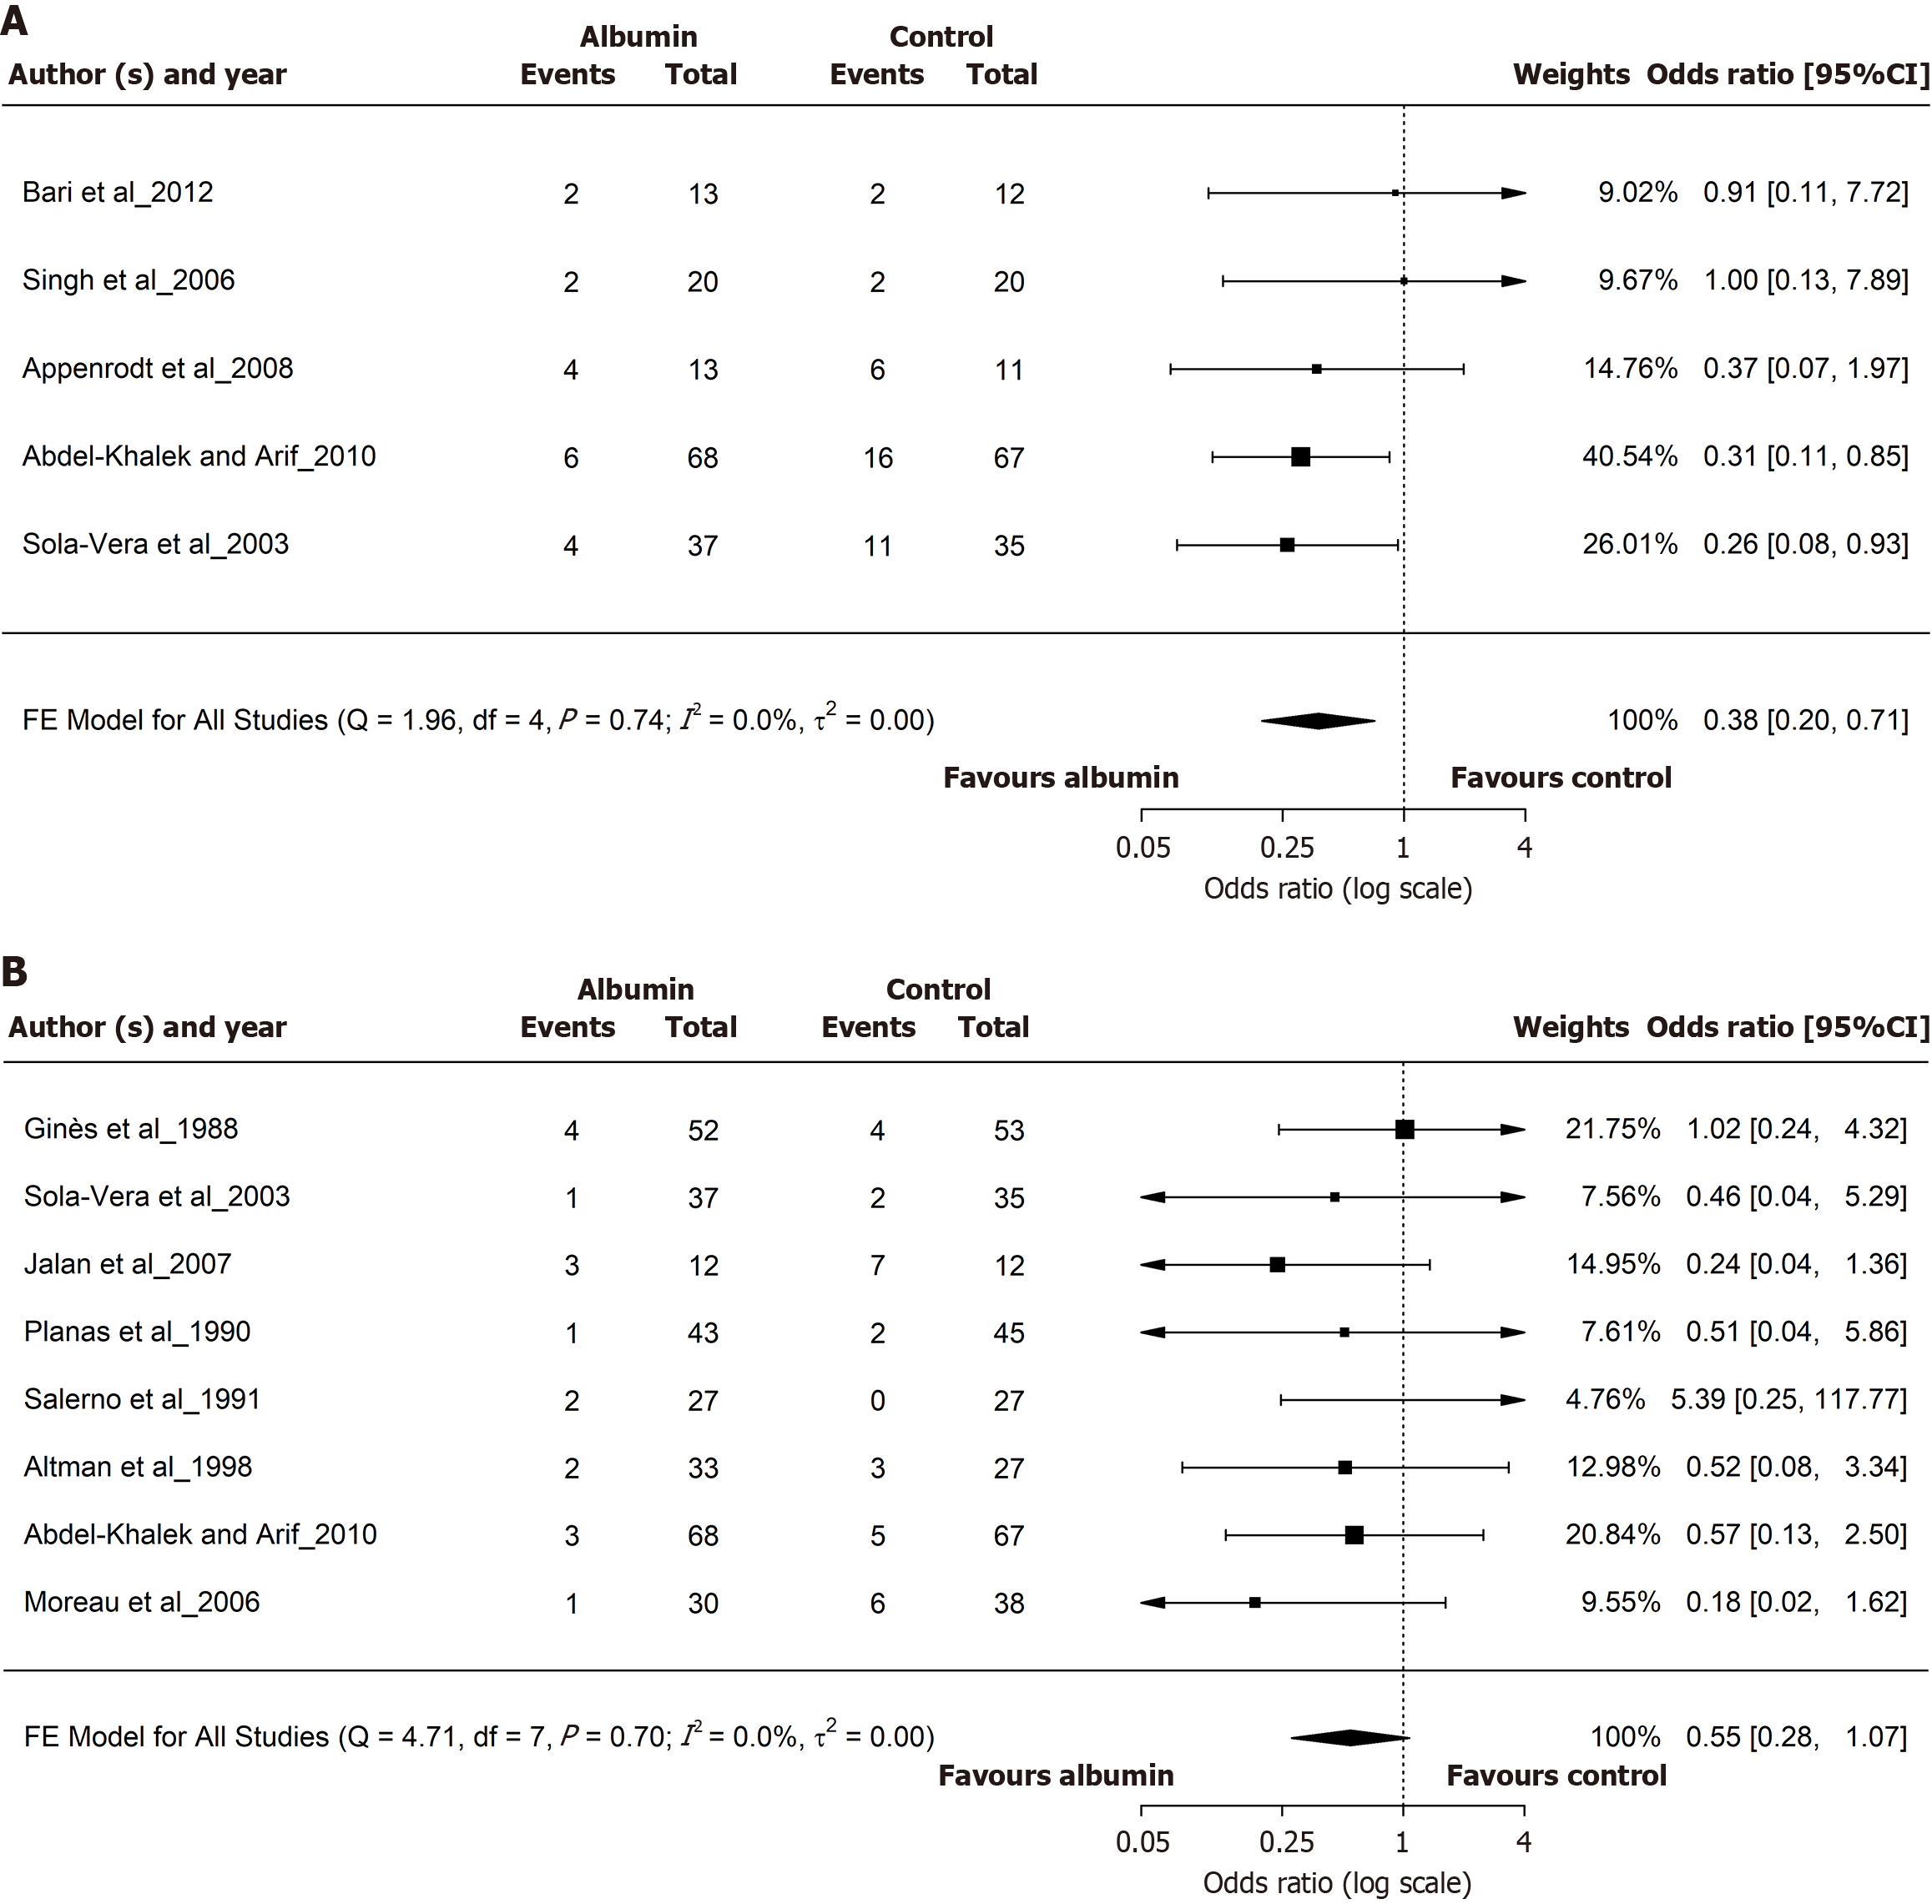
Figure 3 Forest plot for post-paracentesis circulatory dysfunction outcome comparing albumin with control and severe infection outcome comparing albumin with control.
A: Post-paracentesis circulatory dysfunction outcome comparing albumin with control; B: Severe infection outcome comparing albumin with control. 95%CI: 95% confidence interval; df: Degrees of freedom; FE: Fixed effect.
- Citation: Zhou HJ, Li ZQ, Dili DE, Xie Q. Human albumin infusion for reducing hyponatremia and circulatory dysfunction in liver cirrhosis: A meta-analysis update. World J Hepatol 2025; 17(6): 106418
- URL: https://www.wjgnet.com/1948-5182/full/v17/i6/106418.htm
- DOI: https://dx.doi.org/10.4254/wjh.v17.i6.106418


