Copyright
©The Author(s) 2023.
World J Hepatol. Oct 27, 2023; 15(10): 1164-1169
Published online Oct 27, 2023. doi: 10.4254/wjh.v15.i10.1164
Published online Oct 27, 2023. doi: 10.4254/wjh.v15.i10.1164
Figure 1 Computed tomography of the Abdomen and Pelvis illustrating the interval changes of the hepatic inflammatory pseudotumor in a span of 3 mo.
A: A 5.0 cm × 3.0 cm mildly hypodense hepatic mass on computed tomography (CT) A/P dual phase liver; B: A 1.9 cm × 1.3 cm mildly hypodense hepatic mass (previously 5.0 cm × 3.0 cm) on CT A/P dual phase liver; C: A 1.1 cm × 1.1 cm right hepatic lobe mass on CT A/P dual phase liver; D: Resolution of the 1.1 cm × 1.1 cm right hepatic lobe mass (visualized in C).
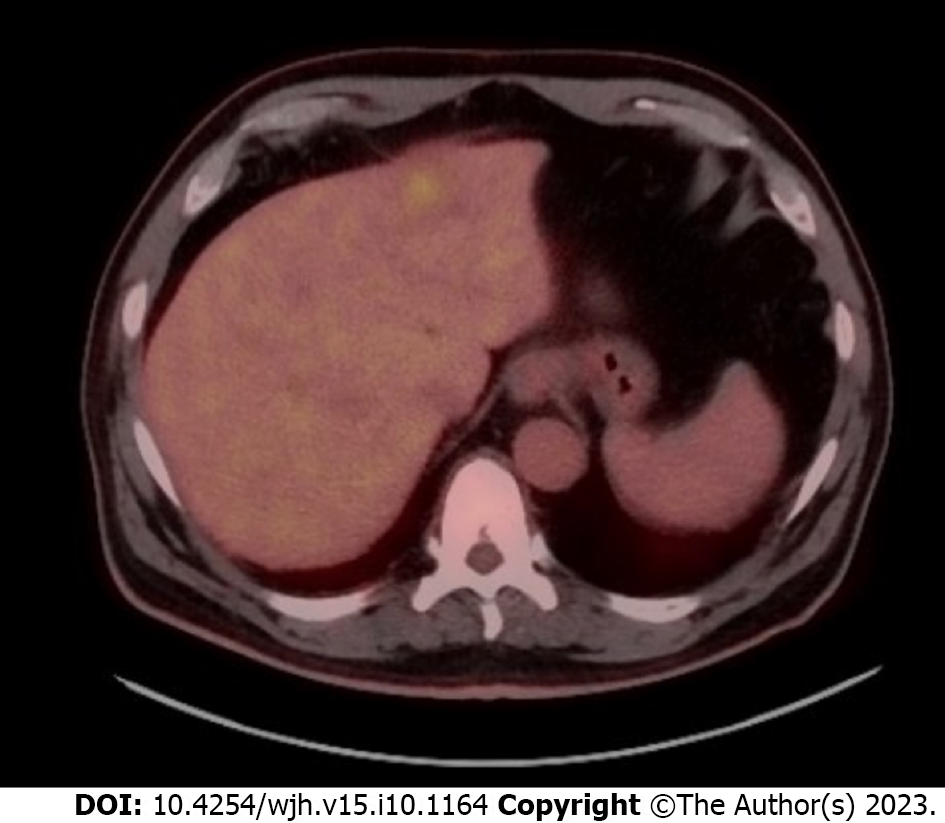
Figure 2 Whole body fluorodeoxyglucose-positron emission tomography/computed tomography illustrating overall uptake of left lobe hepatic masses similar to the remainder of the liver.
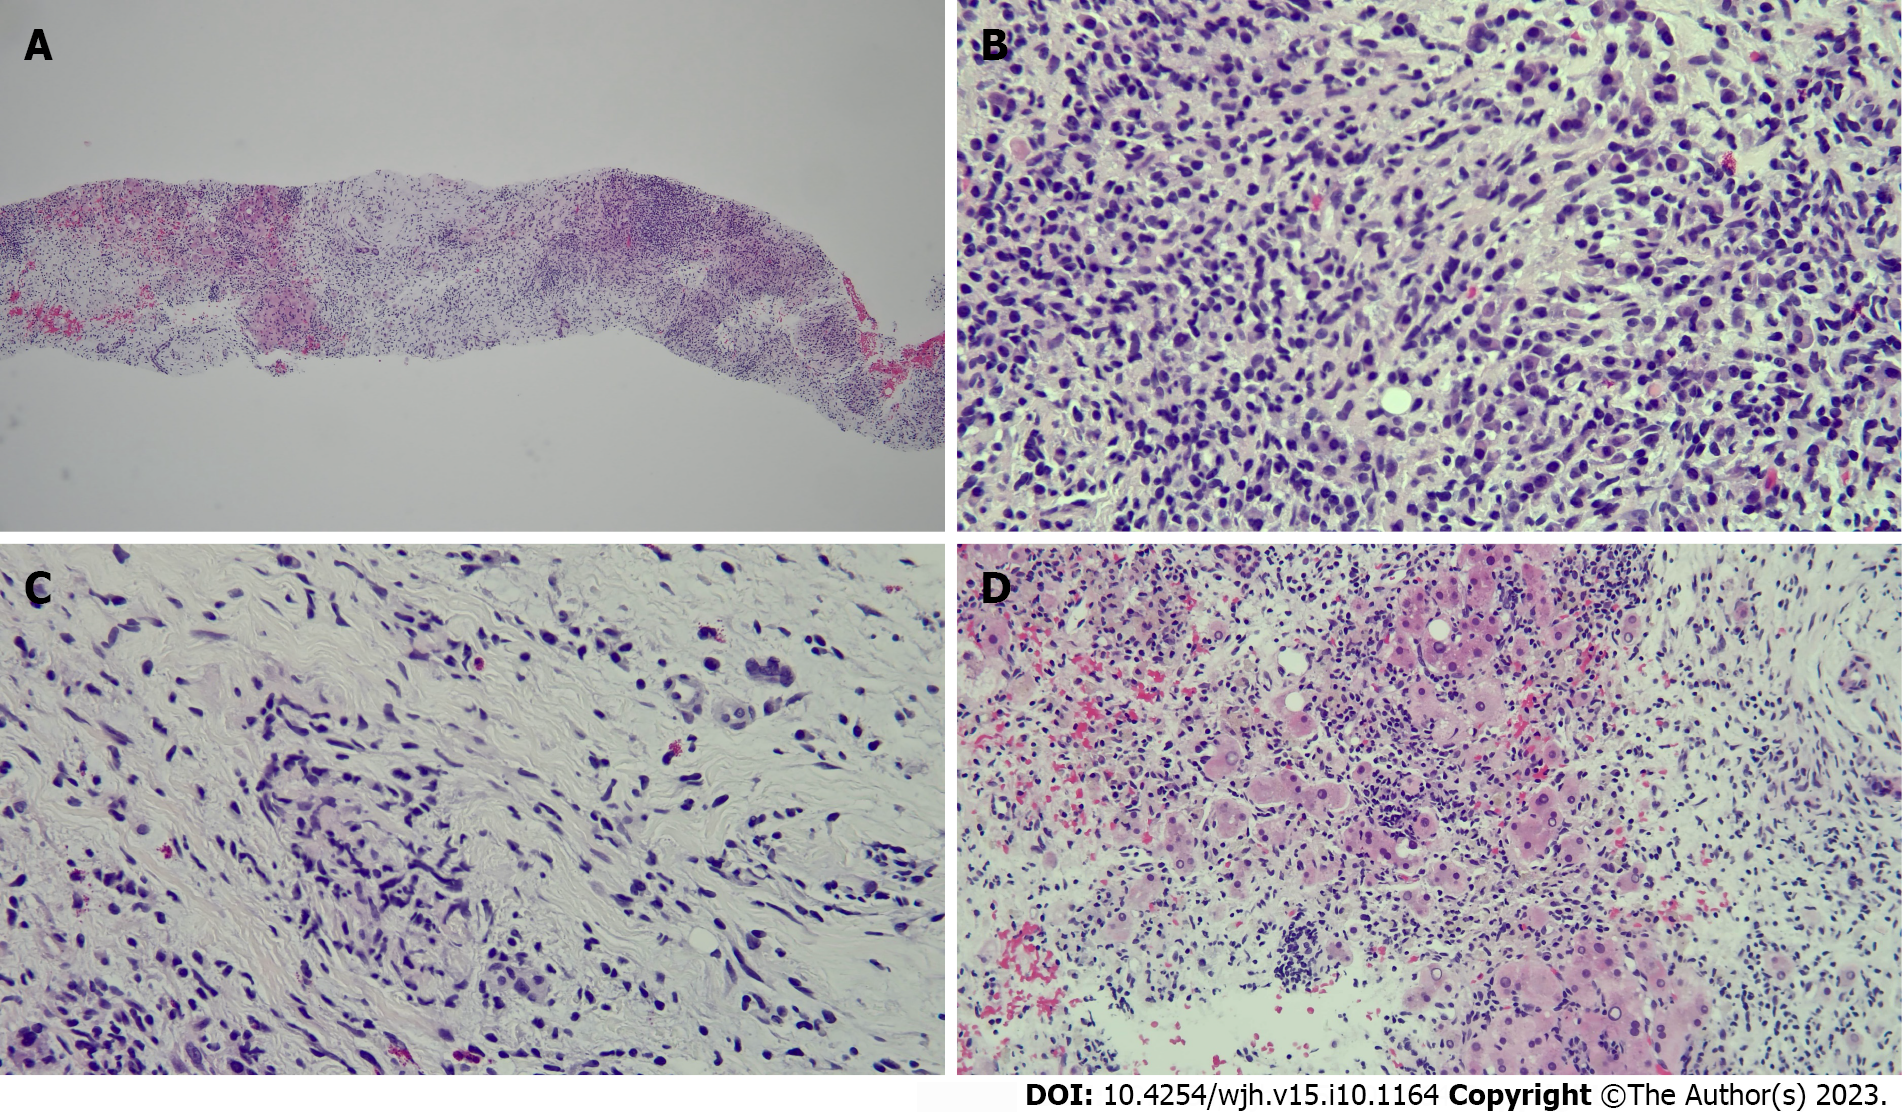
Figure 3 Ultrasound-guided fine-needle aspiration of the liver mass visualized on computed tomography.
A: Core biopsy of the liver mass; B: Core biopsy showing lymphoplasmacytic infiltrate and absence of malignant cells; C: Core biopsy with replacement of multiacinar liver parenchyma by fibrous and myxoid stroma with dense lymphoplasmacellular infiltrate; D: Core biopsy visualizing benign hepatocytes.
- Citation: Patel A, Chen A, Lalos AT. Inflammatory pseudotumors in the liver associated with influenza: A case report. World J Hepatol 2023; 15(10): 1164-1169
- URL: https://www.wjgnet.com/1948-5182/full/v15/i10/1164.htm
- DOI: https://dx.doi.org/10.4254/wjh.v15.i10.1164


