Copyright
©The Author(s) 2022.
World J Hepatol. Mar 27, 2022; 14(3): 602-611
Published online Mar 27, 2022. doi: 10.4254/wjh.v14.i3.602
Published online Mar 27, 2022. doi: 10.4254/wjh.v14.i3.602
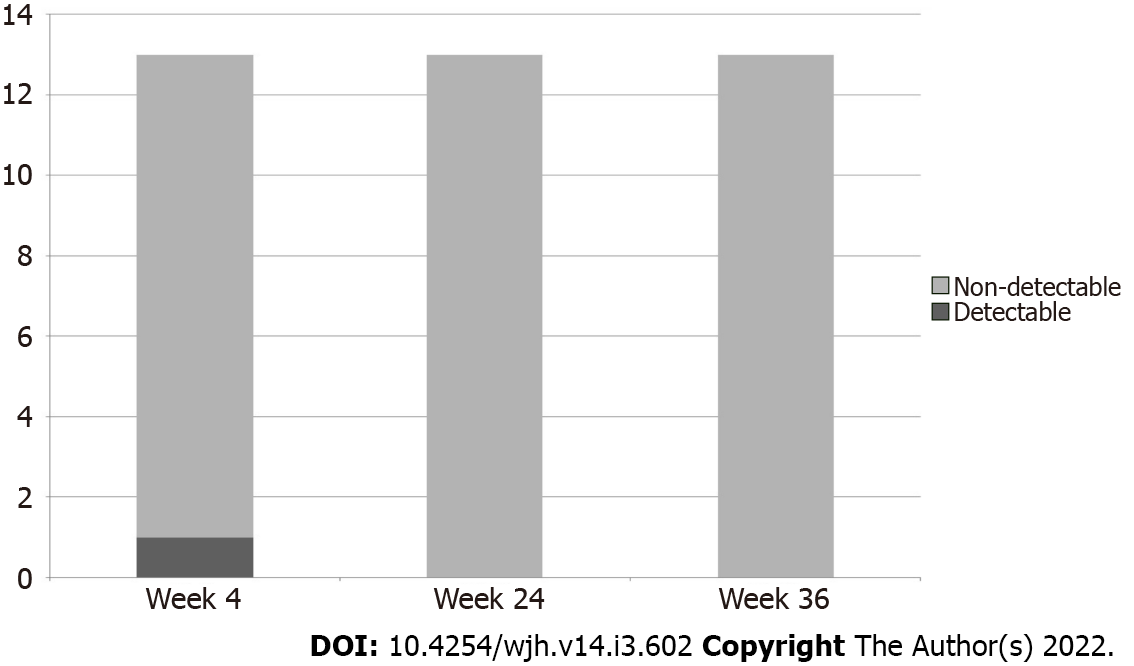
Figure 1
Hepatitis C RNA during and after treatment.
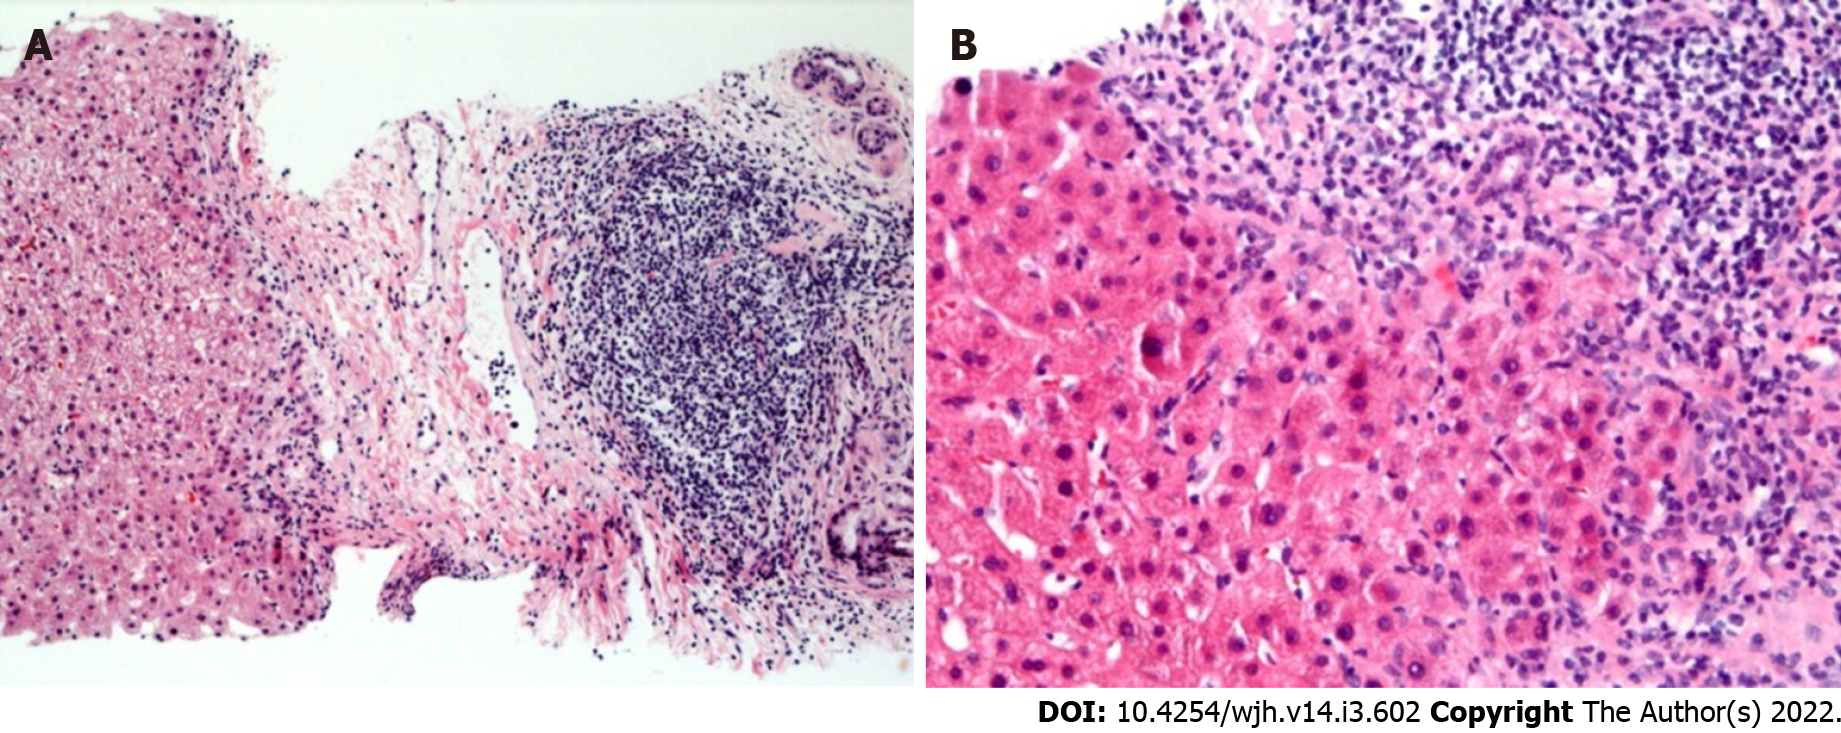
Figure 2 End of treatment liver biopsy.
A: Portal tract showing fibrosis and a robust lymphoid aggregate reminiscent of a germinal center in the biopsy tissue from patient 12 who completed treatment for hepatitis C (Hematoxylin and eosin, X50); B: There is interface hepatitis as the portal lymphocytic infiltrates spill into the surrounding liver parenchyma in the biopsy tissue from patient 9 (Hematoxylin and eosin, 100X).
- Citation: Ismail B, Benrajab KM, Bejarano P, Ruiz P, Sears D, Tzakis A, Zervos XB. Benign course of residual inflammation at end of treatment of liver transplant recipients after sofosbuvir based therapy. World J Hepatol 2022; 14(3): 602-611
- URL: https://www.wjgnet.com/1948-5182/full/v14/i3/602.htm
- DOI: https://dx.doi.org/10.4254/wjh.v14.i3.602


