Copyright
©The Author(s) 2021.
World J Hepatol. Aug 27, 2021; 13(8): 949-968
Published online Aug 27, 2021. doi: 10.4254/wjh.v13.i8.949
Published online Aug 27, 2021. doi: 10.4254/wjh.v13.i8.949
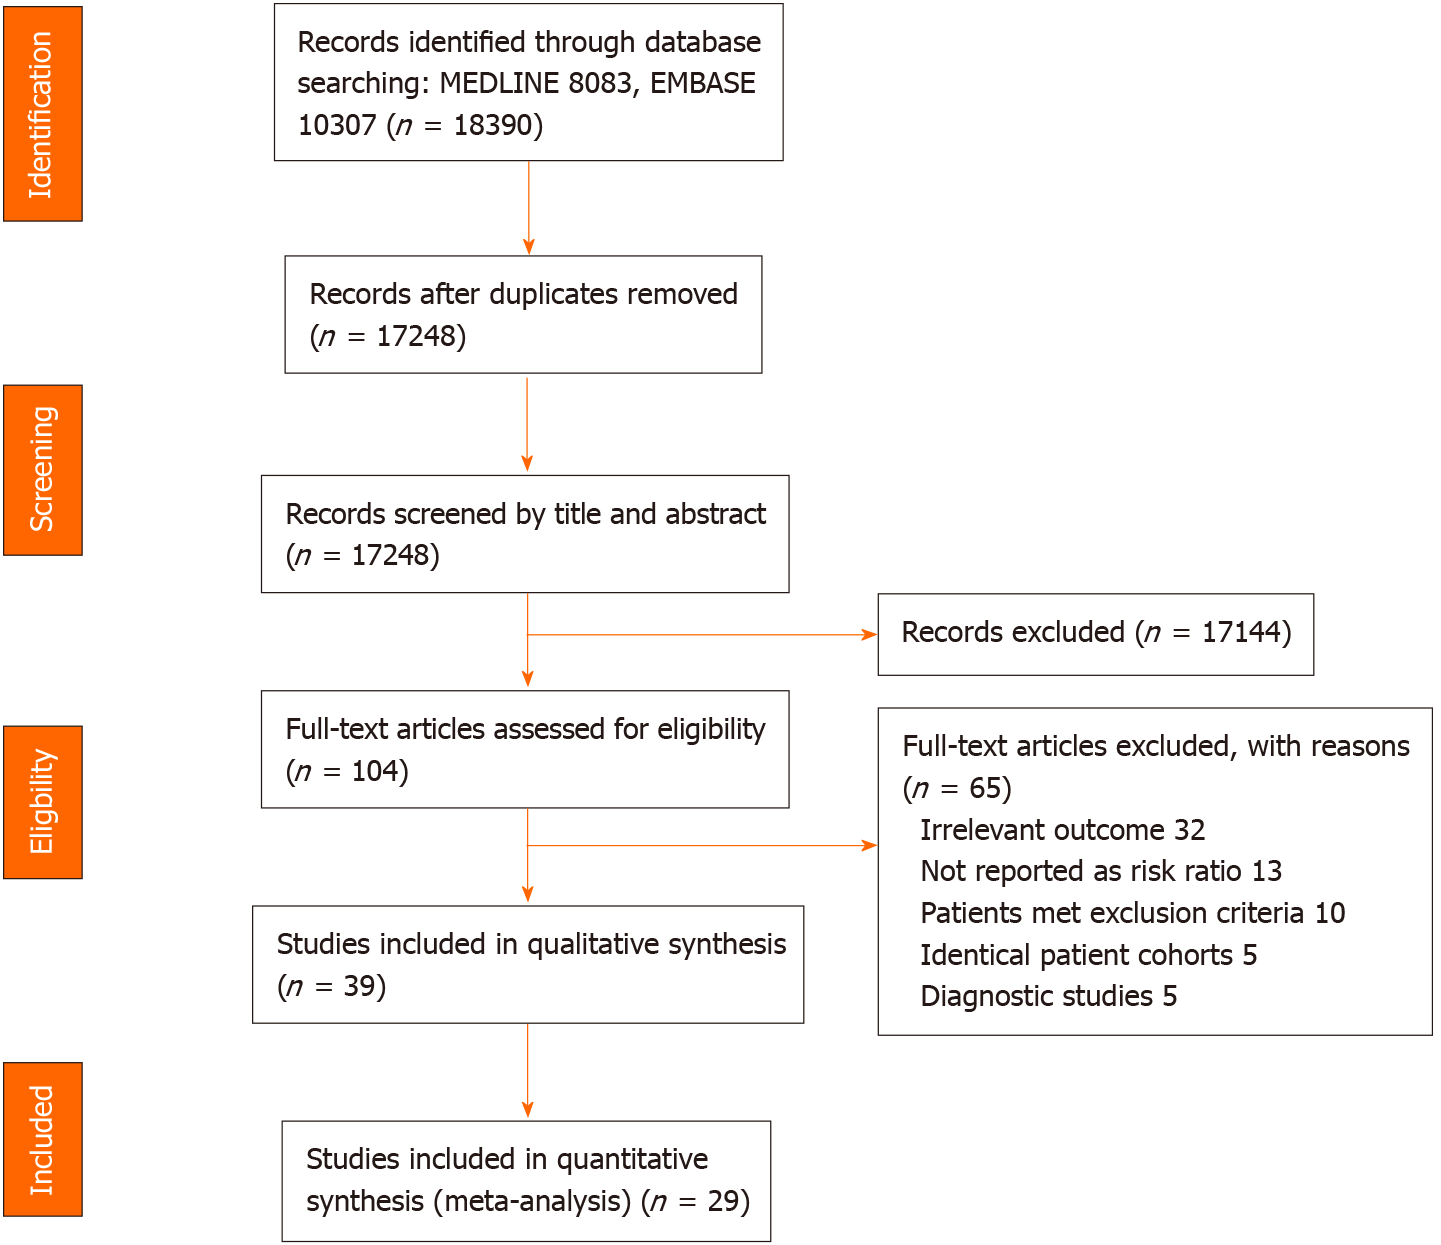
Figure 1 Flow diagram of search methodology and selection process.
Figure 2 Unadjusted and adjusted hazard ratios of fibrosis-4 index (A), aspartate aminotransferase to platelet ratio score (B), liver stiffness measurement (C), and hepatocellular carcinoma risk.
1Cirrhosis and direct acting antiviral-treated cohort. 2Cirrhosis and interferon-treated cohort. 3Non-cirrhotic and direct acting antiviral-treated cohort. 4Non-cirrhotic and interferon-treated cohort. 5Sustained virologic response cohort. 6Non-sustained virologic response cohort. DAA: Direct-acting antiviral; FIB-4: Fibrosis-4 index; pegIFN/RBV: Pegylated interferon and ribavirin; SVR: Sustained virologic response.
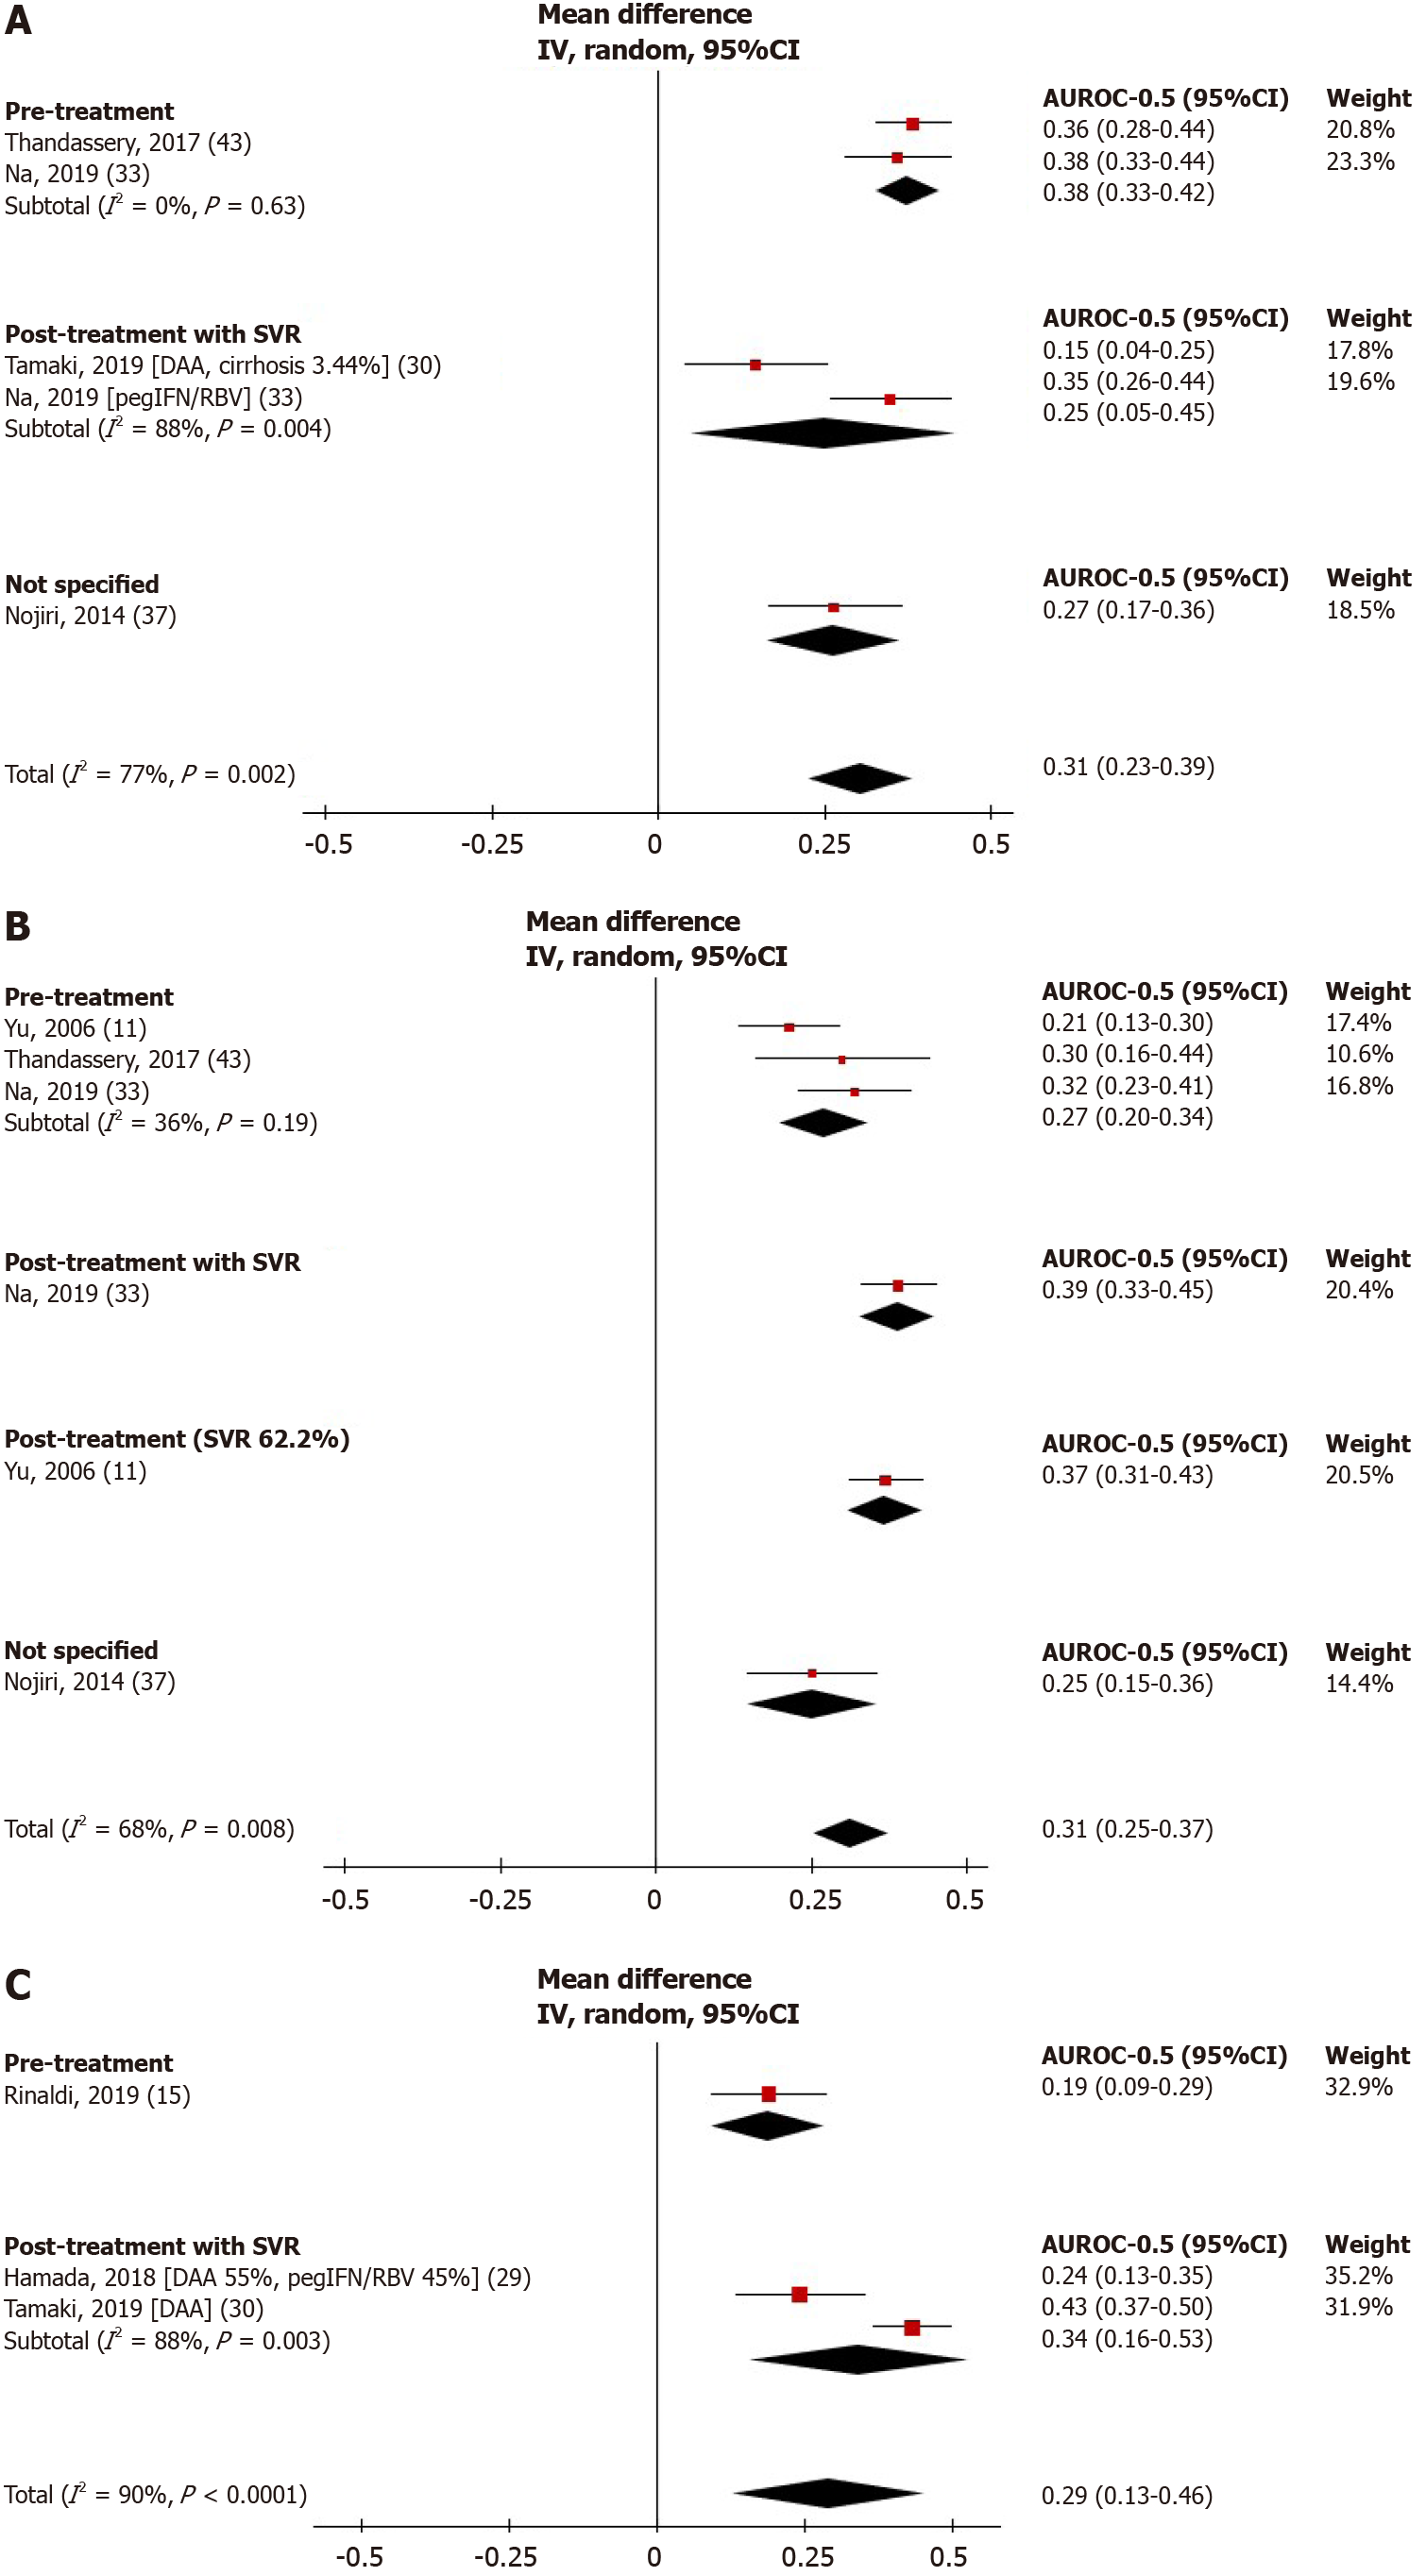
Figure 3 Forest plots showing hepatocellular carcinoma predictive performance vs random of fibrosis-4 (A), random of aspartate aminotransferase to platelet ratio (B), and random of liver stiffness measurement (C).
DAA: Direct-acting antiviral; FIB-4: Fibrosis-4 index; pegIFN/RBV: Pegylated interferon and ribavirin; SVR: Sustained virologic response. APRI: Aspartate aminotransferase to platelet ratio index; LSM: Liver stiffness measurement.
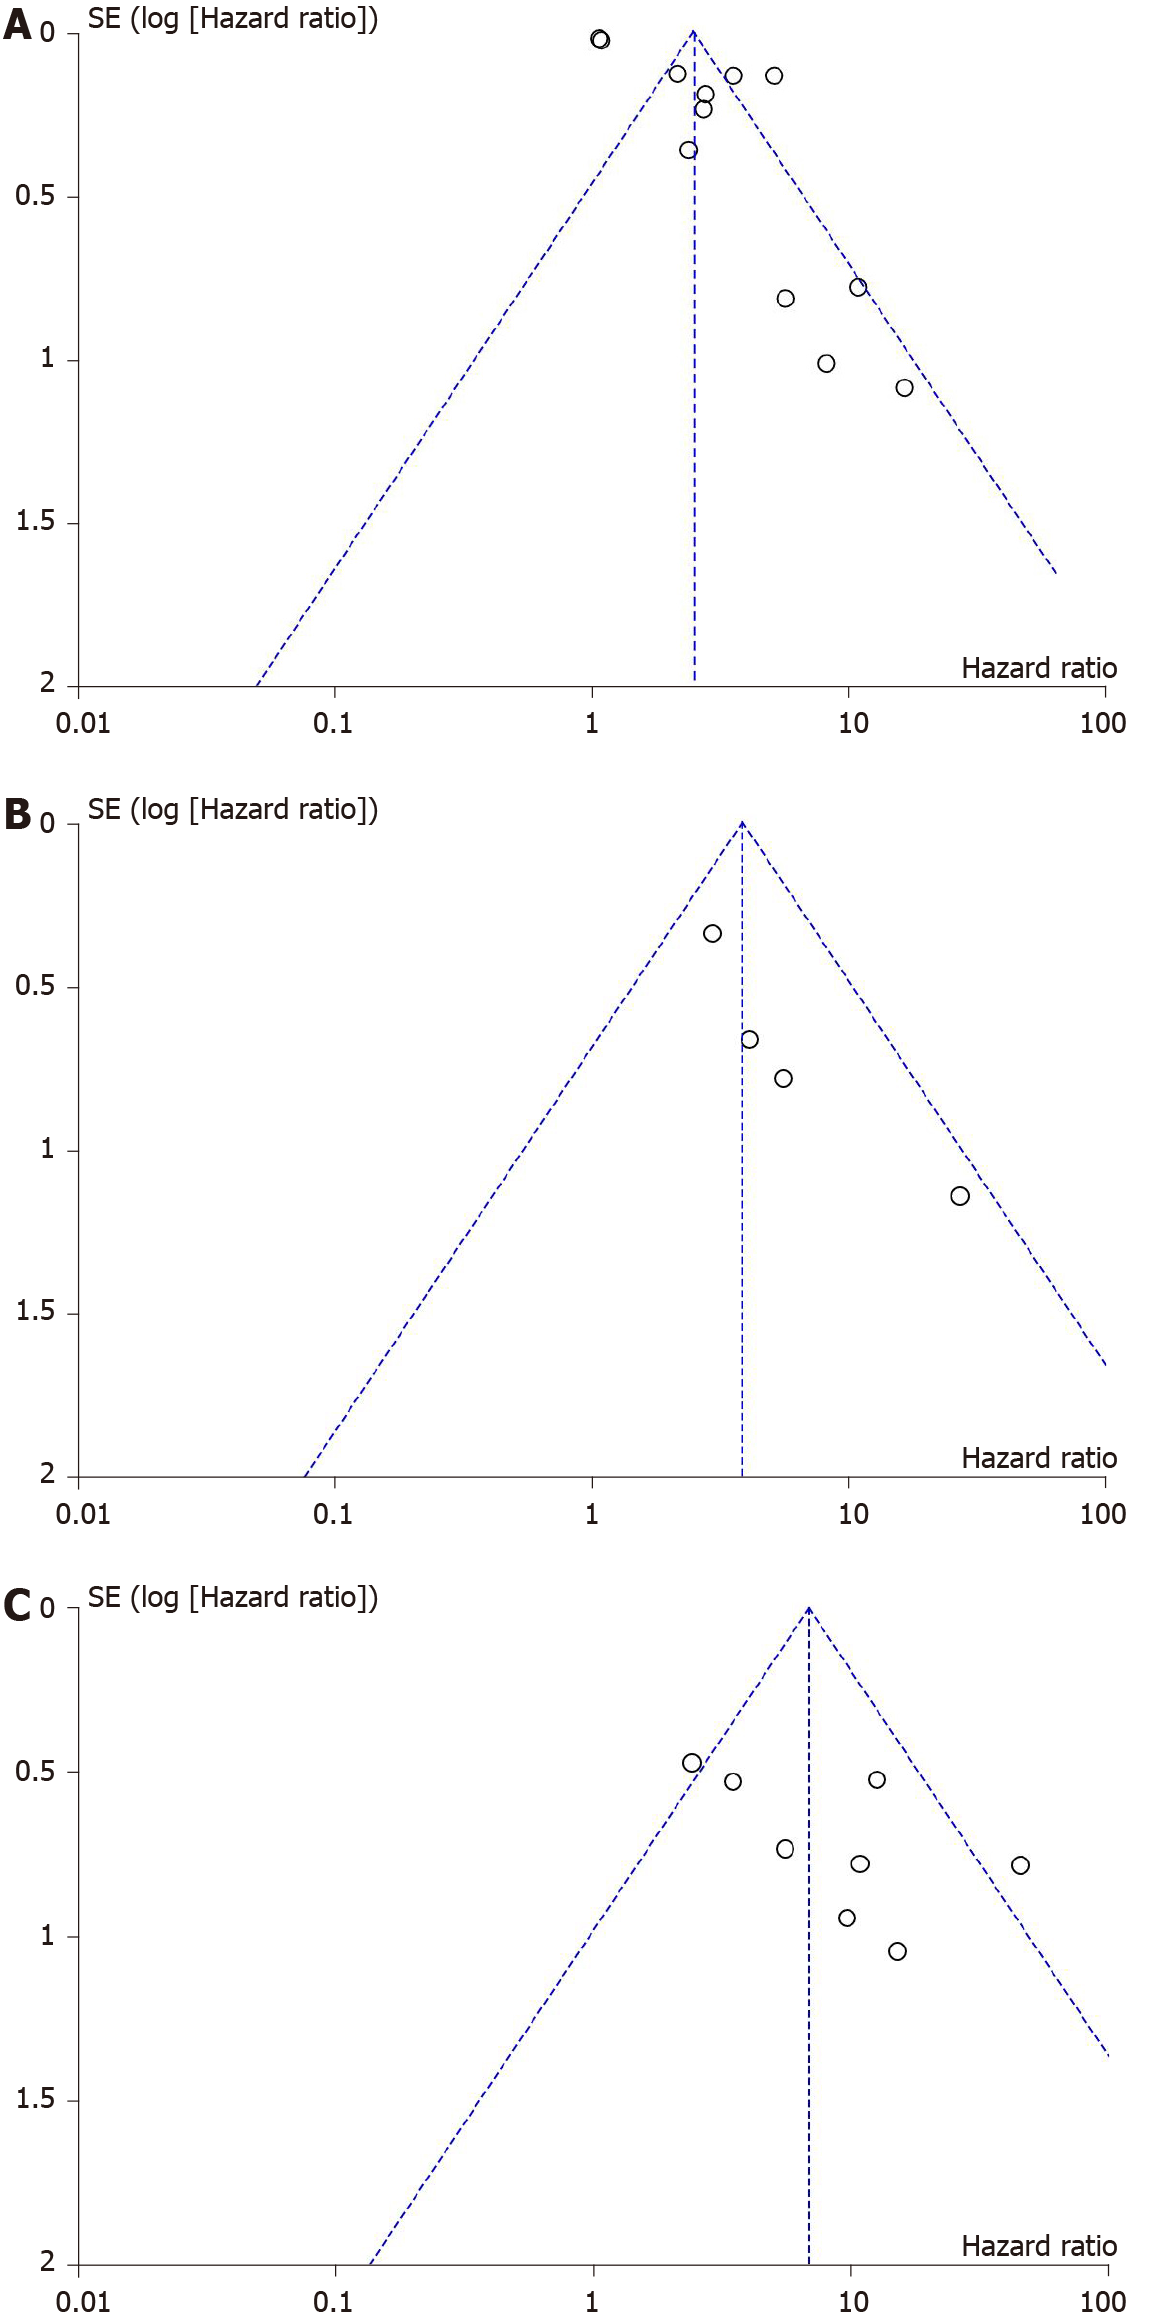
Figure 4 Funnel plots for adjusted hazard ratios of Fibrosis-4 (A), aspartate aminotransferase to platelet ratio (B), and liver stiffness measurement (C) for the evaluation of hepatocellular carcinoma development.
- Citation: Yongpisarn T, Thimphitthaya C, Laoveeravat P, Wongjarupong N, Chaiteerakij R. Non-invasive tests for predicting liver outcomes in chronic hepatitis C patients: A systematic review and meta-analysis. World J Hepatol 2021; 13(8): 949-968
- URL: https://www.wjgnet.com/1948-5182/full/v13/i8/949.htm
- DOI: https://dx.doi.org/10.4254/wjh.v13.i8.949


