Copyright
©The Author(s) 2021.
World J Hepatol. Mar 27, 2021; 13(3): 384-392
Published online Mar 27, 2021. doi: 10.4254/wjh.v13.i3.384
Published online Mar 27, 2021. doi: 10.4254/wjh.v13.i3.384
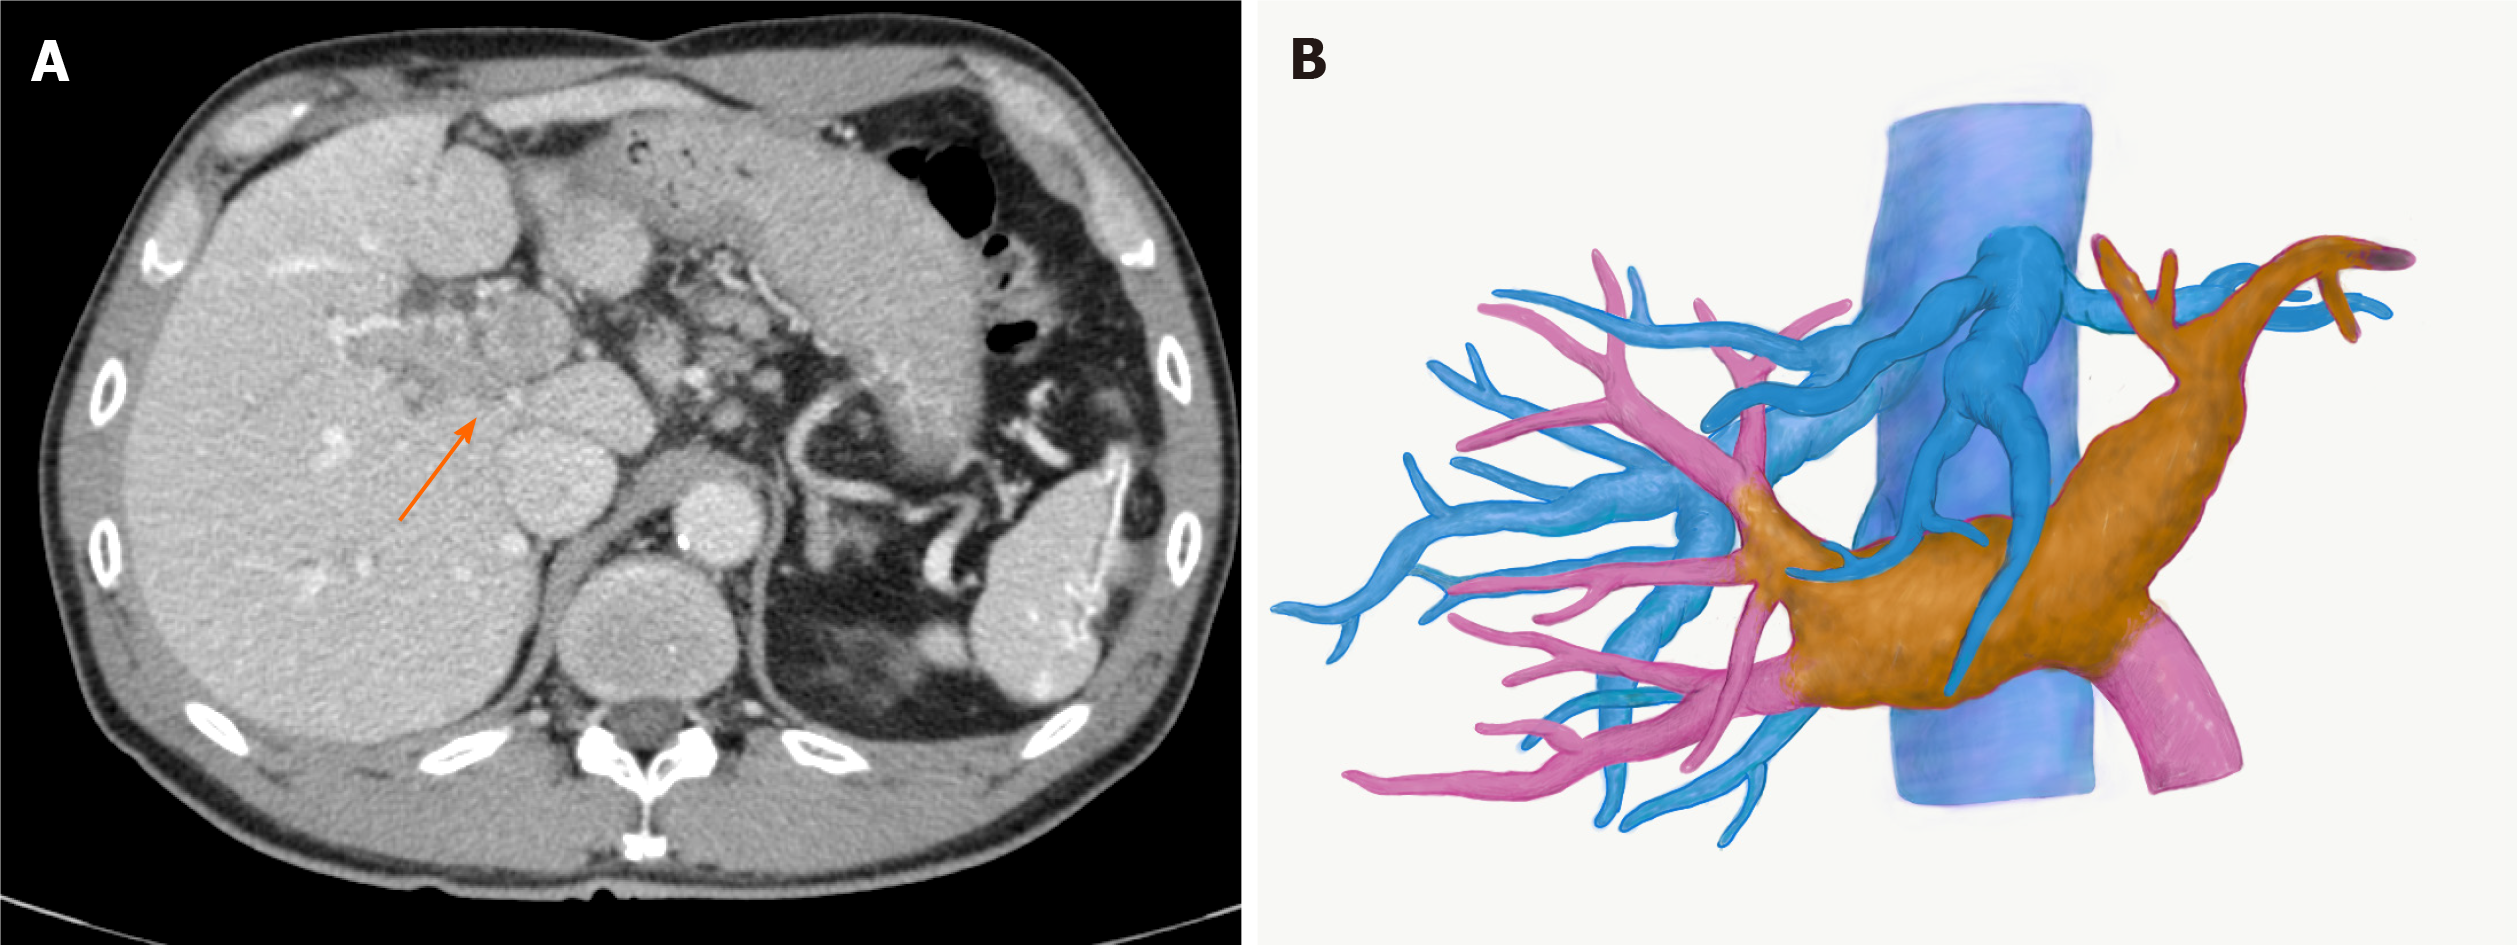
Figure 1 Images of hepatocellular carcinoma with portal vein tumour thrombus before lenvatinib treatment.
A: Computed tomography image. An arrow indicates portal vein tumour thrombus; B: Three-dimensional image. The yellow mass demonstrates a viable portal vein tumour thrombus, extending to the contralateral third portal branch.
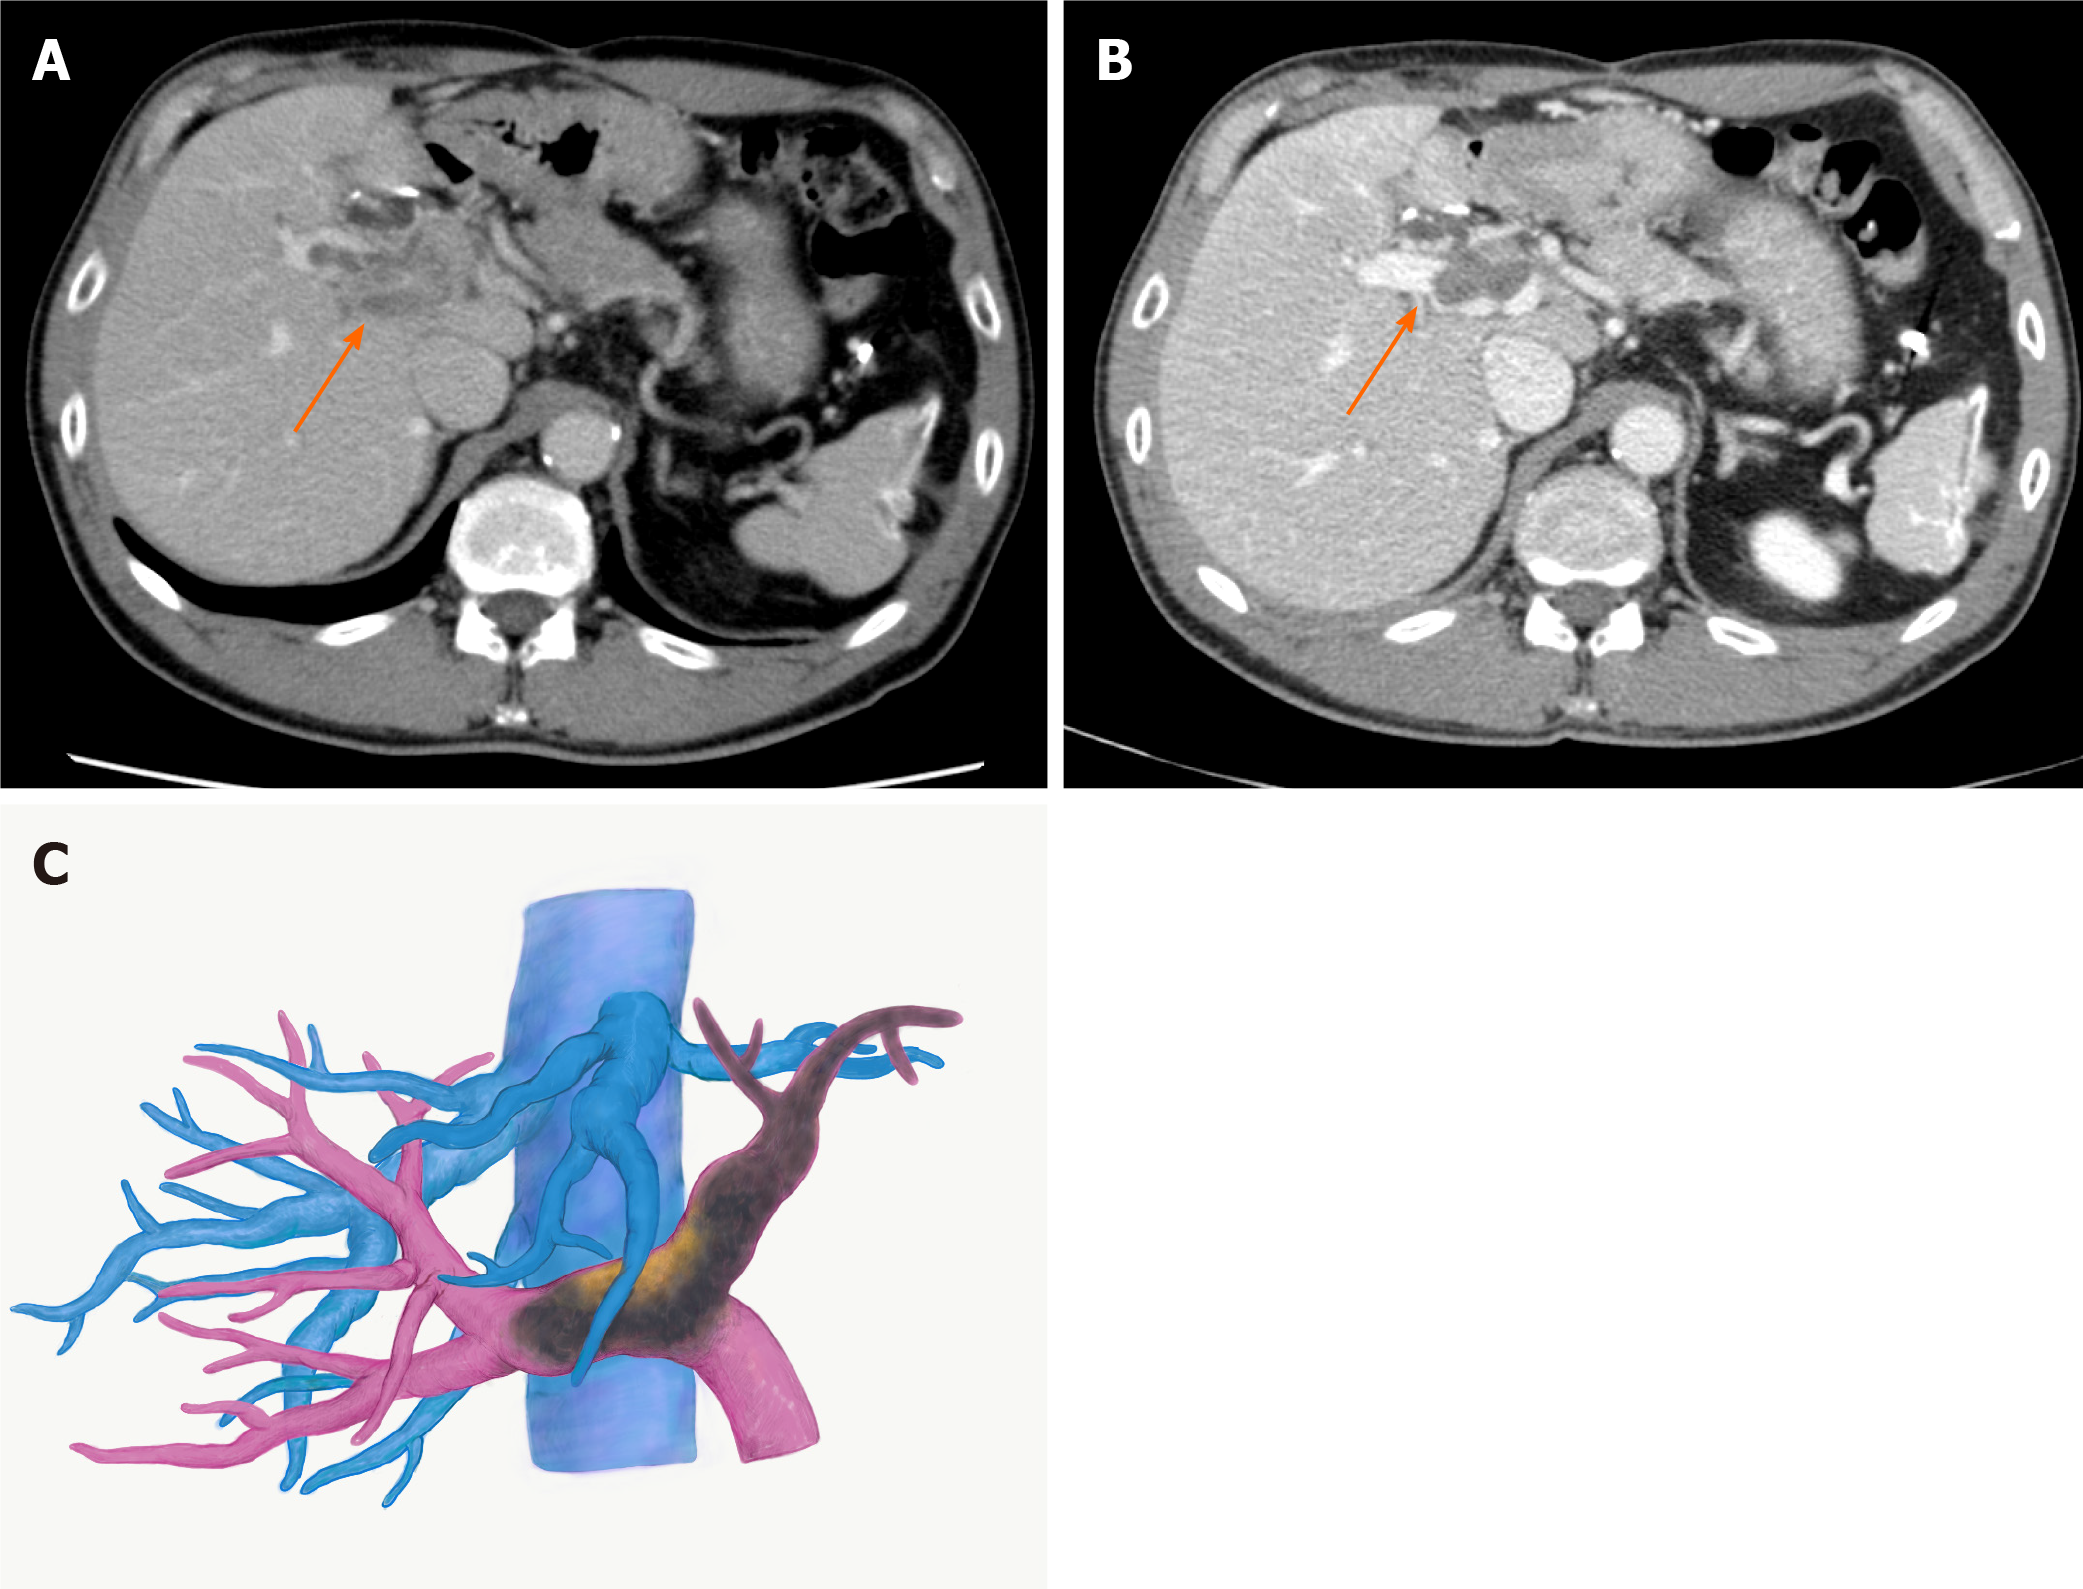
Figure 2 Images of hepatocellular carcinoma with portal vein tumour thrombus after lenvatinib treatment.
A: Computed tomography image two weeks after the treatment. The portal vein tumour thrombus (PVTT) showed regression with partial disappearance of contrast enhancement; B: Computed tomography image three months after the treatment; C: Three-dimensional image three months after the treatment. The PVTT regressed to the contralateral first-order branch with loss of contrast enhancement. Arrows indicate PVTT.
Figure 3 Portal vein tumour thrombus thrombectomy.
A: The right and the main portal veins were clamped by Satinsky forceps. Venotomy was placed at the bifurcation of the left portal vein; B: The portal vein tumour thrombus was thrombectomized; C: The left portal vein stump was closed by 6-0 proline.
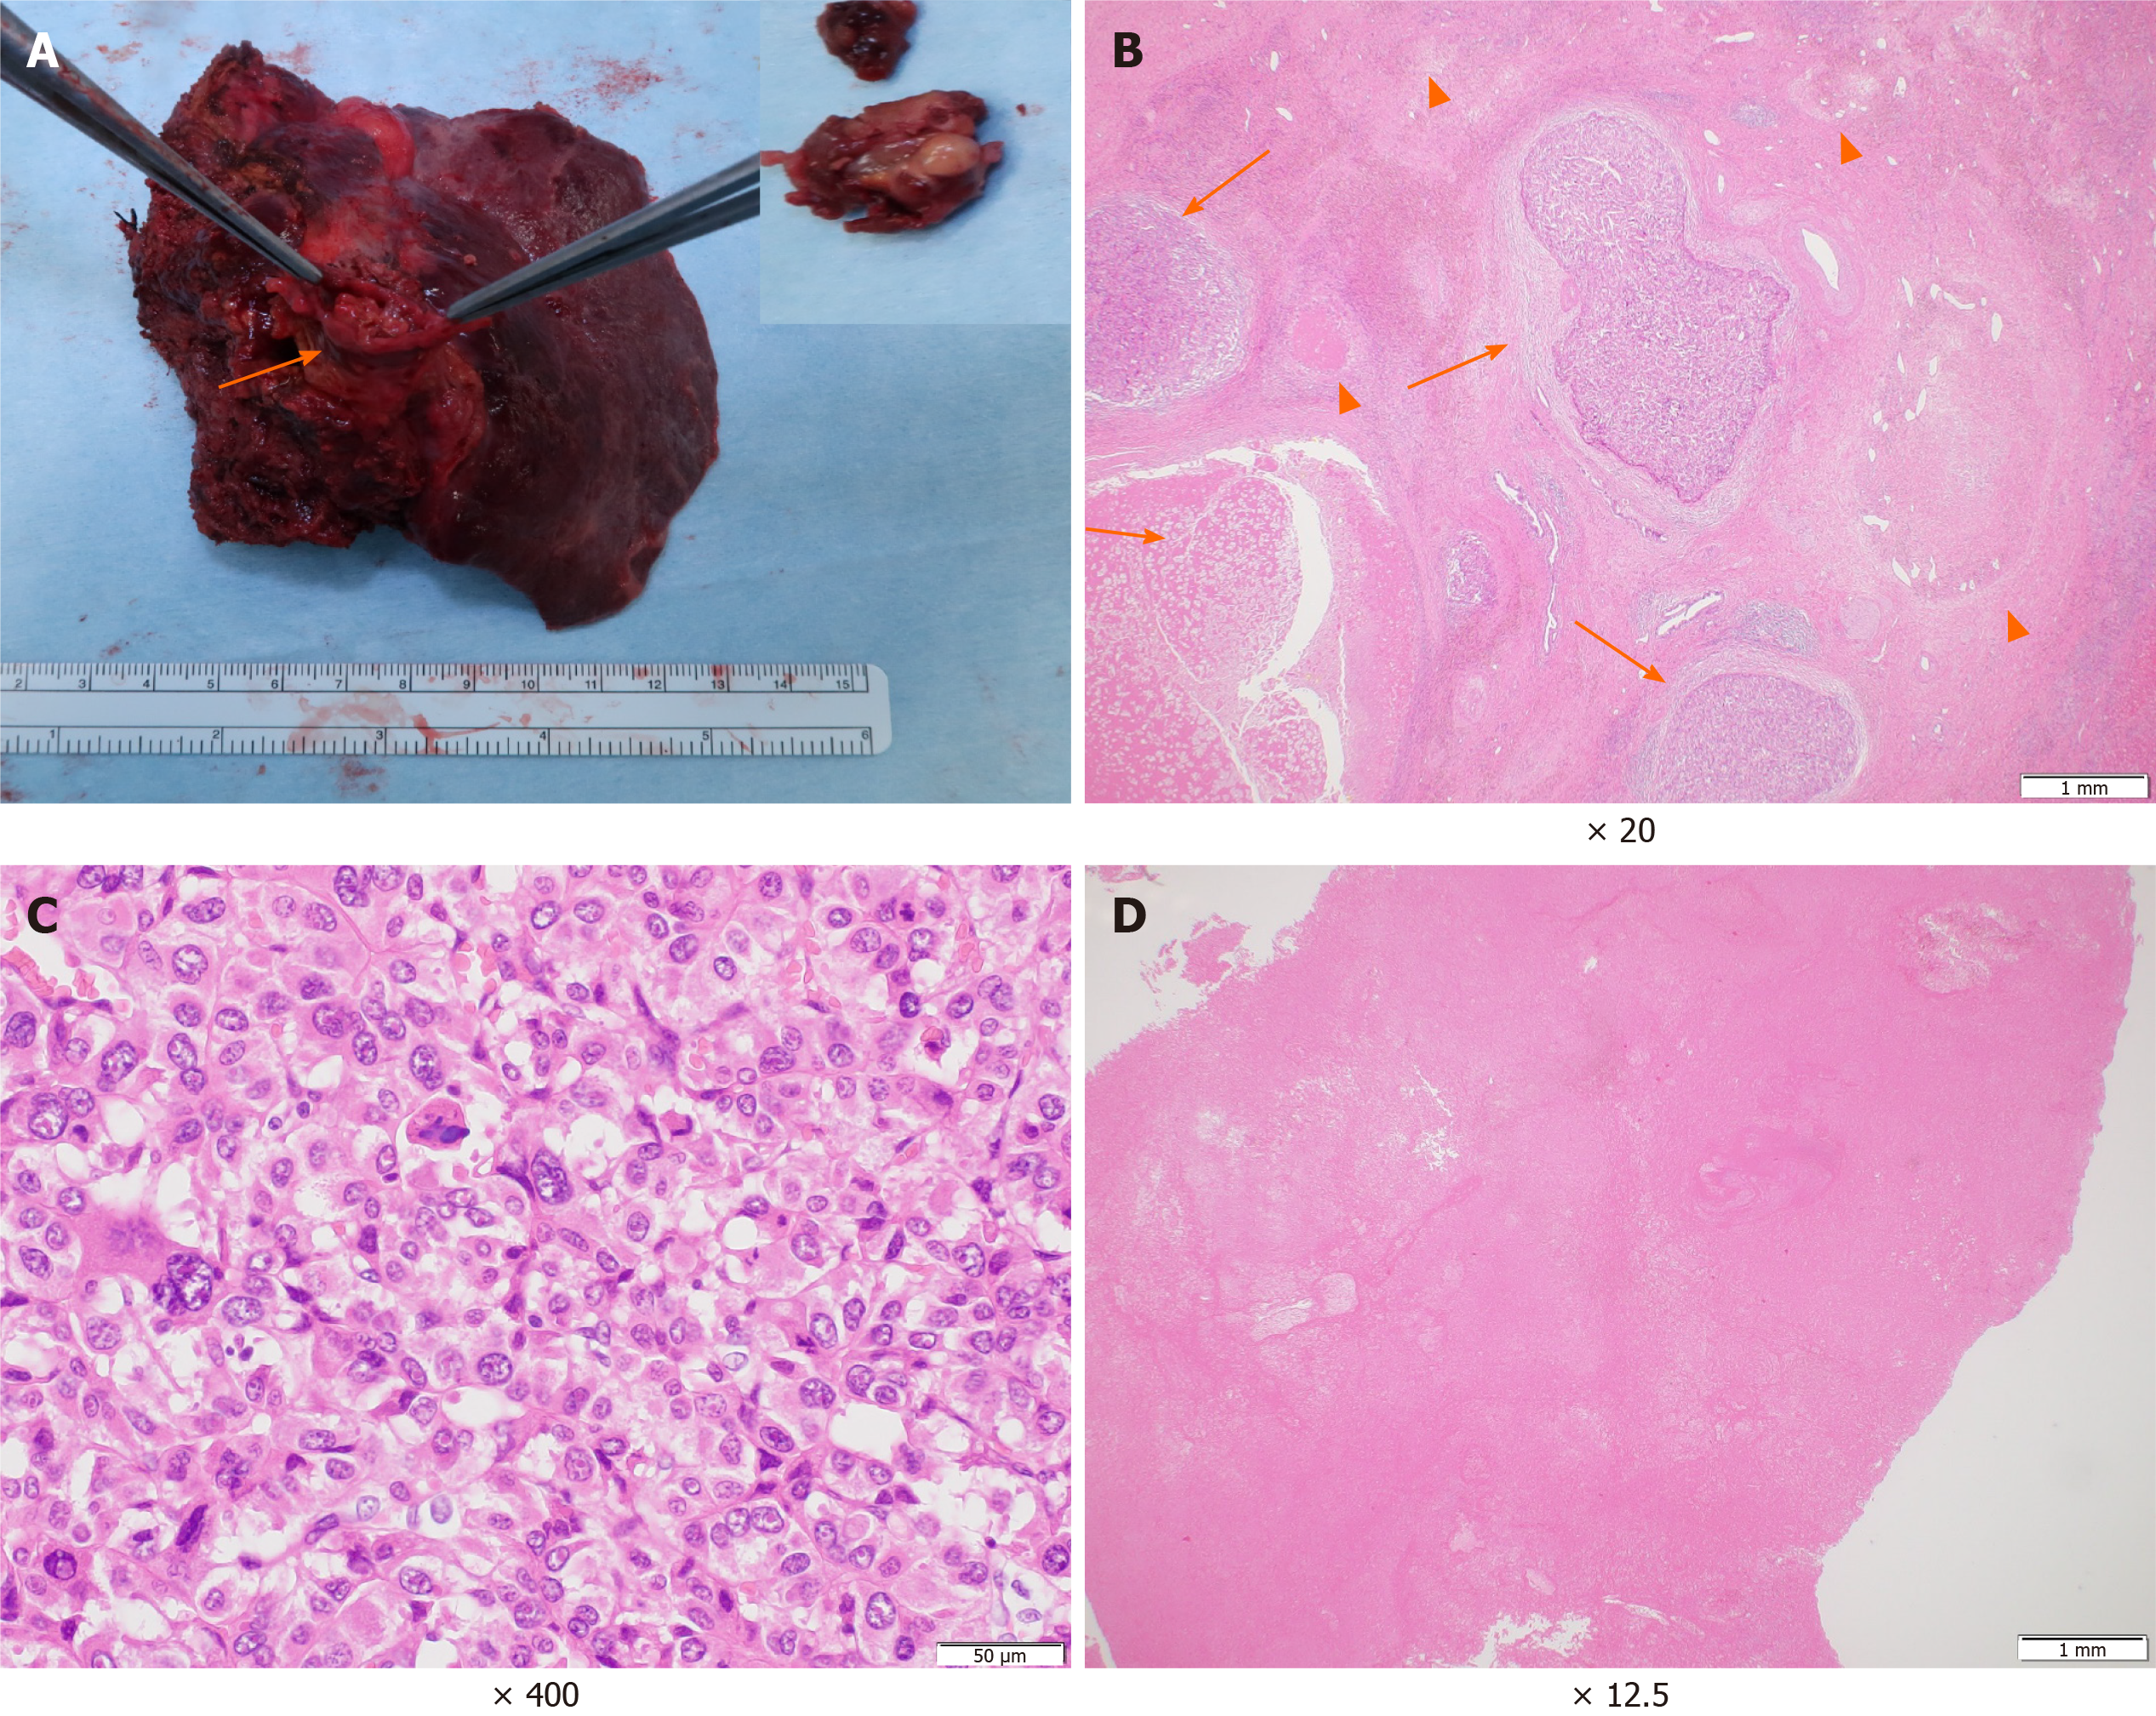
Figure 4 Macroscopic and microscopic findings of the main tumour and the portal vein tumour thrombus.
A: A white to brownish nodule was found in the left portal vein (arrows). Inlet: close-up picture of the removed portal vein tumour thrombus; B: The primary lesion showed severe fibrotic change with haemosiderin deposition. In the fibrosis, the viable tumour cell nests (arrow) and the necrotic tumour lesions (arrowhead) were scattered; C: High magnification demonstrated moderately to poorly differentiated tumour cells; D: Most of the portal vein tumour thrombus showed necrotic changes.
- Citation: Takahashi K, Kim J, Takahashi A, Hashimoto S, Doi M, Furuya K, Hashimoto R, Owada Y, Ogawa K, Ohara Y, Akashi Y, Hisakura K, Enomoto T, Shimomura O, Noguchi M, Oda T. Conversion hepatectomy for hepatocellular carcinoma with main portal vein tumour thrombus after lenvatinib treatment: A case report. World J Hepatol 2021; 13(3): 384-392
- URL: https://www.wjgnet.com/1948-5182/full/v13/i3/384.htm
- DOI: https://dx.doi.org/10.4254/wjh.v13.i3.384


