Copyright
©The Author(s) 2021.
World J Hepatol. Feb 27, 2021; 13(2): 218-232
Published online Feb 27, 2021. doi: 10.4254/wjh.v13.i2.218
Published online Feb 27, 2021. doi: 10.4254/wjh.v13.i2.218
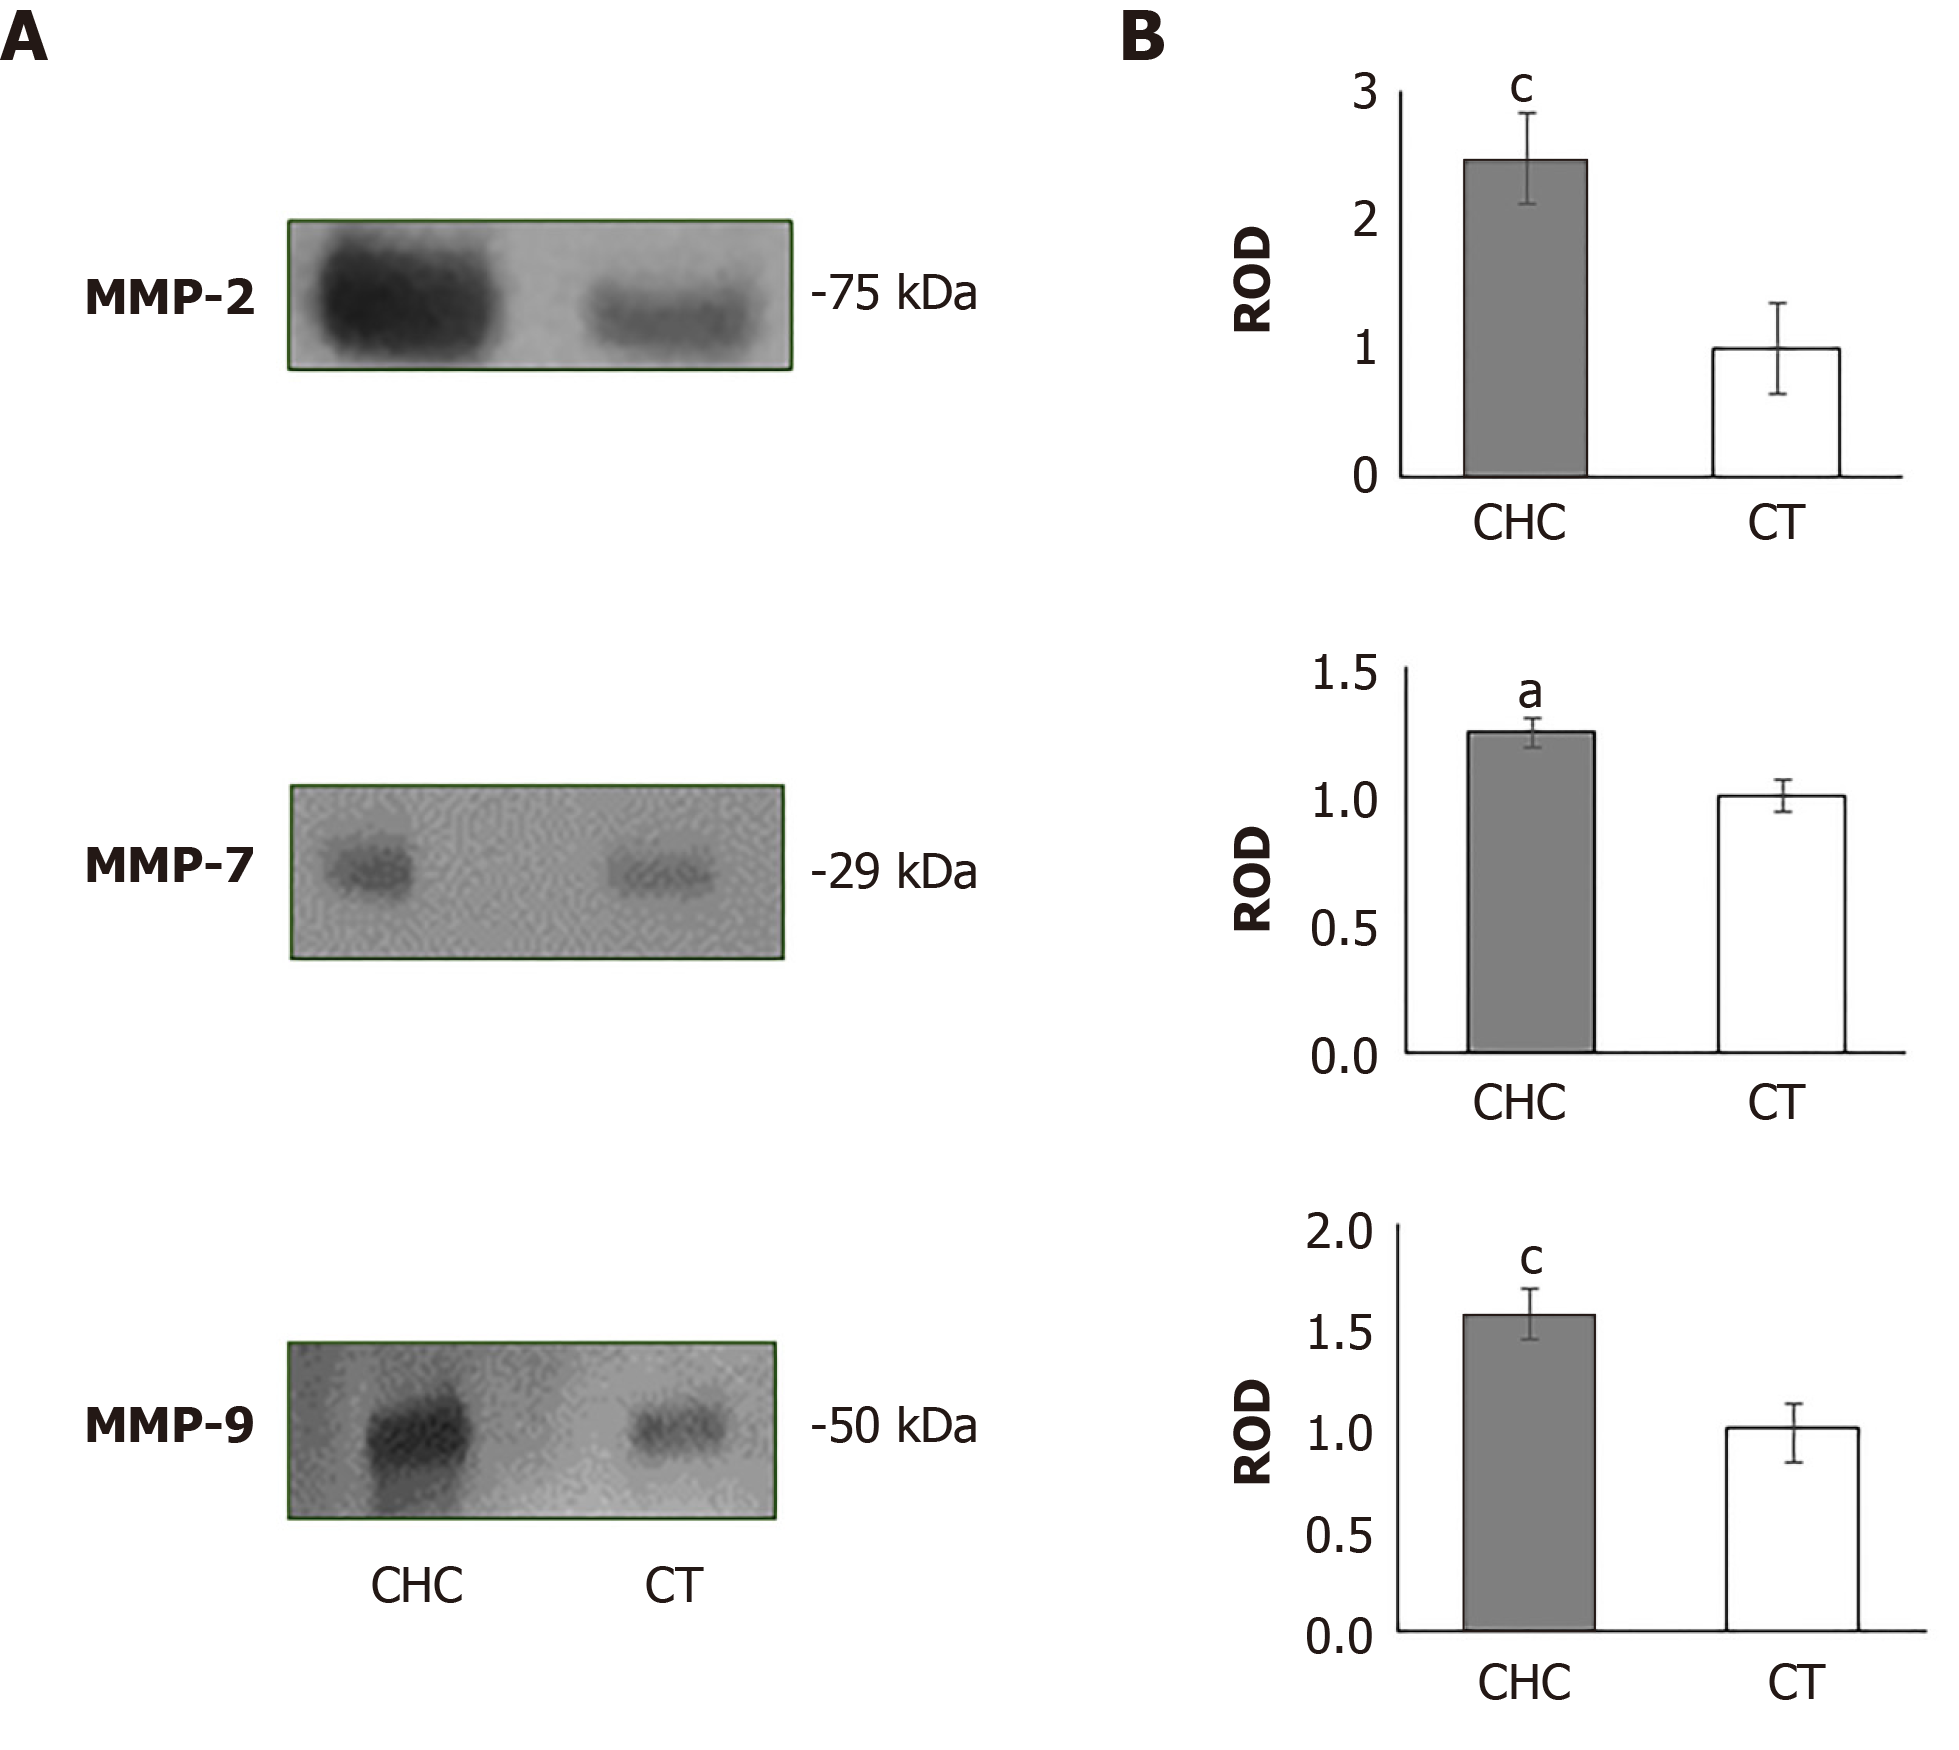
Figure 1 Matrix metalloproteinase-2, -7 and -9 determination in serum.
A: Detection of bands at 75, 29 and 50 kDa in chronic hepatitis C (CHC) patients and healthy individuals corresponding to matrix metalloproteinase (MMP)-2, MMP-7 and MMP-9, respectively; B: Densitometric analysis of each of the MMPs in the patients (gray bars) and the control (CT) group (white bars) expressed as relative optical density (ROD). Relative optical density analysis was performed using ImageJ software. Bars display the mean ± standard error of the mean of five independent assays of random samples from CHC samples and CT subjects. aP < 0.05; cP < 0.001.
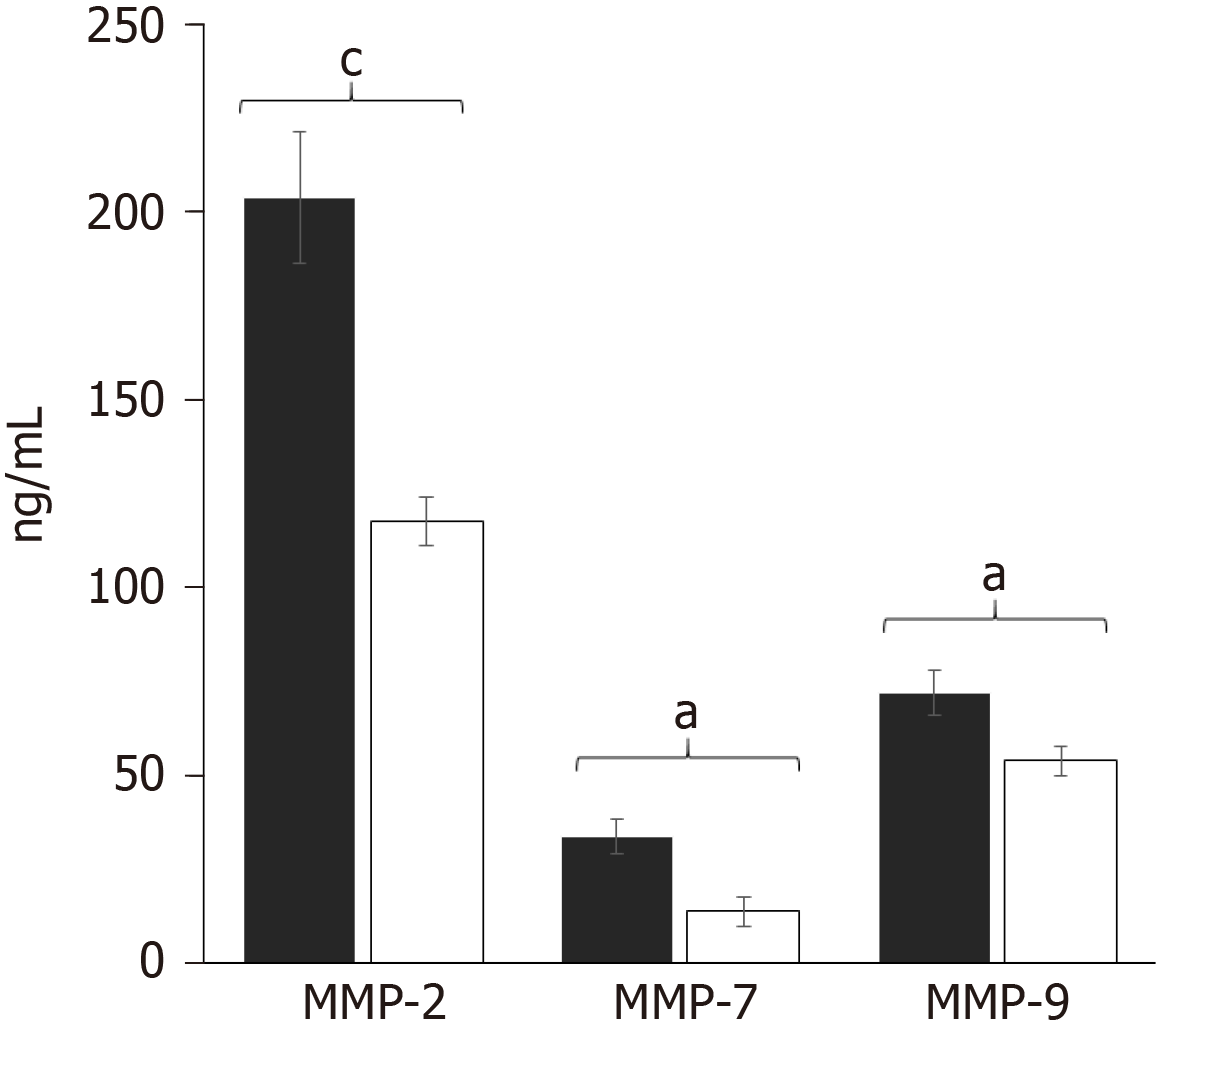
Figure 2 Matrix metalloproteinase concentrations in serum of chronic hepatitis C patients and healthy individuals.
The serum concentrations of matrix metalloproteinase (MMP)-2, -7 and-9 were simultaneously determined in chronic hepatitis C patients (black bars) and healthy subjects (white bars) by multiplex suspension array technology, and the values were expressed in ng/mL. Statistical differences were obtained through the Mann-Whitney U test. Data are expressed as mean ± standard error of the mean. aP < 0.05; cP < 0.001.
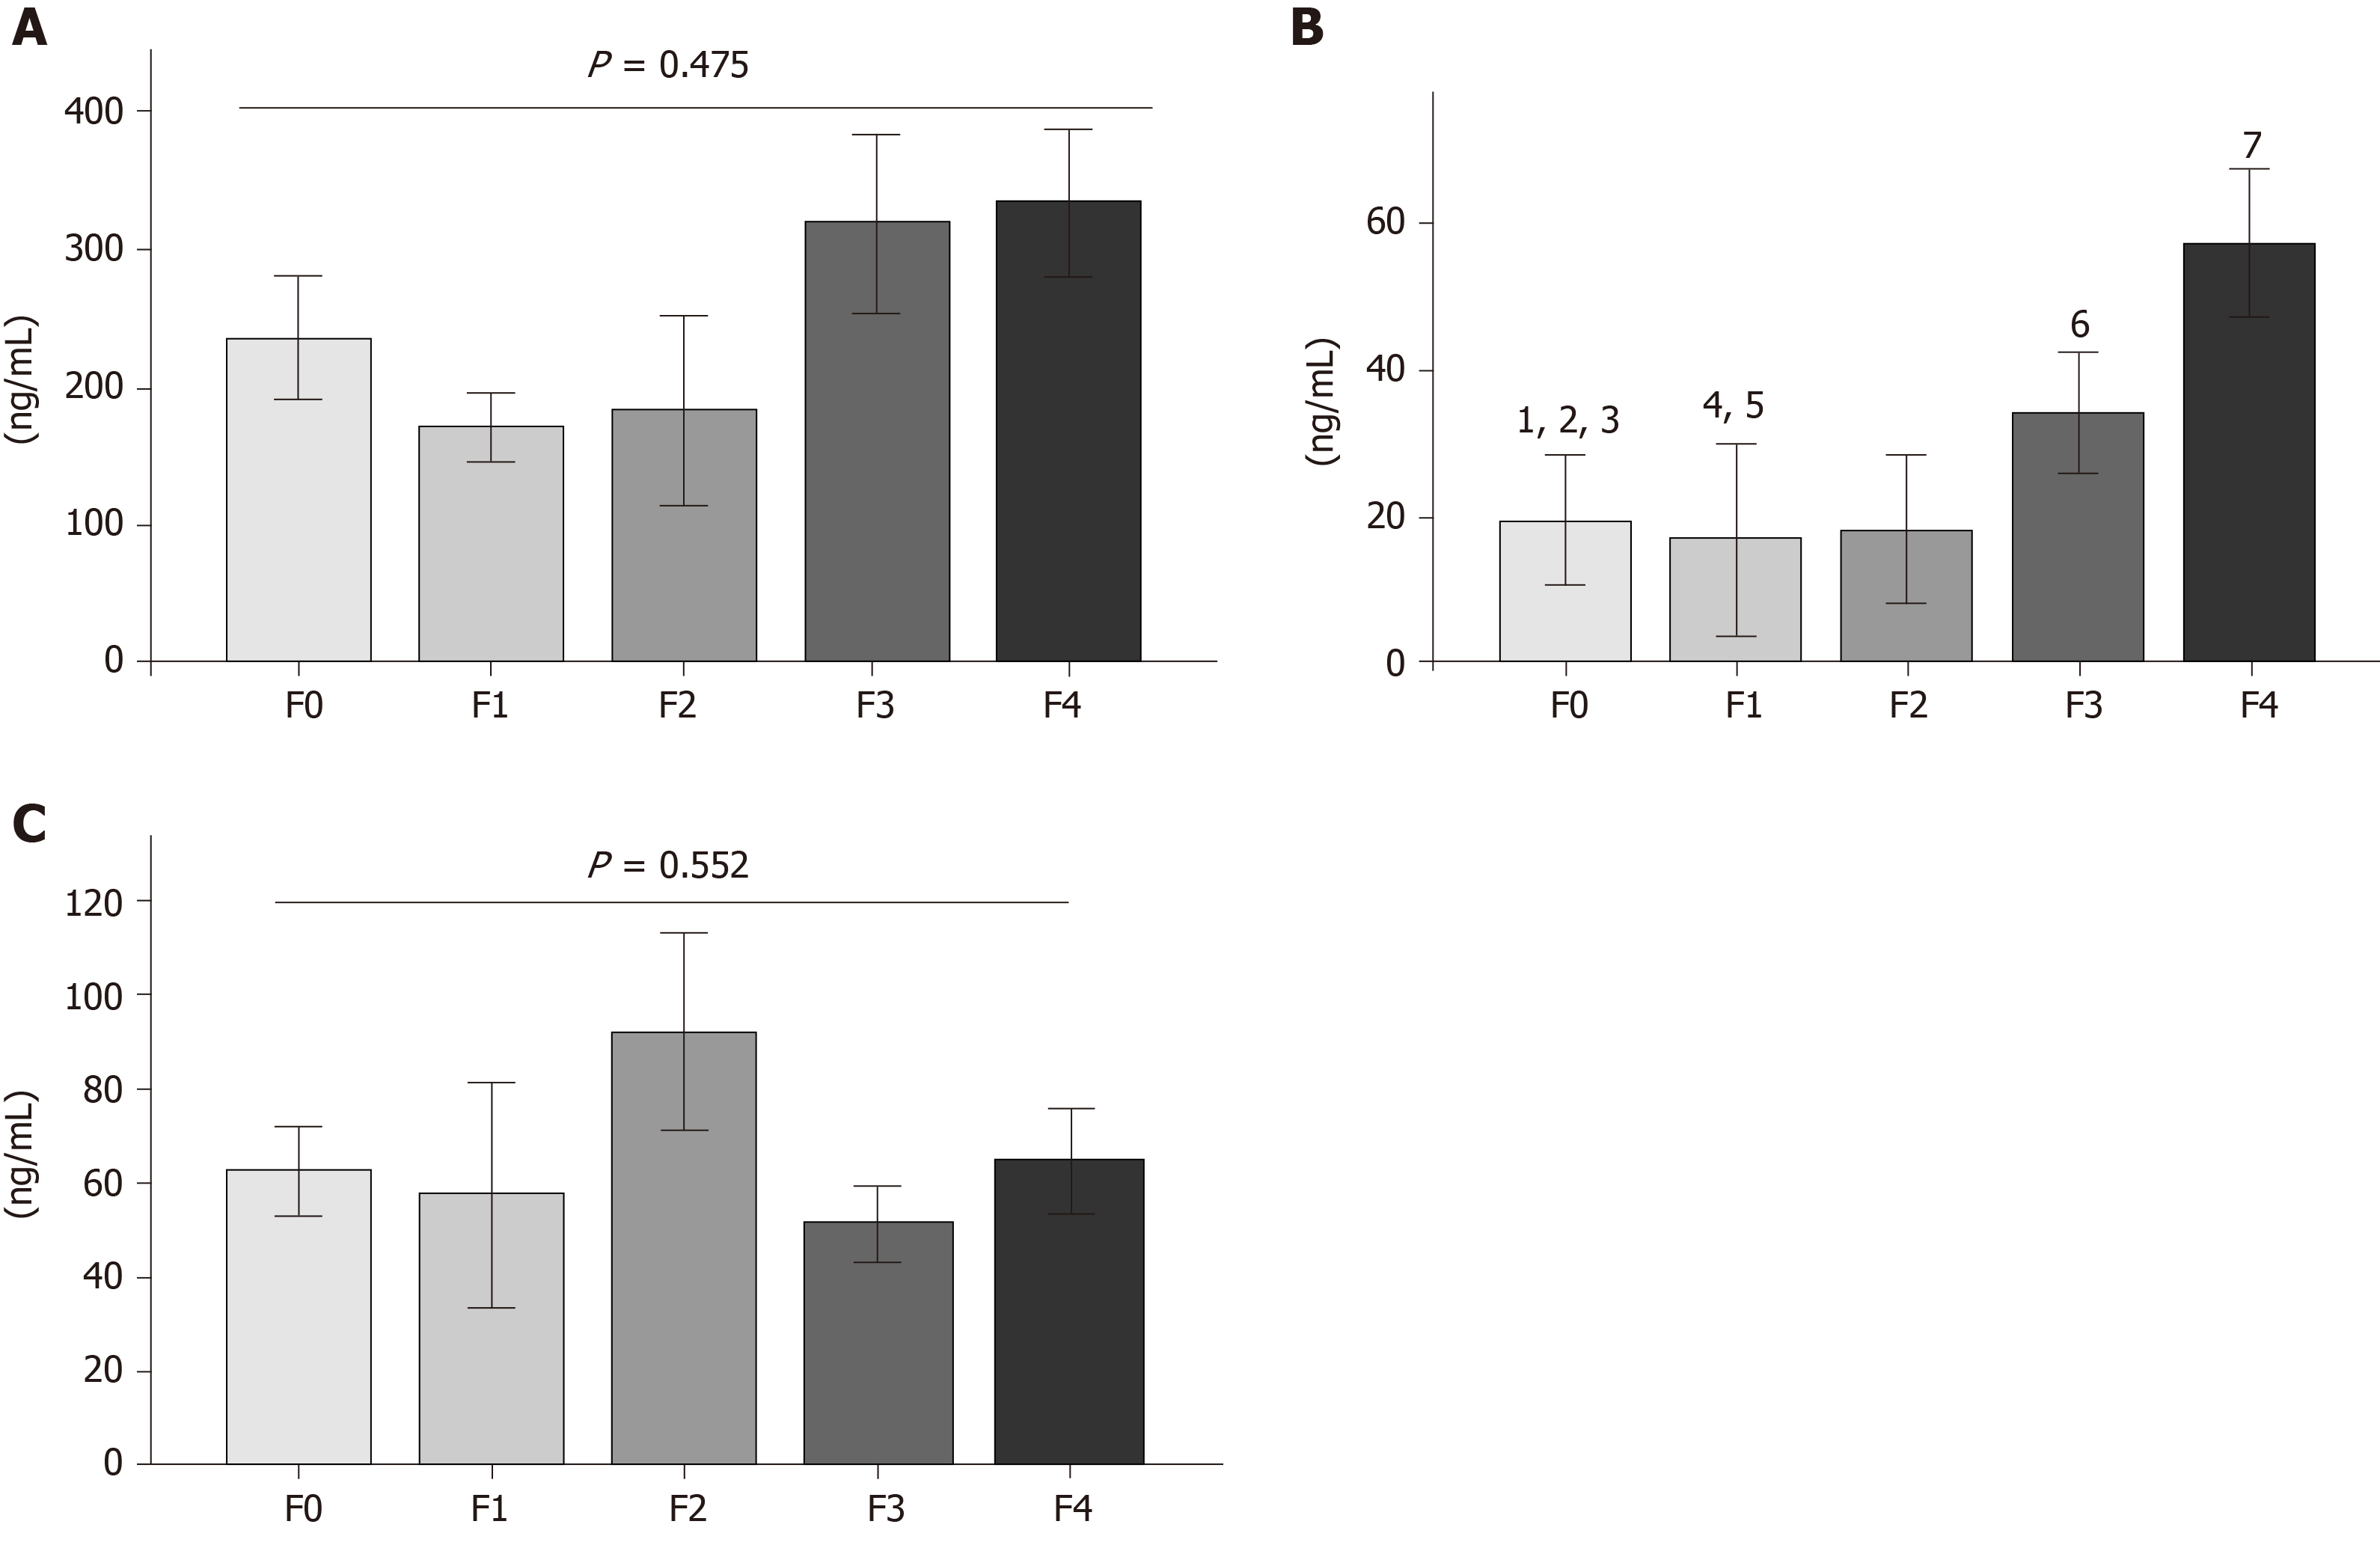
Figure 3 Matrix metalloproteinase productions according to fibrosis stage.
Serum concentrations of A: Matrix metalloproteinase (MMP)-2; B: MMP-7 and C: MMP-9 of chronic hepatitis C patients classified according to fibrosis grades F0, F1, F2, F3 and F4. Statistical differences of MMP-7 were observed in 1 = F0 vs F1a; 2 = F0 vs F3b; 3 = F0 vs F4b; 4 = F1 vs F3b; 5 = F1 vs F4b; 6 = F2 vs F3a, 7 = F3 vs F4b. Data are expressed as mean ± standard error of the mean. aP < 0.05; bP < 0.01.
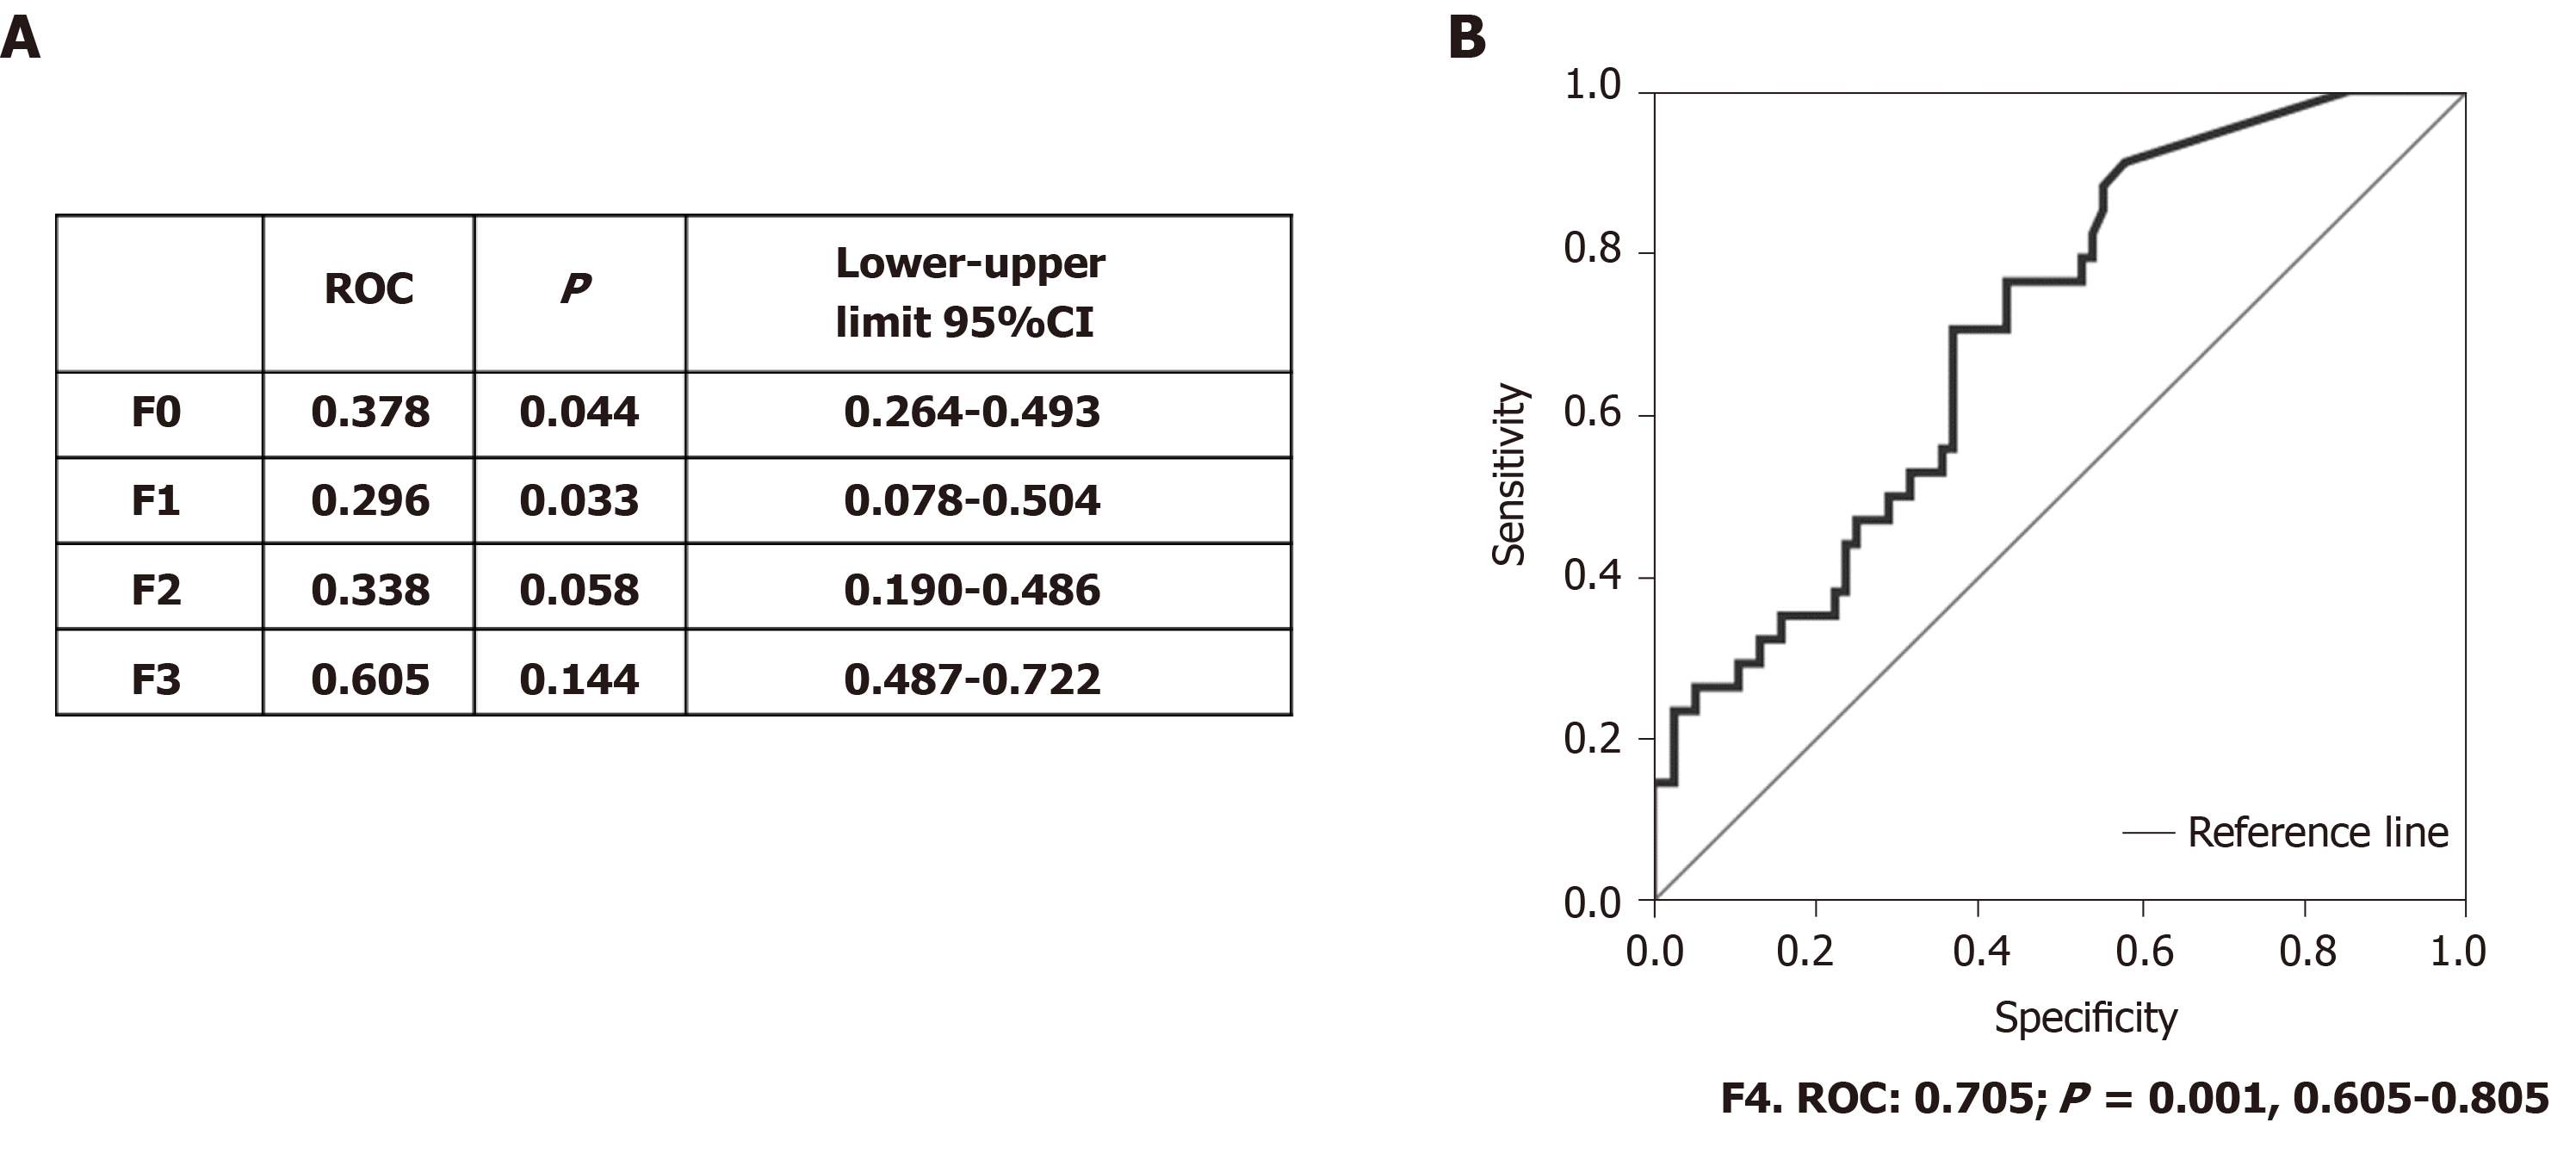
Figure 4 Area under the receiver operating characteristic analysis of matrix metalloproteinase-7 in the fibrosis stages.
A: Area under the receiver operating characteristic (ROC) values and lower and upper limits of matrix metalloproteinase (MMP)-7 in F0, F1, F2 and F3 were calculated; B: Area under the ROC curve of MMP-7 in F4; area under the ROC value, statistical significance and lower-upper limits are indicated. CI: Confidence interval.
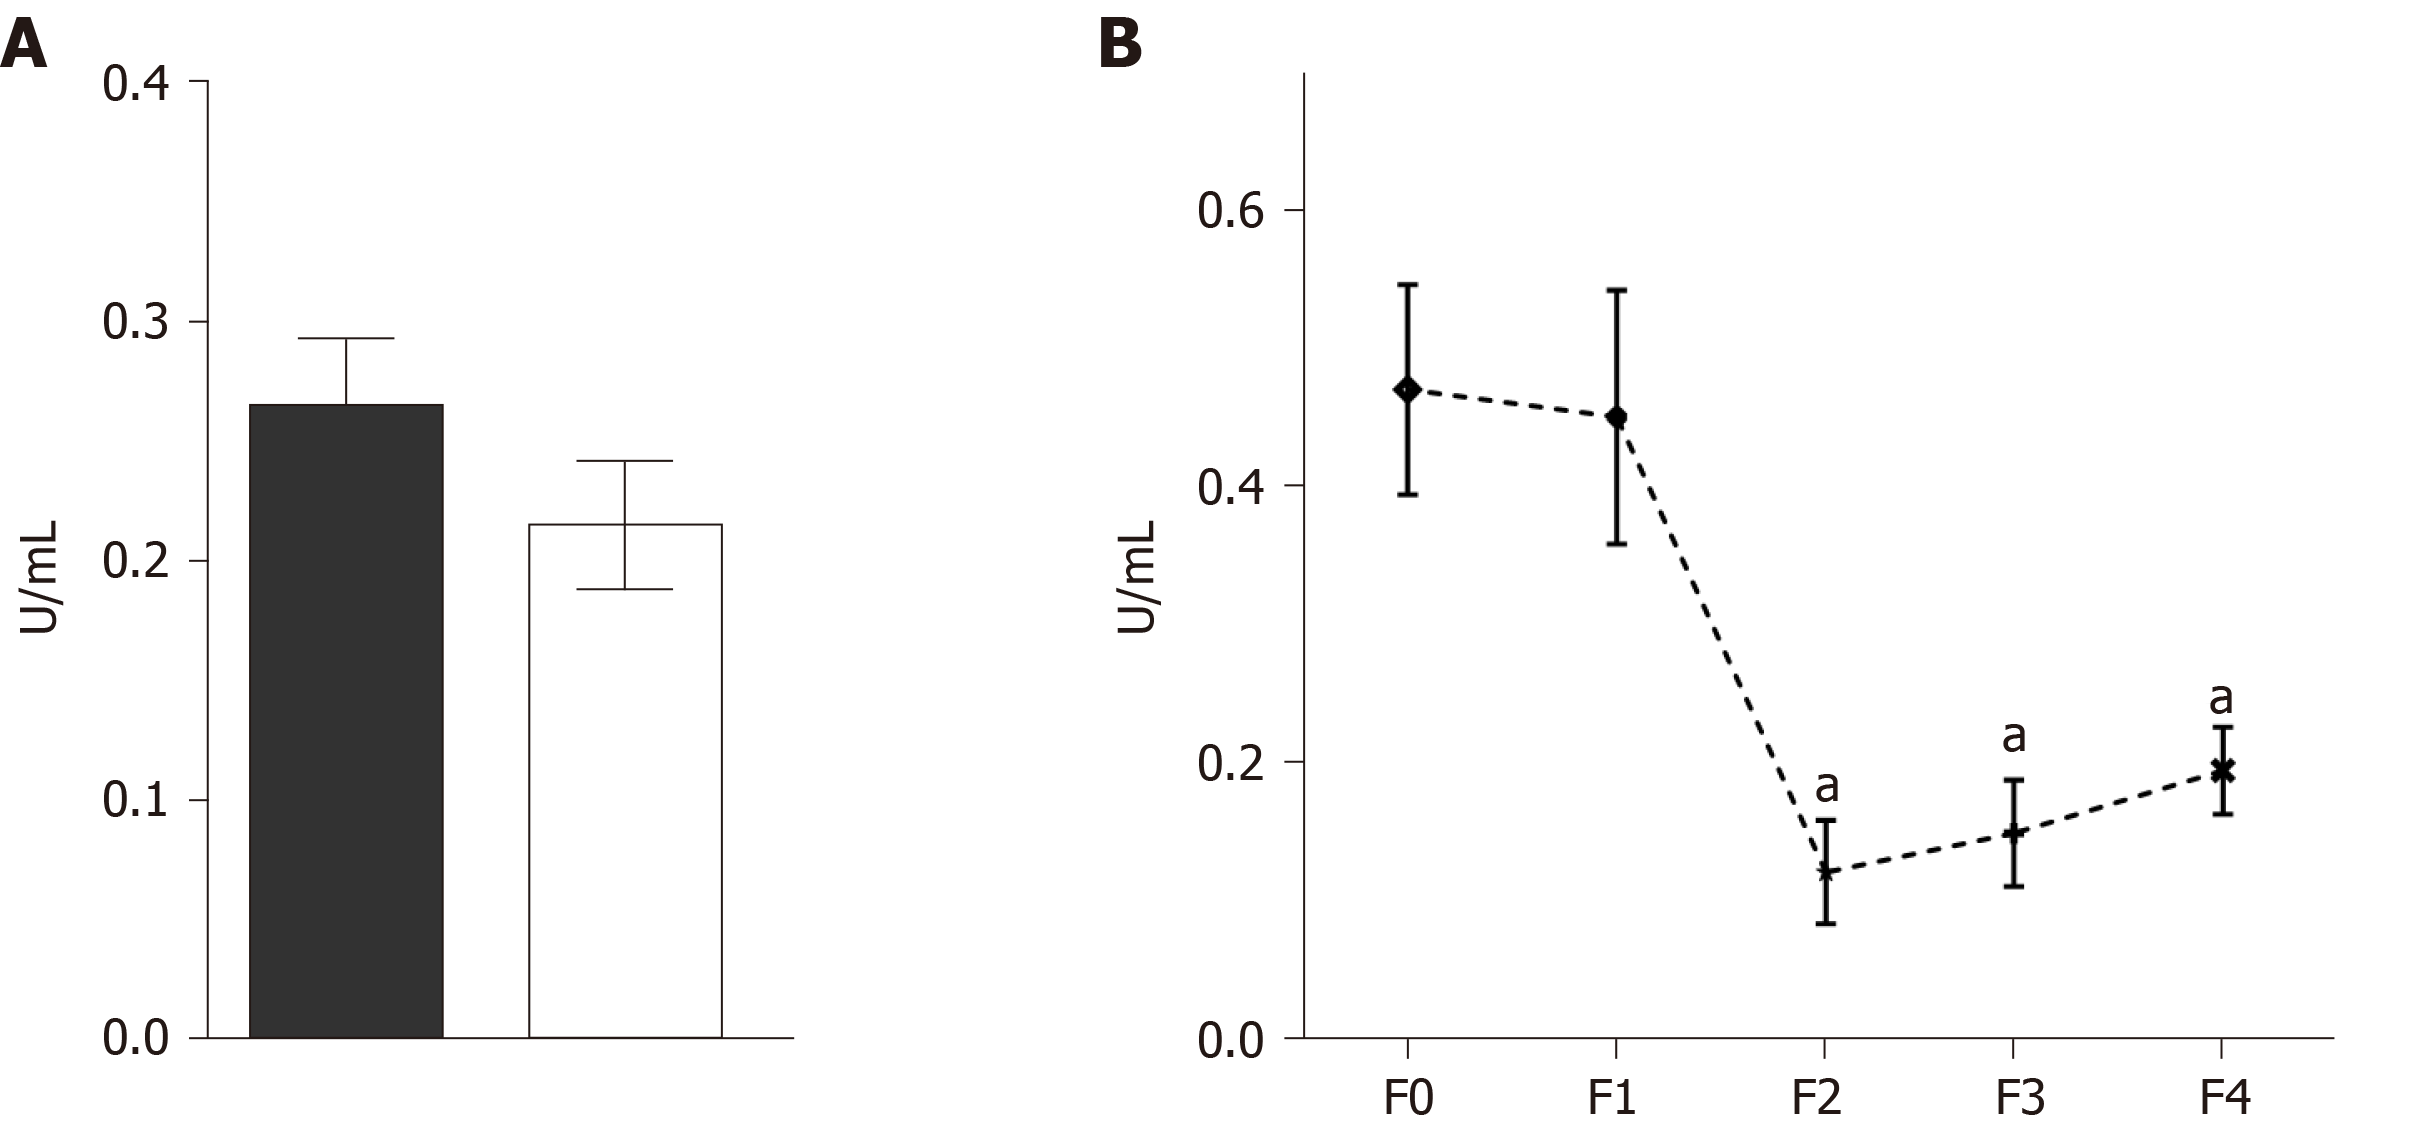
Figure 5 Collagenolytic matrix metalloproteinase activities in serum.
A: Representative degradation of the Azocoll substrate reflecting collagenolytic activity in the chronic hepatitis C (CHC) patients and controls (CTs); B: Representative enzymatic activity of the matrix metalloproteinases in F0, F1, F2, F3 and F4. Matrix metalloproteinase activation was carried out with a pH 9.0 buffer at 37 °C for 2 h. Absorbance was obtained through spectrophotometry at 520 nm, and the values were adjusted to the maximal activity reached by Clostridium histolyticum collagenase and expressed as U/mL. Bars are expressed as mean ± standard error of the mean. aP < 0.05.
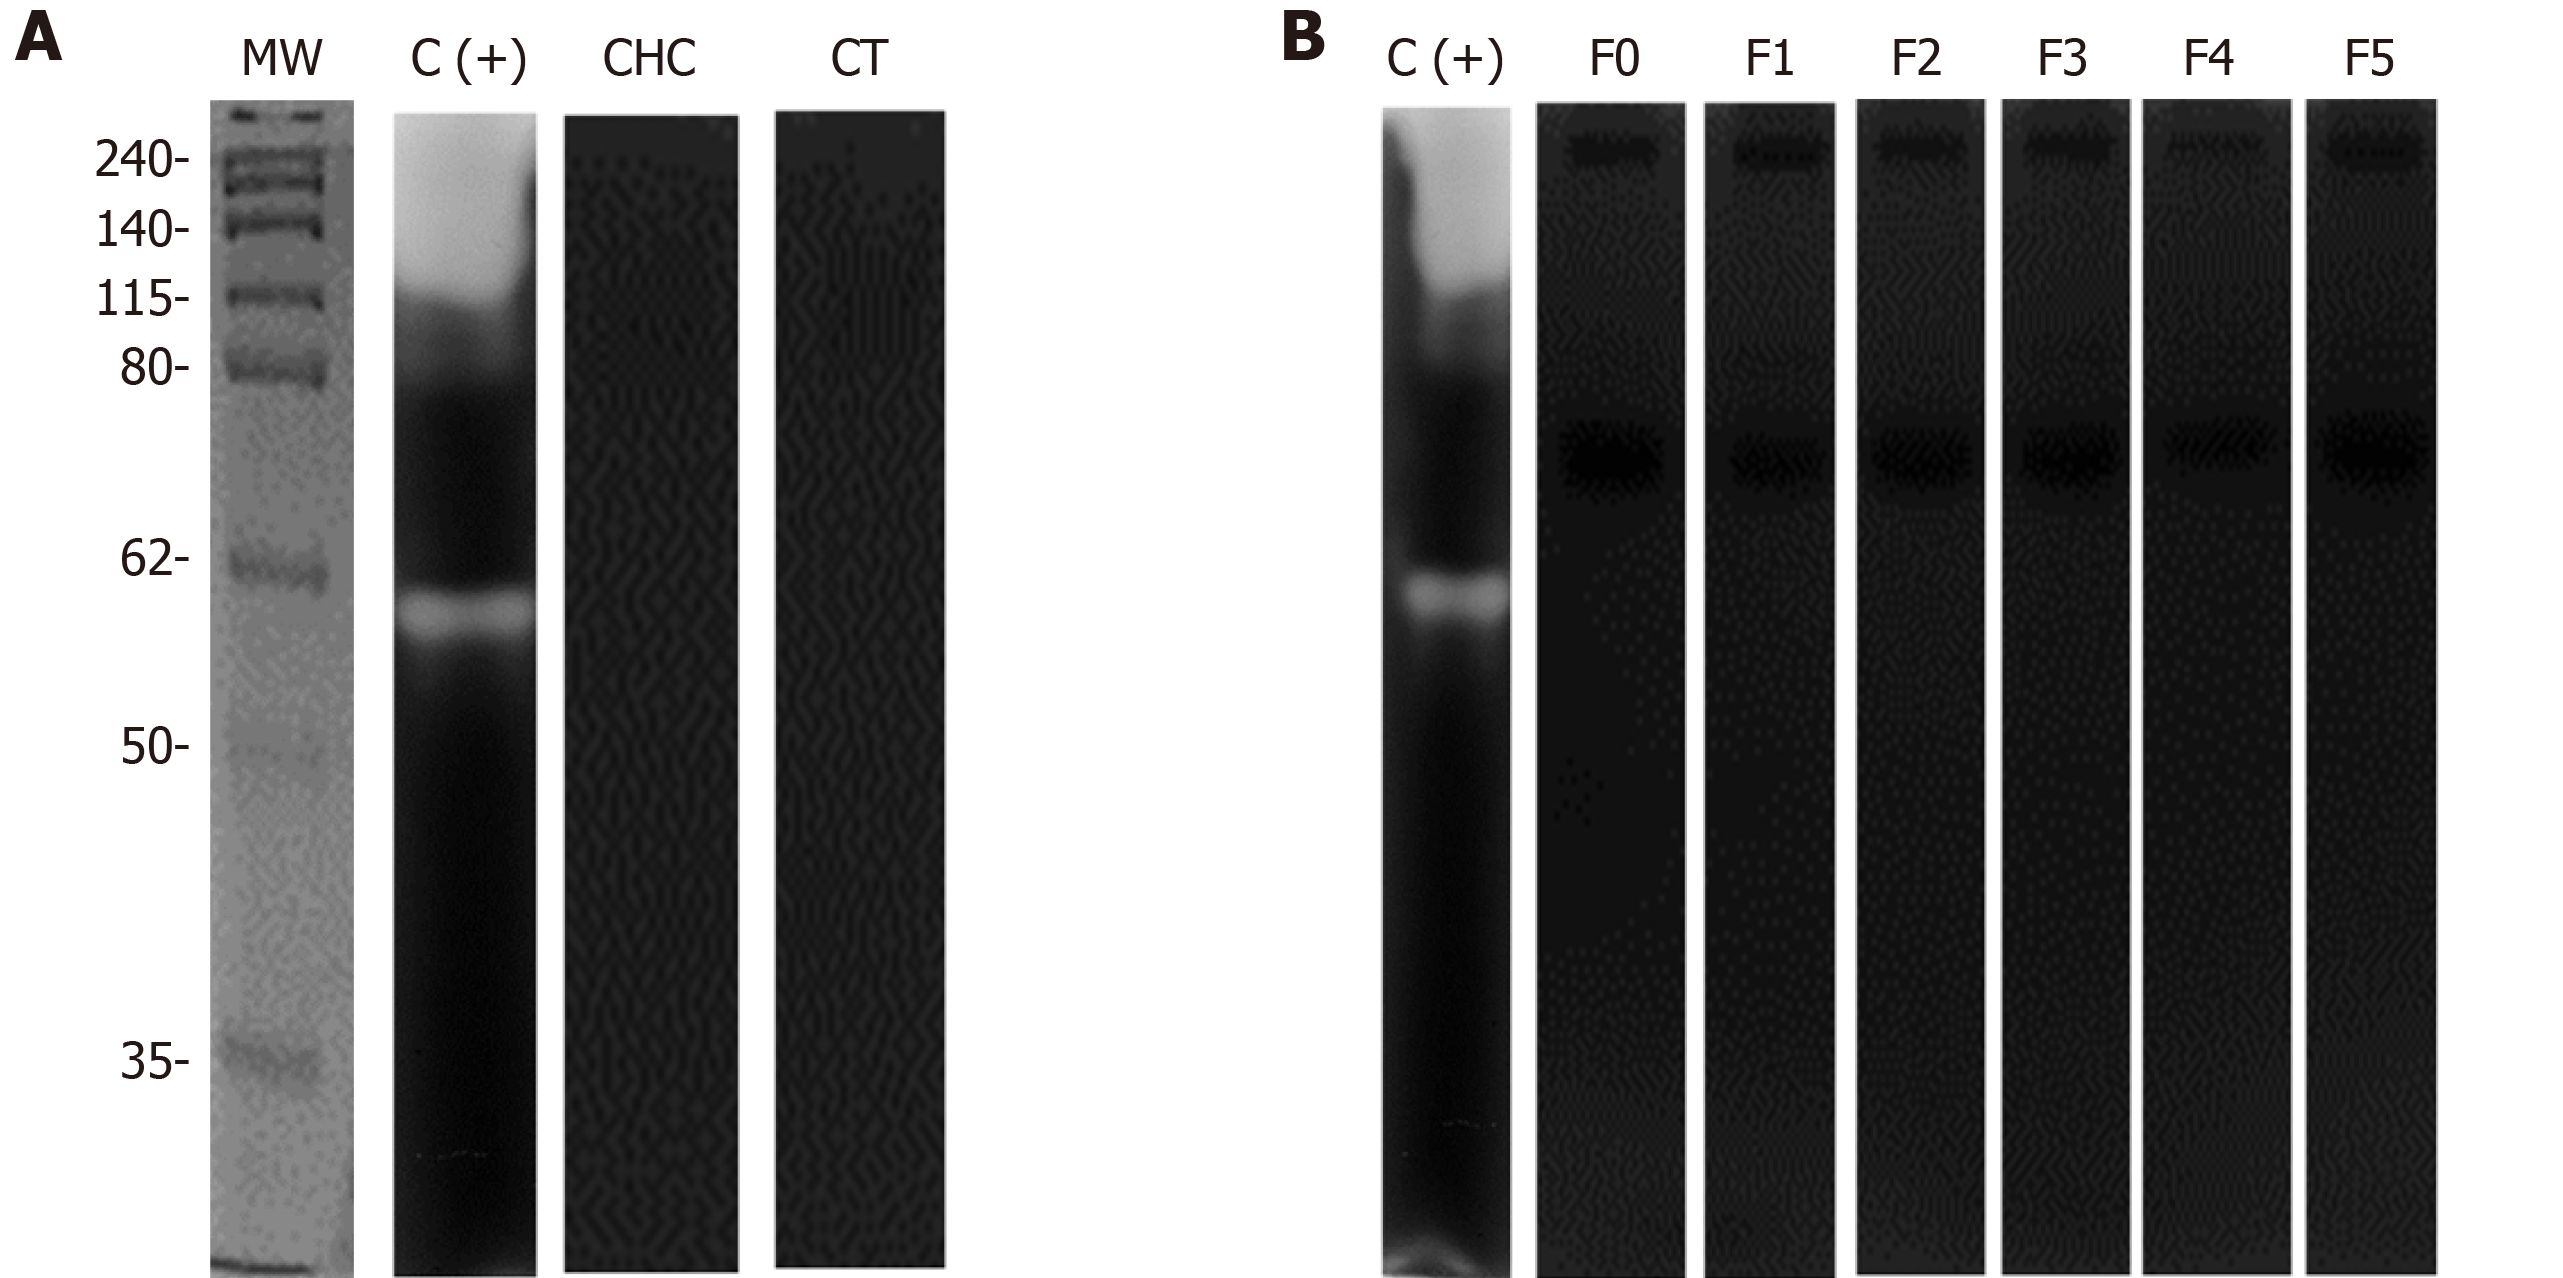
Figure 6 Evaluation of gelatinase activity by zymography.
A: Representative zymography assays in 10% polyacrylamide gel electrophoresis copolymerized with 0.1 % (w/v) gelatin (molecular weight pattern). A total of 10 µg/mL of serum from chronic hepatitis C (CHC) patients and healthy individuals (n = 20) was loaded. Zymograms were activated overnight at pH 9.0 at 37 °C; B: Determination of gelatinases in different fibrosis stages (F0, F1, F2, F3 and F4) in the serum of CHC patients. Collagenase from Clostridium histolyticum (5 µg/mL) [C (+)] was used as the experimental control (CT). Five samples of each fibrosis stage and CT were evaluated in triplicate. MW: Molecular weight.
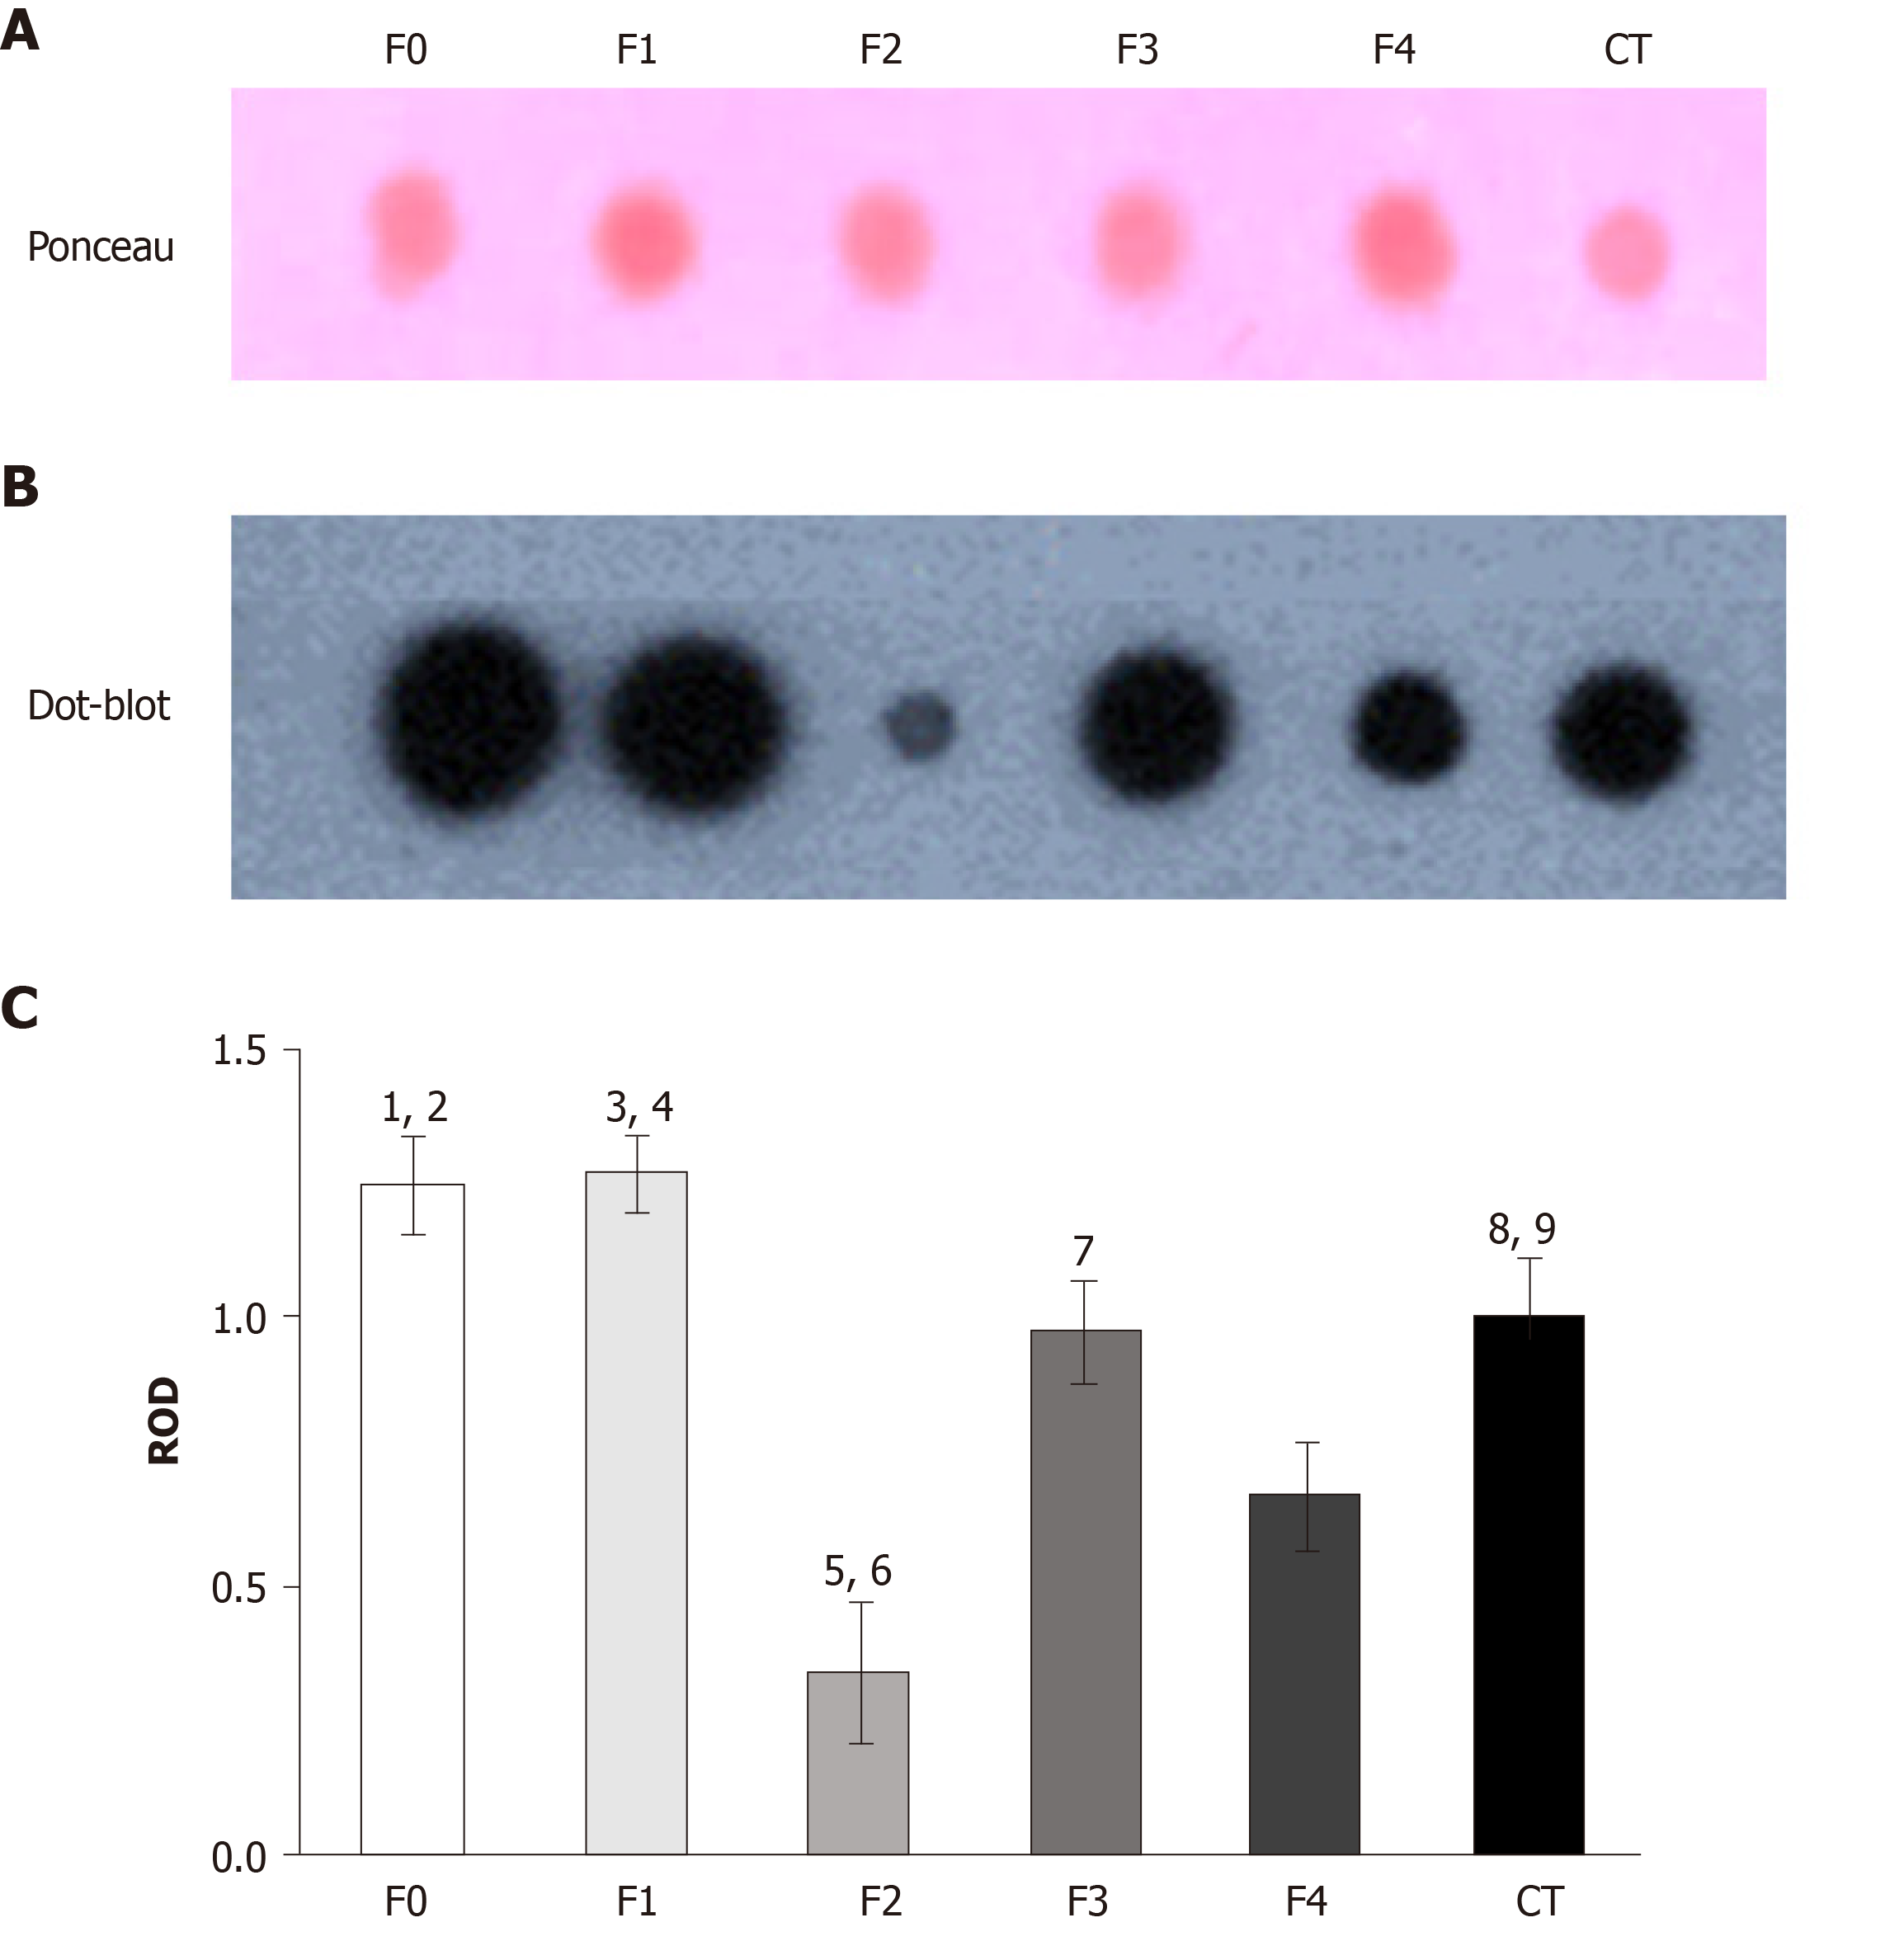
Figure 7 Tissue inhibitor of metalloproteinase -1 evaluations in the fibrosis grades.
A: Representative serum protein load (5 µg/µL) onto the PVDF membrane stained with the Ponceau S solution; B: Representative dot blot assay of tissue inhibitor of metalloproteinase-1 in the different fibrosis stages (F0-F4) compared with healthy subjects; C: Densitometric analysis of each fibrosis stage and the controls (CTs; black bars) was expressed as relative optical density (ROD). Random serum samples (n = 5) of each fibrosis stage were evaluated in triplicate. ROD analysis was performed using ImageJ software, and bars display the mean ± standard error of the mean. Group comparisons: 1 = F0 vs F2c; 2 = F0 vs F4c; 3 = F1 vs F2c; 4 = F1 vs F4c; 5 = F2 vs F3c; 6 = F2 vs F4c; 7 = F3 vs F4c; 8 = CT vs F2c; 9 = CT vs F4c; cP < 0.001 in all the groups compared.
- Citation: Martinez-Castillo M, Hernandez-Barragan A, Flores-Vasconcelos I, Galicia-Moreno M, Rosique-Oramas D, Perez-Hernandez JL, Higuera-De la Tijera F, Montalvo-Jave EE, Torre-Delgadillo A, Cordero-Perez P, Muñoz-Espinosa L, Kershenobich D, Gutierrez-Reyes G. Production and activity of matrix metalloproteinases during liver fibrosis progression of chronic hepatitis C patients. World J Hepatol 2021; 13(2): 218-232
- URL: https://www.wjgnet.com/1948-5182/full/v13/i2/218.htm
- DOI: https://dx.doi.org/10.4254/wjh.v13.i2.218


